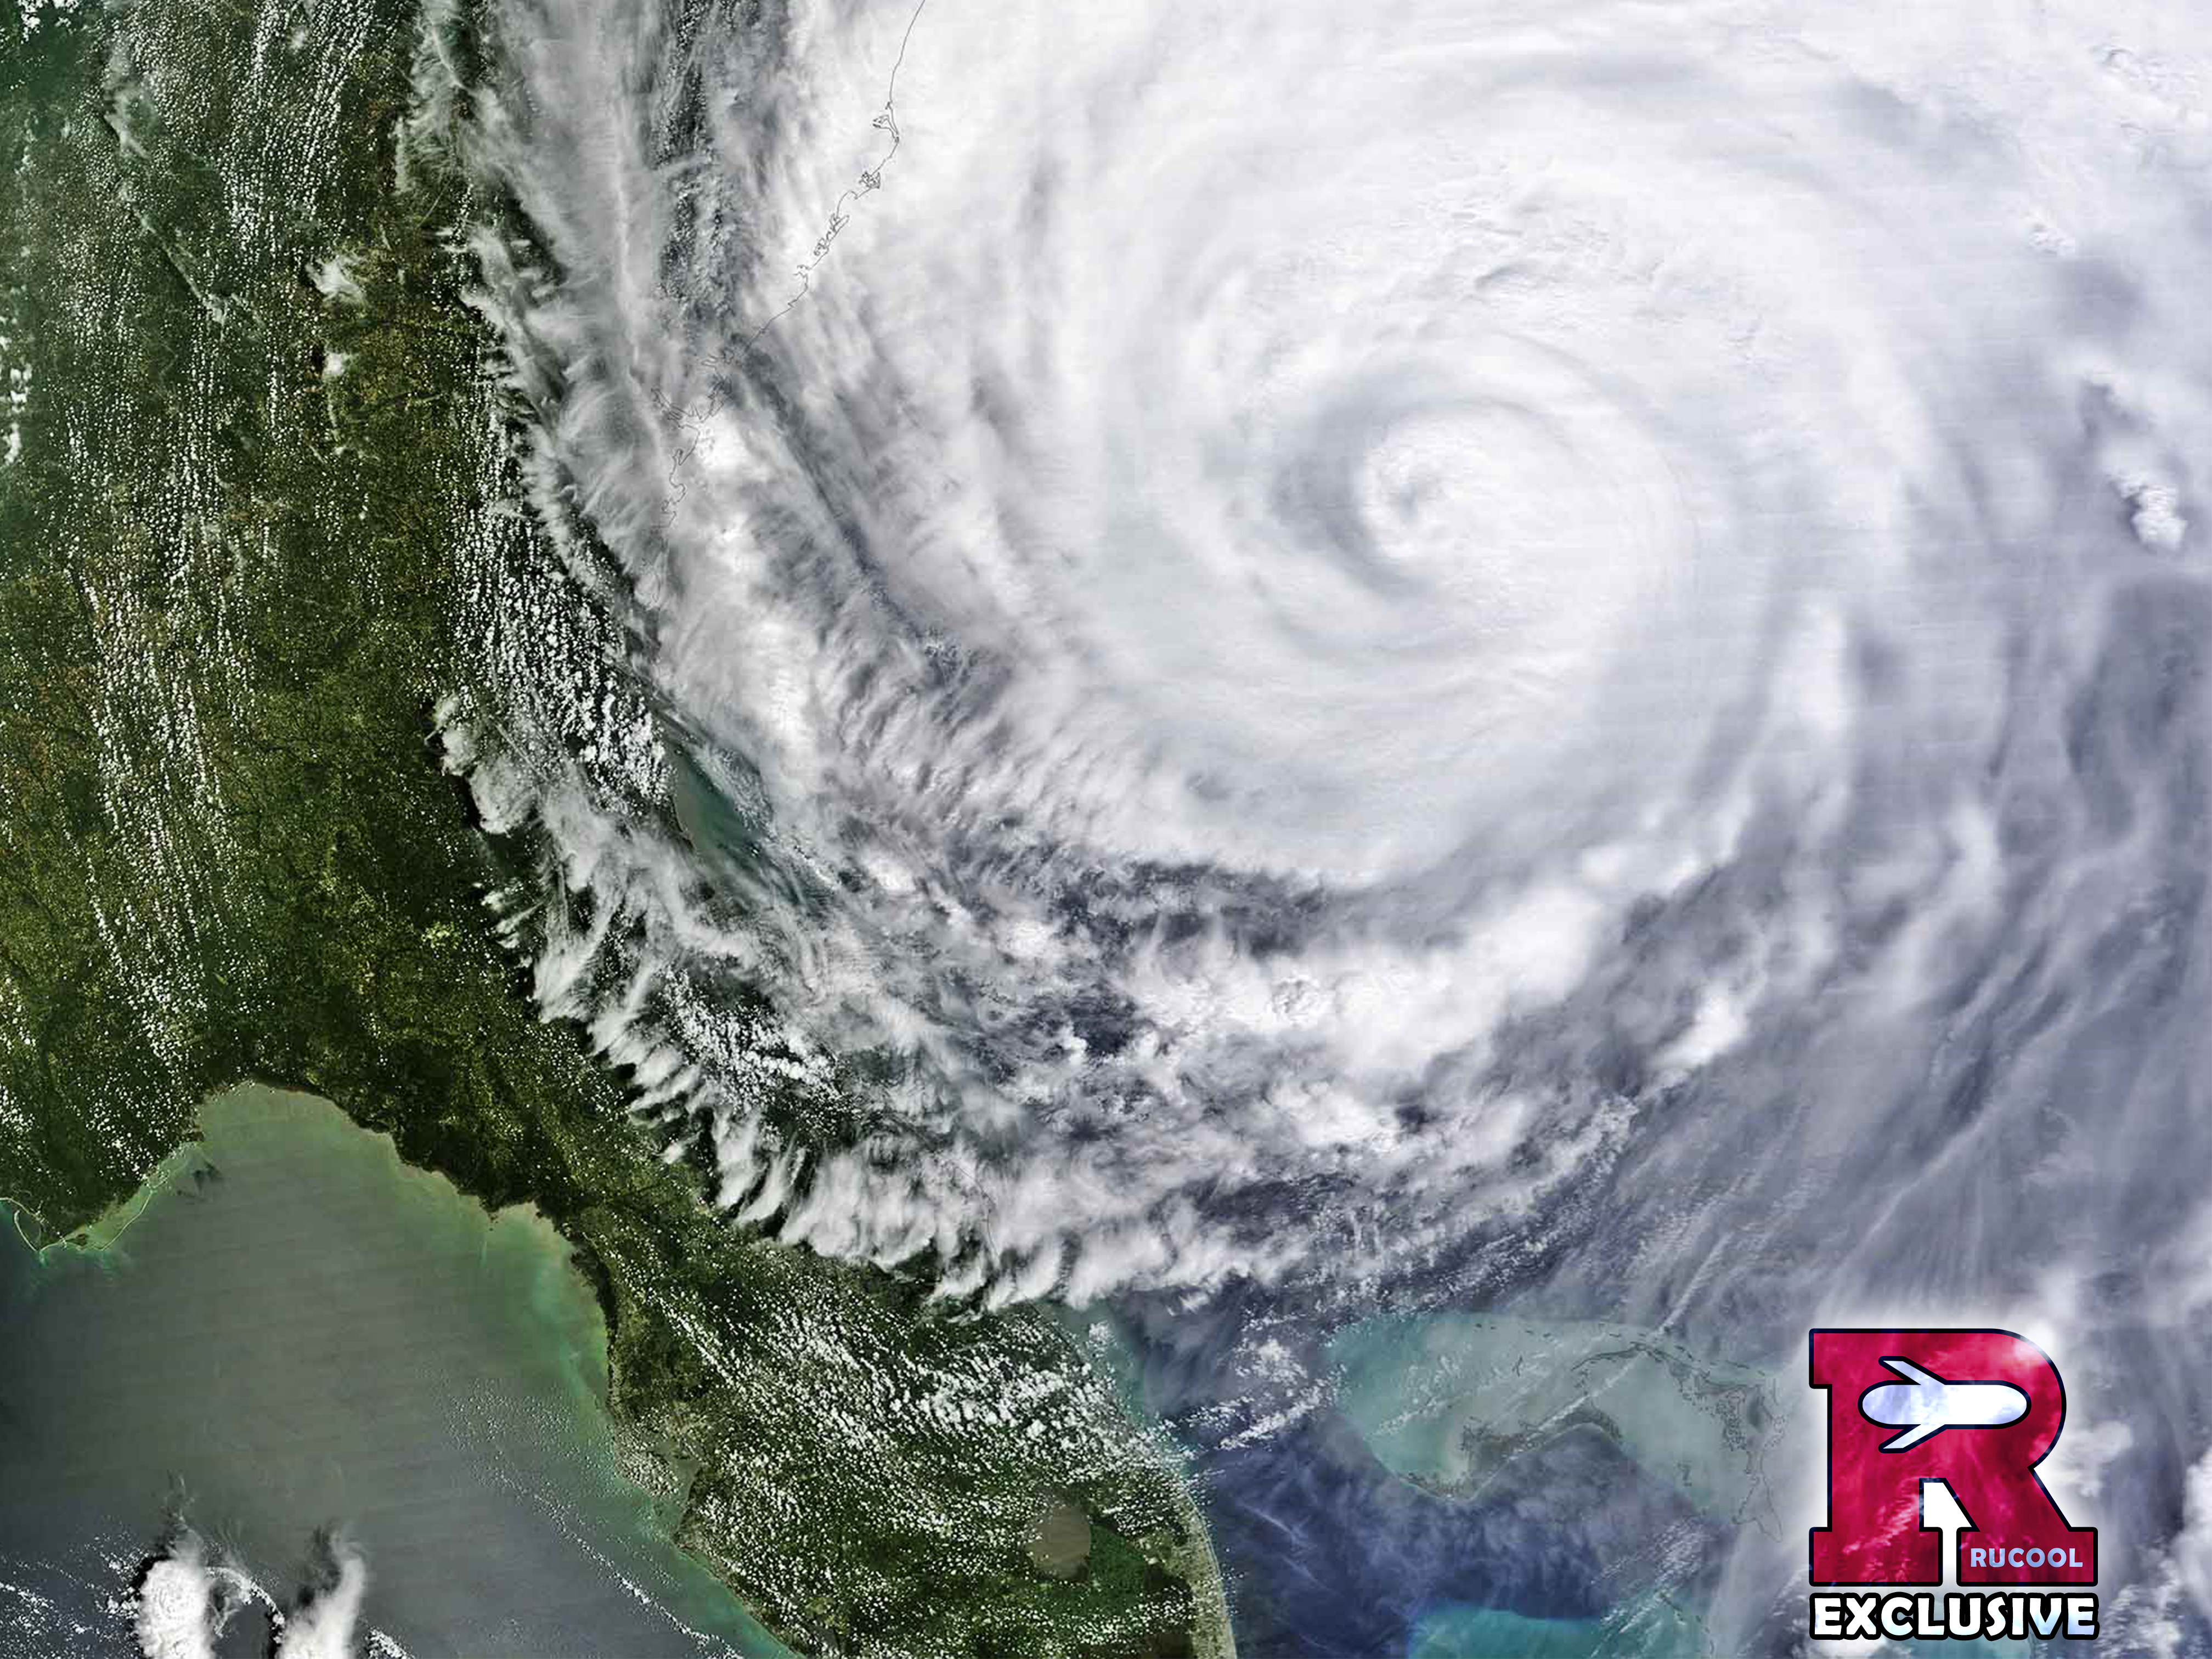
A researcher’s decision to put an underwater drone in Hurricane Irene’s path is helping to transform the science of hurricane intensity prediction.
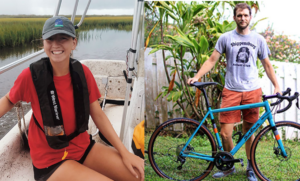
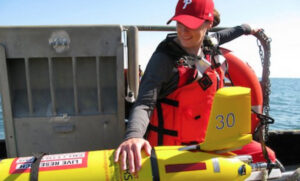
In August 2011, with Hurricane Irene bearing down on the mid-Atlantic coast, Scott Glenn, an ocean engineering researcher at Rutgers University, made a bold decision. While most other research teams moved their ships, personnel, and expensive hardware to safety ahead of the hurricane, Glenn left his data-collecting drone — a torpedo-shaped underwater “glider” about 6 feet long and worth about $150,000 — directly in its path.
Because that remote-controlled glider survived Irene — much to the relief of the New Jersey Department of Environmental Protection, which technically owned it — it may have helped to change the science of hurricane intensity prediction.
Hurricanes are considered atmospheric storms even though they can’t live without drawing fuel from warm ocean water. While scientists have long known that hurricanes leave the ocean below them substantially cooler as they pull up energy from warm water, forecast models have long assumed that ocean conditions are slow to change and therefore factor them in as constants rather than driving factors in determining a storm’s strength.
But Glenn challenged that assumption when his drone detected a rapid and sharp drop in ocean temperature ahead of Irene’s eye that coincided with a decrease in the storm’s intensity just before it hit the New Jersey shore. He confirmed that discovery in reverse 14 months later when a rise in water temperature as Hurricane Sandy approached the same New Jersey shore coincided with an increase in the storm’s intensity.
“It’s very simple,” Glenn says. “If the ocean’s warm, it increases intensity. If the ocean’s cool, it decreases intensity. So if you want to get the intensity right, you have to get the ocean right.”
If Glenn is correct, and data like his can be made available to meteorologists and researchers in a timely way, it could dramatically improve the accuracy of hurricane intensity forecasting, which has barely budged in recent years even as track forecasting has gotten better by orders of magnitude. It could also benefit emergency agencies, particularly in cases where residents have ignored warnings because previous forecasts were overblown.
“It makes all the sense in the world,” says Jennifer Francis, a senior scientist at the Woods Hole Research Center in Massachusetts who specializes in Arctic climate change and how that affects weather patterns in the middle latitudes. Until recently, Francis worked in the same department as Glenn at Rutgers, but she conducted no joint research with him.
“This really key factor is probably going to offer a big step forward in doing a better job with intensity forecasting,” Francis said.

Until drone gliders came along, forecasters had no way of knowing what was going on below the ocean surface during a storm. Unlike the hurricane-hunter aircraft that fly into and around storms, it’s too dangerous to leave ships in their path to take measurements. And satellites — which can only measure surface temperatures under the best of conditions — can’t detect anything through storm clouds.
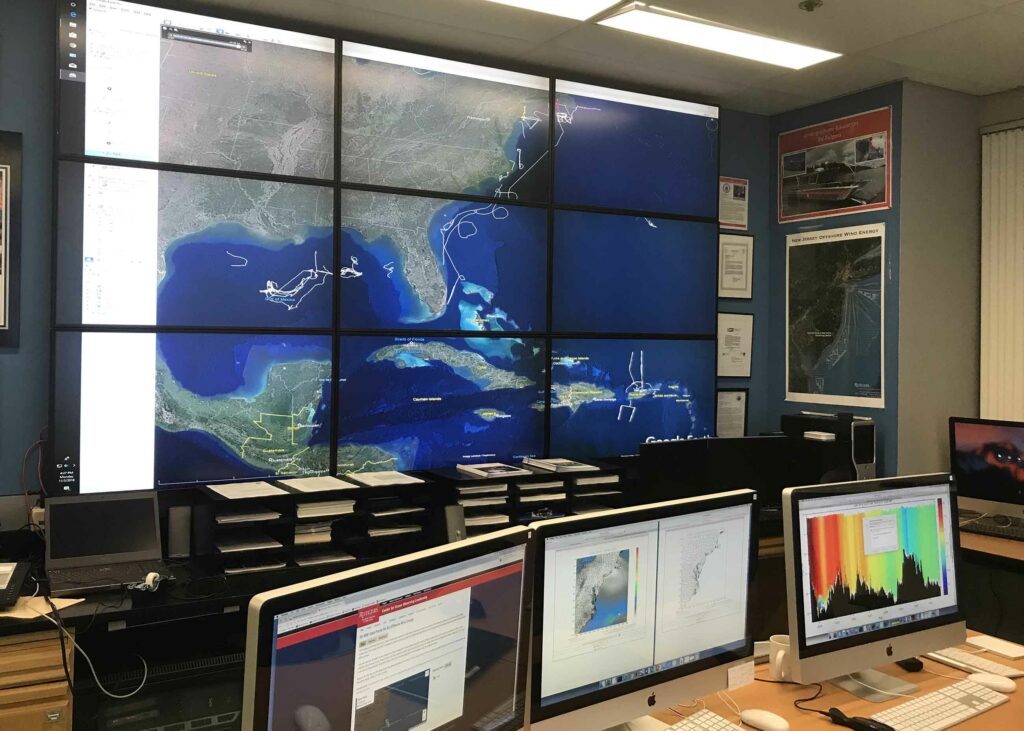
Glenn and other ocean researchers have been using underwater gliders since around the turn of the millennium, recording data like temperature and salinity over deep and large areas not otherwise easily accessible. The gliders have no engine. They use a battery to operate a pump system that sucks in water to shift weight to make them move up and down in the water at about half a mile an hour. An inflatable bladder allows the tail of the glider to surface and transmit some of its information by satellite, making it readable in close to real time on monitors virtually anywhere. The battery also operates the glider’s computer, instruments, and satellite communications and can last for months.
At the time of Irene’s approach, Glenn was measuring water quality when he decided to leave his glider in place to collect further readings during the storm. His data, which wasn’t fully analyzed until afterward, showed the water temperature dropped 6 to 11 degrees Celsius in the hours before Irene’s eye passed through. “We saw that there was a big change,” says Glenn, who is a distinguished professor in the Department of Marine and Coastal Sciences and co-director of the Center for Ocean Observing Leadership at Rutgers.
“Most of the literature talks about the cooling that happens after the hurricane passed,” he says. In this case, “the eye’s not even there yet and it’s already cooled. That was new.”
Not only that, the forecast that Irene would reach the New Jersey coast as a Category 1 storm turned out to be wrong — it hit instead as a tropical storm, one category weaker than predicted.
The mid-Atlantic region where Irene came ashore, along with a few other regions around the world such as the Yellow Sea, have dramatic seasonal ocean temperature swings and a clearly defined “cold pool,” or reservoir of cold water that sits below layers of warmer water in summer. As Irene approached from the south along the continental shelf, the data showed it churned up the cold pool into the warmer upper water so that the overall water temperature dropped dramatically before the storm hit land.
“That’s like going from summer to winter in 12 hours for the ocean,” says Travis Miles, an assistant professor at Rutgers who was a Ph.D. student working with Glenn at the time. “In the open ocean, hurricane researchers, when they look at temperature drops that might affect intensity — one degree Celsius can have a significant impact.”
Even though the colder water caused the storm to de-intensify, Irene still caused plenty of problems — especially inland as far as Vermont — but it was less than advertised in coastal New Jersey.
Beyond the glider data, Glenn’s team conducted more than 130 computer simulations using all kinds of variables, from currents to salinity levels, to figure out what contributed the most to the de-intensification. “Just changing the temperature was the most important thing by a factor of two or three to any of the other factors,” he says.
Then they went through 30 years of data from the National Oceanographic and Atmospheric Administration’s (NOAA) National Data Buoy Center. Even just looking at near-shore temperatures before and after storms, the team could see that all 11 hurricanes that went through the mid-Atlantic in summer experienced ahead-of-eye cooling. They also examined data from Typhoon Muifa in the Yellow Sea in 2011, finding that the storm de-intensified due to cold pool and warm water mixing as it approached Asian coastal areas.
“So it wasn’t just Irene,” says Glenn. “It was physics that was happening in hurricane after hurricane after hurricane. Nobody thought to even look at it.”
When Sandy hit a little more than a year after Irene, the team had an ideal chance to retest their findings. “We purposely put the glider in before Sandy,” Glenn says.
Sandy came in slowly from the east, perpendicular to the New Jersey coast. In the three days it took the hurricane to come ashore, the winds piled the upper-level warm water onto the shoreline, forcing the lower-level cold pool offshore. When Sandy finally hit, that cold pool was all but gone, leaving nothing but pure warm water — hurricane fuel.
“You can mix warm water all day and it’s going to stay warm,” Glenn says. “All it’s going to do is contribute to intensify the storm. Sandy actually intensified a little bit as it came onshore.”
This time Glenn’s team could see it as it happened, but there was no way to officially provide that information to forecasters. “I was sitting in a friend’s apartment in Manhattan with my computer open watching that cold water move offshore in real time the day before and I knew it was going to be bad,” Miles says. “There was no cold water left to cool that down like we saw in Irene. We knew in real time what was going to happen.”

Chris Slocum, a postdoctoral fellow in the Tropical Cyclone Group at the Cooperative Institute for Research in the Atmosphere at Colorado State University, is researching the atmospheric processes that control hurricane intensity change. “It will fill an information gap,” he says of Glenn’s findings, noting, as did others, that the ability to collect data that was never available before was itself a huge advance. But, he adds, “there are other pieces of information we also still lack that are equally critical for hurricanes.”
He and others point to research on hurricane eye walls and what’s known as the radius of maximum winds, the distance between the storm’s center and its most intense winds. And he says the energy exchange between the ocean and the atmosphere needs fine-tuning. But, he admits, “if we don’t get the ocean right, we’re going to be wrong.”
While no one discounts the value of monitoring ocean temperatures, most researchers caution against applying the Irene and Sandy findings too broadly. Mid-Atlantic conditions are fairly unique worldwide. Farther south, where water stays warmer, there is a less-defined cold pool that can produce the kind of mixing the Rutgers team detected. And in the Gulf of Mexico, a strong flow of warm water known as the Loop Current has effects on storms that don’t exist in the mid-Atlantic region.
“This isn’t like some silver bullet that’s suddenly going to make our intensity forecast better all the time, because there’s a lot of other processes that also affect intensity,” says Mark DeMaria, technology and science branch chief at the National Hurricane Center and a member of the Hurricane Forecast Improvement Project. While DeMaria and others believe there has been some improvement in intensity forecasting, he adds that “we still have a long, long way to go.”
Rutgers researchers have continued analyzing data to confirm their findings. In 2017, for example, they determined that Hurricane Jose, which never hit land directly, intensified due to conditions similar to Sandy. And they documented Typhoon Soulik’s de-intensification in 2013 due to cold pool and warm water mixing as it approached coastal areas of East Asia — similar to what happened with Irene.
They have published their findings in peer-reviewed journals, given talks all over the world, shared their research with other academic institutions, and made their case repeatedly to government agencies involved in hurricane forecasting.
Part of their goal is to make sure officials know when expensive and difficult evacuations are warranted and when they’re not. To do so, the data needs to be assimilated into existing models that atmospheric scientists use for hurricane predictions. Glenn and others say the current computer models are so faulty that the Rutgers temperature data has been typically rejected because it has been so different — a disconnect that exposed a longtime rift between the atmospheric and oceanographic camps.
But the Rutgers team has strong allies. One is the Integrated Ocean Observing System, or IOOS, part of NOAA’s National Ocean Service. Rutgers is a member of one of its 11 regional partnerships, the Mid-Atlantic Regional Association Coastal Ocean Observing System, a consortium of academic, governmental, and industry partnerships that runs from Cape Hatteras to Cape Cod.
“We see this as a huge opportunity to make a major impact at a relatively modest cost,” says Gerhard Kuska, the mid-Atlantic consortium’s executive director. “I think it’s a missing link in our region and may be in others.”
A critical mass of glider data from the 2018 hurricane season may finally convince hurricane forecasters and researchers that there is a large enough body of data to show that Glenn’s findings are more than isolated instances.
He has the Navy to thank for that. This past hurricane season, it tripled its glider fleet deployment to about 100, making 30 of them available for hurricane patrol. That enabled Glenn’s team to collect data from dozens of gliders — at least 10 times more than they’d ever had — in observational “picket lines” off Africa, where hurricanes form, as well as in the Caribbean, the Gulf, and the Atlantic.
“The key is that they’re there. If there’s any uncertainty in the track — it’s not like they’re going to miss one glider and then not hit any,” says Miles. “This is the first year where I didn’t have anxiety that we were going to have a storm and not capture data.”
Gliders were sent in as both Hurricanes Florence and Michael made landfall. The team’s initial analysis found that Florence de-intensified very rapidly and came ashore weaker than expected, though the major issue was still rain, which caused catastrophic damage. Michael did the opposite — rapidly intensifying as it came ashore.
“I can’t tell you why Florence de-intensified,” says Glenn. “There was no cold pool — the water was all warm.” As for Michael, the water around the storm was also quite warm. “Eighty percent of cooling was after the eye passed,” he says.
Glenn’s team expects to have that figured out by late spring after they sort through 123,000 data profiles from gliders and another 7,800 data sets from floating monitors. The live data from the 2018 gliders was added for the first time to a database called the Global Telecommunication System, which is accessible to forecasters worldwide. But it’s unknown if anyone has used it or even knows how.
“It’s good that I know it and it’s good that I can transfer this knowledge to another human forecaster, but what we want to do is put this knowledge in the physical models so the models can better predict these things,” says Glenn, who admits being frustrated with the slow pace of his data’s inclusion when lives are at stake in these storms.
“The programs are dominated by meteorologists. They should be dominated by meteorologists — it’s mostly a meteorology problem. It’s a hurricane in the atmosphere,” he says, chuckling. “But they have to let a few of us oceanographers in the room.”
Jan Ellen Spiegel is a freelance writer and editor based in Connecticut. Her work appears regularly in numerous local and national publications, including The Connecticut Mirror, InsideClimate News, Yale Climate Connections, and The New York Times.