-
Understanding penguin and whale behavior using GPS tags
Posted on December 20th, 2021 No commentsAuthors: Megan Cimino, Ross Nichols, Megan Roberts, Darren Roberts
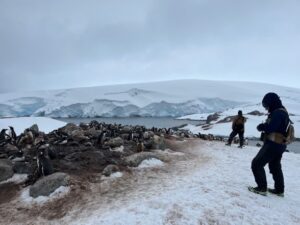
When we are not surveying from the large research vessel, we conduct our research from small boats (“zodiacs”) to either find whales or take us to islands with penguin breeding colonies. One of our main goals is to understand the foraging behavior of whales and penguin – where they go to find food, how deep they have to dive and how much time and effort they spend foraging. To do this, we use high-tech tags to measure time, depth and location, and some tags can even record video or measure ocean conditions like temperature.
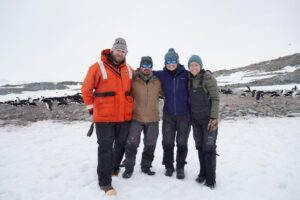
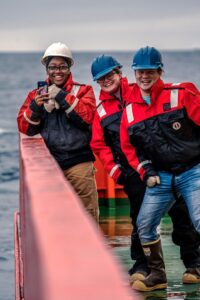
From left to right: Ross Nichols, Darren Roberts, Megan Roberts, Megan Cimino
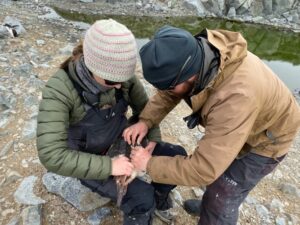
The process for tagging a whale and a penguin is very different but in both cases the tag is relatively small compared to the animal’s body size and so it causes little disturbance to the animal.
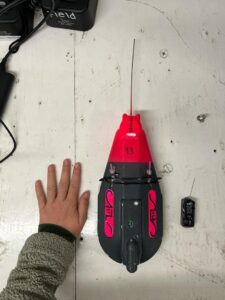
A comparison of tag sizes in relation to a human hand
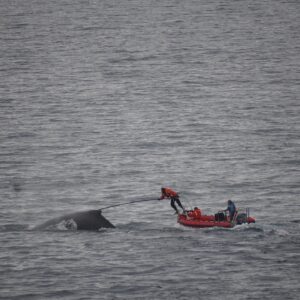
Whales, despite being a mammal, have bodies that are mostly hairless and lack small appendages where a tag could be secured. Instead, we use suction cups to attach our tags to their smooth bodies which can stay on their bodies for more than a full day. To attach the tag, we stand at the front of a small boat on a specialized platform called a “pulpit”. From the pulpit we hold a very long pole with the tag clipped into the far end. As we approach a whale in the small boat, we stick the tag onto the animal’s back, holding the tag onto the animal’s body through suction. The tag then records the movement of the animal, the dive depths, as well as recording audio and video.
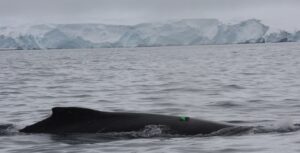
After losing suction over time while on the whale, the tag eventually loosens and releases on its own, floating to the surface. The tag then sends us a GPS ping where we can go to recover the tag and download the data! This data is very exciting because we can view the video of the animal and their environment and see how that relates to their behavior.
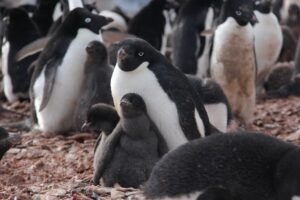
To tag a penguin, you first need to choose and capture an adult that has 1 or 2 chicks so that you can make sure the adult will return to the nest and you can get the tag back from the penguin in the same place where you found it. The tag is then attached to the penguins back with tape and zip ties. In a few days, we return to the penguin’s nest to remove the tag, and are then able to download the data! We are always excited to see where the penguin went (usually within 10 km of its colony) and how deep it dove (usually 20-50 meters).
-
Understanding seabird and whale distributions and populations from a big boat
Posted on December 15th, 2021 No commentsMegan Cimino, Ross Nichols, Megan Roberts, Darren Roberts
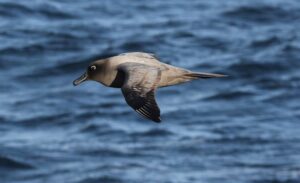
During this research cruise, the whale and seabird teams mainly spend the day on the ship’s bridge recording all seabird, seal and whale species. Because we are in Antarctica during the spring, there are very few hours of darkness, roughly midnight to 3 am. Therefore, the seabird team members – Megan and Megan – work in shifts, one person working in the early morning to midday and one member working midday to midnight. We have seen a variety of seabirds ranging from large albatross (the size of a small dog) to tiny storm petrels (the size of a hamster).

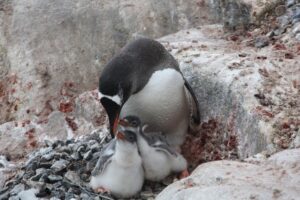
When the ship is near important penguin breeding colonies, the seabird researchers take a small boat to shore to count the number of nesting penguins to understand how their populations change over time in response to environmental conditions. A few days ago, team counted nearly 10,000 penguins in 7 hours using hand clickers, which required hiking over 6 miles in snowy and windy conditions. At this time of year, the penguins are beginning to lay and incubate their eggs that will hatch in late December.
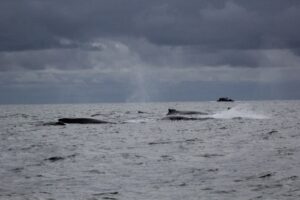
When a feeding and slow-moving group of whales are spotted from the ship, this provides an opportunity for the whale researchers – Ross and Darren – to go out in a small zodiac boat to take pictures and other biological samples. Pictures of whale flukes allow scientists to identify individual whales because their fluke is similar to a human’s fingerprint- everyone is unique! This allows us to estimate individual animal movements and population size. Small samples of the animal’s blubber can be used to determine if a whale is male or female, and can also identify if a female is pregnant. By monitoring the ratio of males to females and the rates of pregnancy, we can assess the health and growth of whale populations.
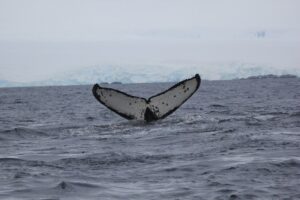
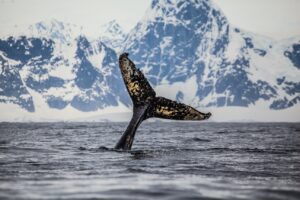
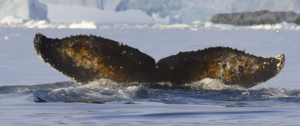
Identify a Whale! Can you tell these whale flukes apart?
These observations and samples are important because seabirds, seals, and whales are the major predators in Antarctica. These indicator species can tell us a lot about the health of the ocean’s ecosystem. It is difficult to know how many fish and krill are in the Southern Ocean but we can learn a lot by studying the health of larger animals that feed on them. Changes in the health of the animals or changes in species observed can tell us how the ecosystem is changing, especially in the context of climate change. As temperatures are warming rapidly in this polar region, it is very important to understand how these animals are responding to these changes to learn more about the overall health of our oceans.
-
Zoop Soup!
Posted on December 14th, 2021 No commentsRUCOOL is working with the Virginia Inst of Marine Sciences on our National Science Foundation (NSF) Long Term Ecosystem Research (LTER) project in Antarctica.
Who: The zooplankton team/members of Virginia Institute of Marine Science’s Steinberg lab
What: The zooplankton team has begun to conduct MOCNESS tows
When: December 2, 2021
Where: The more southern part of ocean next to the Western Antarctic Peninsula
Why: We perform MOCNESS tows to collect zooplankton from different depths. This lets us see how animals change as depth changes!
Finally!! We were able to put the “MOCNESS” in the water! “MOCNESS” is not a sea monster! It stands for “Multiple Opening Closing Net and Environmental Sensing System.” It’s not as complicated as it sounds. It is basically nine nets in one. We send all the nets down at once and then slowly bring the net up. As it comes up, we open one net, collect the animals that are there, and then close the net. Then we open the next net and repeat the process. This lets us see what animals live at different depths. The MOCNESS collects animals as deep as 1000m and as shallow as 50m!
Now what are these animals we are collecting? They are “zooplankton”! “Zooplankton” are any animal that cannot swim against the ocean currents. This can describe jellyfish, krill (shrimp-like animals), or larval (young) animals like crab and lobster. Zooplankton are everywhere and can come in all different shapes and sizes! In Antarctica the most common animals we catch are krill, copepods (think plankton from Spongebob!), chaetognaths (worms), and pteropods (snails). These animals are typically found shallow in the water column, so we can catch them in our simpler “Metro nets.” Metro nets are single nets that stay open all the time. We send them down to shallower depths and they collect the zooplankton they encounter.
So, now you know why the MOCNESS tows are special – we get to go deeper and we know where the animal came from! Another bonus is that we see animals that would never show up in our simpler nets because they live in deeper waters. For example, in our MOCNESS tows we may see a lot of red and black amphipods (bugs), big jellyfish, and sea spiders!
After we conduct Metro tows or a MOCNESS tow, we work as a team to identify, count, and measure the volume of every animal. We may also conduct experiments on the live animals!. One is a “fecal pellet production experiment” – essentially watching and waiting for the animals to poop! We place the animal in a bucket full of seawater, leave it for a few hours, and then collect its poop. We want to learn more about the carbon and nitrogen that goes to the bottom of the ocean when these animals poop! Our other experiment involves larval (or young) fishes. In this experiment we want to measure their “thermal tolerance,” or what is the hottest temperature they can survive at. The fishes in these experiments are typically not found in other parts of the world!
About the Authors: Maya Thomas and Tor Mowatt-Larssen are graduate students at the Virginia Institute of Marine Science and Meredith Nolan is a senior at the College of William & Mary. This is all their first time to Antarctica!
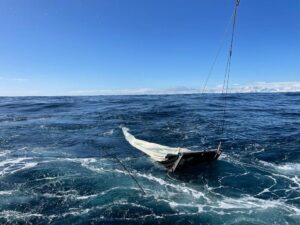
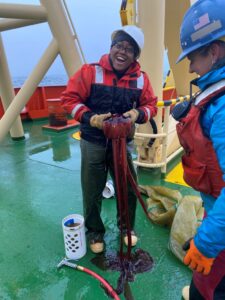
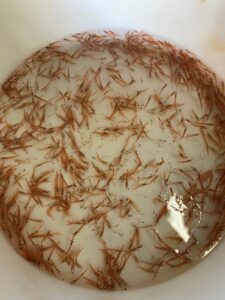
Images: a. The zooplankton team admiring the Antarctic scenery before a net tow. (Left to Right: Maya Thomas, Meredith Nolan, Tor Mowatt-Larssen). b. A Metro net coming out of the water with all the zooplankton that it has collected. c. Maya Thomas with a large jellyfish from a Metro tow. These are rare to find in our nets! d. An example of what a Metro net collects. The large, orange animals that look like shrimp are Antarctic krill!
-
Phytoplankton and water chemistry (chemistry can be and is fun!)
Posted on December 11th, 2021 No commentsWho: The most excellent Van Mooy group from the Woods Hole Oceanographic Institution – with friends and collaborators from three other institutions!
When: November 22nd to December 15th
Where: We take samples from the top of the ocean to the bottom, to look at how phytoplankton are changing the water they live in and being changed by it.
Why? While algae might seem tiny and like they are not as important as animals like whales, seals, or penguins, they are actually what cause many of the changes in the world’s oceans! Even more than that, they are the food all those bigger animals eat!
My team looks at the ways that phytoplankton, which are tiny algae (a lot like plants), grow in the ocean. They need sunlight, so they are concentrated in the surface. However, they also need food, or nutrients, which they can use up quickly when there is enough light. My lab looks at the balance between things like nutrients and light, to see how phytoplankton change when those factors change.
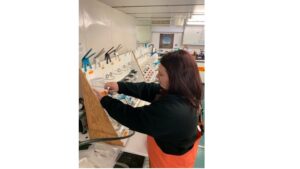
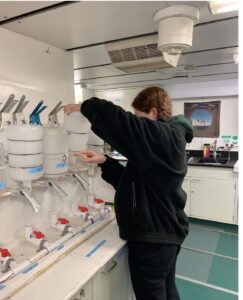
Putting bottles of seawater into the filter rigs. This is how we filter the water to find out how much phytoplankton and particulate organic carbon there is inside one to two liters of seawater.
Not only can a single algal cell change how it’s growing, but the types of cells often change as they each are fairly particular in what they like. Think of them as picky eaters – they don’t stick around when their favorite dish isn’t at the table, or there isn’t enough of it – because someone else has pushed them out! This is what we refer to as a “niche”.
My favorite thing about phytoplankton is that they are not only impacted by the water around them, but they also change that water, in a really beautiful circle. To understand how these tiny organisms function, you have to understand the chemistry of the water. And, you have to understand how they are changing that chemistry as they grow, live, and eventually die and sink, or are eaten. What happens to algae when they die is almost as important as how they live.
Together, phytoplankton and the water they live in make up an ecosystem all on their own, which is beautiful all by itself. Then, you can add in how they are food for animals like krill, which feed penguins, seals, and whales. But really, it all starts at the most microscopic levels, and my goal with this research in Antarctica is to understand how phytoplankton are changing as the chemistry of the oceans change, and then how that might make a difference to those larger animals too.
About the author: Shavonna Bent is a graduate student at Woods Hole Oceanographic Institution. This is her third research cruise.
-
Phytoplankton, Lords of The Sea!
Posted on December 8th, 2021 No commentsWednesday, December 1st
CURRENT PROGRESS: Happy Antarctica Day!
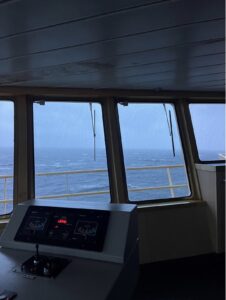
Hey everyone, Quintin here! I’m a biological oceanographer with the LTER (Long-Term Ecological Research) project here on the Nathaniel B. Palmer (NBP). It’s another day of exciting Antarctic scenery here looking through the portholes on the NBP, since a large storm is hitting the Western Antarctic Peninsula! While that gives us a lot of high winds and cool waves to look at, it also means we have to shut down science until the weather is safe enough to drop our instruments over the side. This is definitely unfortunate, but it gives us all a great chance to make plans for the rest of the expedition and process data!
So far we have made significant progress down the peninsula and have reached Adelaide Island, one of the major islands on the coast (and home to Rothera Station, an Antarctic research base owned by the British!). Now that we have come so far south and have completed nearly 60% of our expedition, we are making plans to do process studies at a couple locations along the coast. Unlike our previous sampling sights, we will stay at these process study locations for 2-3 days and sample every 12 hours or more! We do this so we can understand the differences in our respective focus areas (e.g., phytoplankton, bacteria, zooplankton, physics, etc.) over time and run experiments that require us to be in one location for an extended period. It should be an exciting time, and marks one of the final stretches of science before we start packing up and heading back to the US!
PHYTOPLANKTON: The Grass Of The Sea
For biological oceanographers, part of being out in the field on research trips like this one is to collect samples of the plants and animals that live in the ocean so we can gather data from them later. I and others in my lab are focused on collecting and studying the phytoplankton (microscopic plants) in the ocean, and that means lots of filtering water! Much like the grasses that cows graze on in farms or the grass in your front lawn, phytoplankton are essentially the grass of the sea. They are super tiny bits of plant, made up of a single cell, that are everywhere in the surface ocean. The only difference between the grass on your lawn and the algae (phytoplankton) in the ocean is that the algae are too small to see! Despite being so small, the phytoplankton are super important to the ecosystem, since they are the ones that harvest energy from the sun and make it available to all the larger critters like zooplankton that are eaten by whales, seals, and penguins. Because the phytoplankton are so important, we want to understand how much there is, how they grow over time, and what different kinds of phytoplankton exist in the water. This information can tell us a lot about the base of the food web and how we might expect it to change over time to impact all of the larger critters that thrive in the unique Antarctic areas!
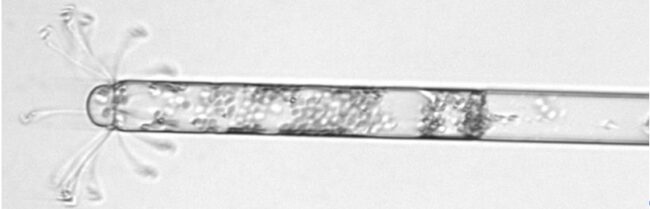
A picture of a diatom taken by a special camera called an Imaging Flow CytoBot. Diatoms are a type of phytoplankton that live all over the world, and there are many diatoms in the Southern Ocean near Antarctica.
About the author: Quintin Diou-Cass is a graduate student at Rutgers University. This is his fifth research cruise.
-
Let the science begin!!!
Posted on December 8th, 2021 No commentsWhat: Science on the research vessel Nathaniel B. Palmer has begun!
When: November 20 to November 22, 2021
Where: The ocean along the coast on the west side of the Antarctic Peninsula. The Antarctic Peninsula is the part of Antarctica that sticks up like a finger toward the southern tip of South America.
Why? We want to know what is going on with the ice, plants, and animals, and whether the conditions are changing from year to year.
Good morning from the research vessel Nathaniel B. Palmer in the waters west of the Antarctic Peninsula. I am happy to report that we have started doing science!
Our first order of business was to drop off a field camp on an island. A group of seven scientists will live there for a month. Their main job is to walk around the island every day counting and observing all the seabirds and seals. Their camp is a few small wooden buildings up on a snowy hill. To get there, they had to make many trips back and forth from the ship to the island in small inflatable motorboats called “zodiacs.” One trip would be for people, then the next trip would be for a load of gear… and repeat! To get on the boast, people had to descend from the high edge of the ship into the small boat down in the water many feet below. They climbed down a rope ladder and dropped into the small boat one by one. We are thinking of our friends at the field camp and we hope they are doing well. We will pick them up after the end of our research cruise on our way back to port in South America.
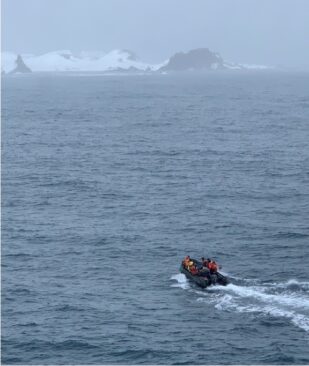
A small boat called a “zodiac” drives out to drop off seal and seabird researchers at Cape Shirreff on Livingston Island, one of the South Shetland Islands.
After dropping off the field camp, we started sampling the water! Now that we have started sampling, each day when we go down to the labs, we ask, “When is the next CTD?” What we mean is, “When is the next time we are sending our big frame of bottles down into the ocean to get water?” The term “CTD” stands for Conductivity, Temperature, and Depth. Conductivity is a measure of the ocean’s salinity. The CTD is a small machine at the bottom of our big white frame we send into the water. The big white frame is called a “rosette” because it is a circle of bottles, or the “CTD-rosette.” Each bottle is open at both ends when it goes down through the water. Then, on the way back up, we sit at a computer that connects to the CTD-rosette and tell it when to close the bottles at lots of different depths below the surface. When we want to close a bottle underwater, we click a button on the computer that says “Fire!”
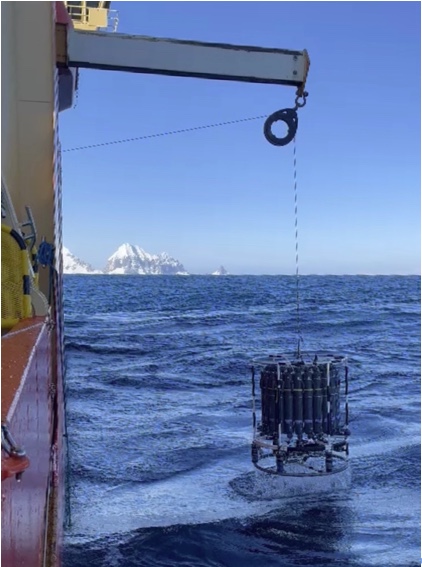
The CTD-rosette going into the water at the first place where we did our science sampling.
After our first few stations, we are steaming south. We have passed 64 degrees south latitude, which means the days are getting long. The sun comes up at about 3:00 AM and sets at about 11:00 PM, but it never fully gets dark. Instead, it looks like sunset and sunrise are one long time of day, where the sky looks like it does at dusk and dawn in the United States.
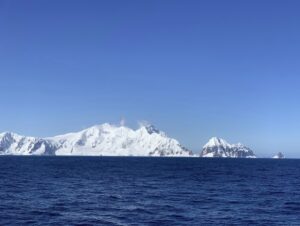
A view of the snowy mountains surrounding Bransfield Strait, the first place where we did our science sampling.
About the author: Jessie Turner is a postdoc (researcher) at the University of Connecticut. This is her fourth big research cruise.
-
Life on a Research Vessel
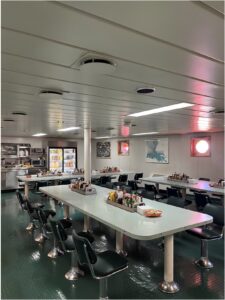
Posted on November 26th, 2021 No commentsLife on the research vessel Nathaniel B. Palmer, or the NBP for short, is fun and exciting! My daily routine changes every day and will change a lot once we start to sample for 24 hours a day, but for now here is what I do. I wake up on the top bunk of a bunk bed, climb down and pick out some work clothes to wear. I go downstairs to the galley, where there is a ton of delicious buffet-style food available. I usually sleep through breakfast, but a good example of a meal is what I had for lunch today. I had curried veggies and rice, hummus and cucumbers from the salad bar, and an orange. There are tons of options for everyone and lots of yummy desserts and snacks available all day!
Afterwards, I head to my lab to start preparing for the constant CTD sampling. This could be anything from organizing and setting up our lab to cleaning equipment to calibrating machines. We also had to spend time tying down all our equipment and placing grip mats under things that could slide because it was a rocky ride here!
To get from Chile to Antarctica we had to cross the Drake Passage, which is a notoriously rough channel where two seas meet. After lab work, if I have spare time (which I almost always do at this stage of our trip), I head to the third-floor conference room or another quiet room to do some schoolwork. I’m currently balancing five college classes along with working here, which is time consuming but manageable. There’s enough Wi-Fi for all of us, and there’s even enough to make phone calls home! If I’m feeling adventurous and the technicians give us the clear, I can go outside to view the seas from the back deck or on one of the upper-level decks. The captain also lets you watch the front of the ship from the bridge, the control room, which is great for bird and whale watching!
The NBP has a nice gym for the few times I feel like working out and there’s even a sauna. At night, I can head to the second-floor lounge (equipped with super comfy chairs) to pick from one of the 3,000+ movies or games that are available.
Life on the NBP is more relaxed now, but soon it will become hectic with the 24/7 sampling. For now, I’ll enjoy this!
-
Early Season at Palmer
Posted on January 7th, 2019 No comments2018 Spring Phytoplankton Bloom!
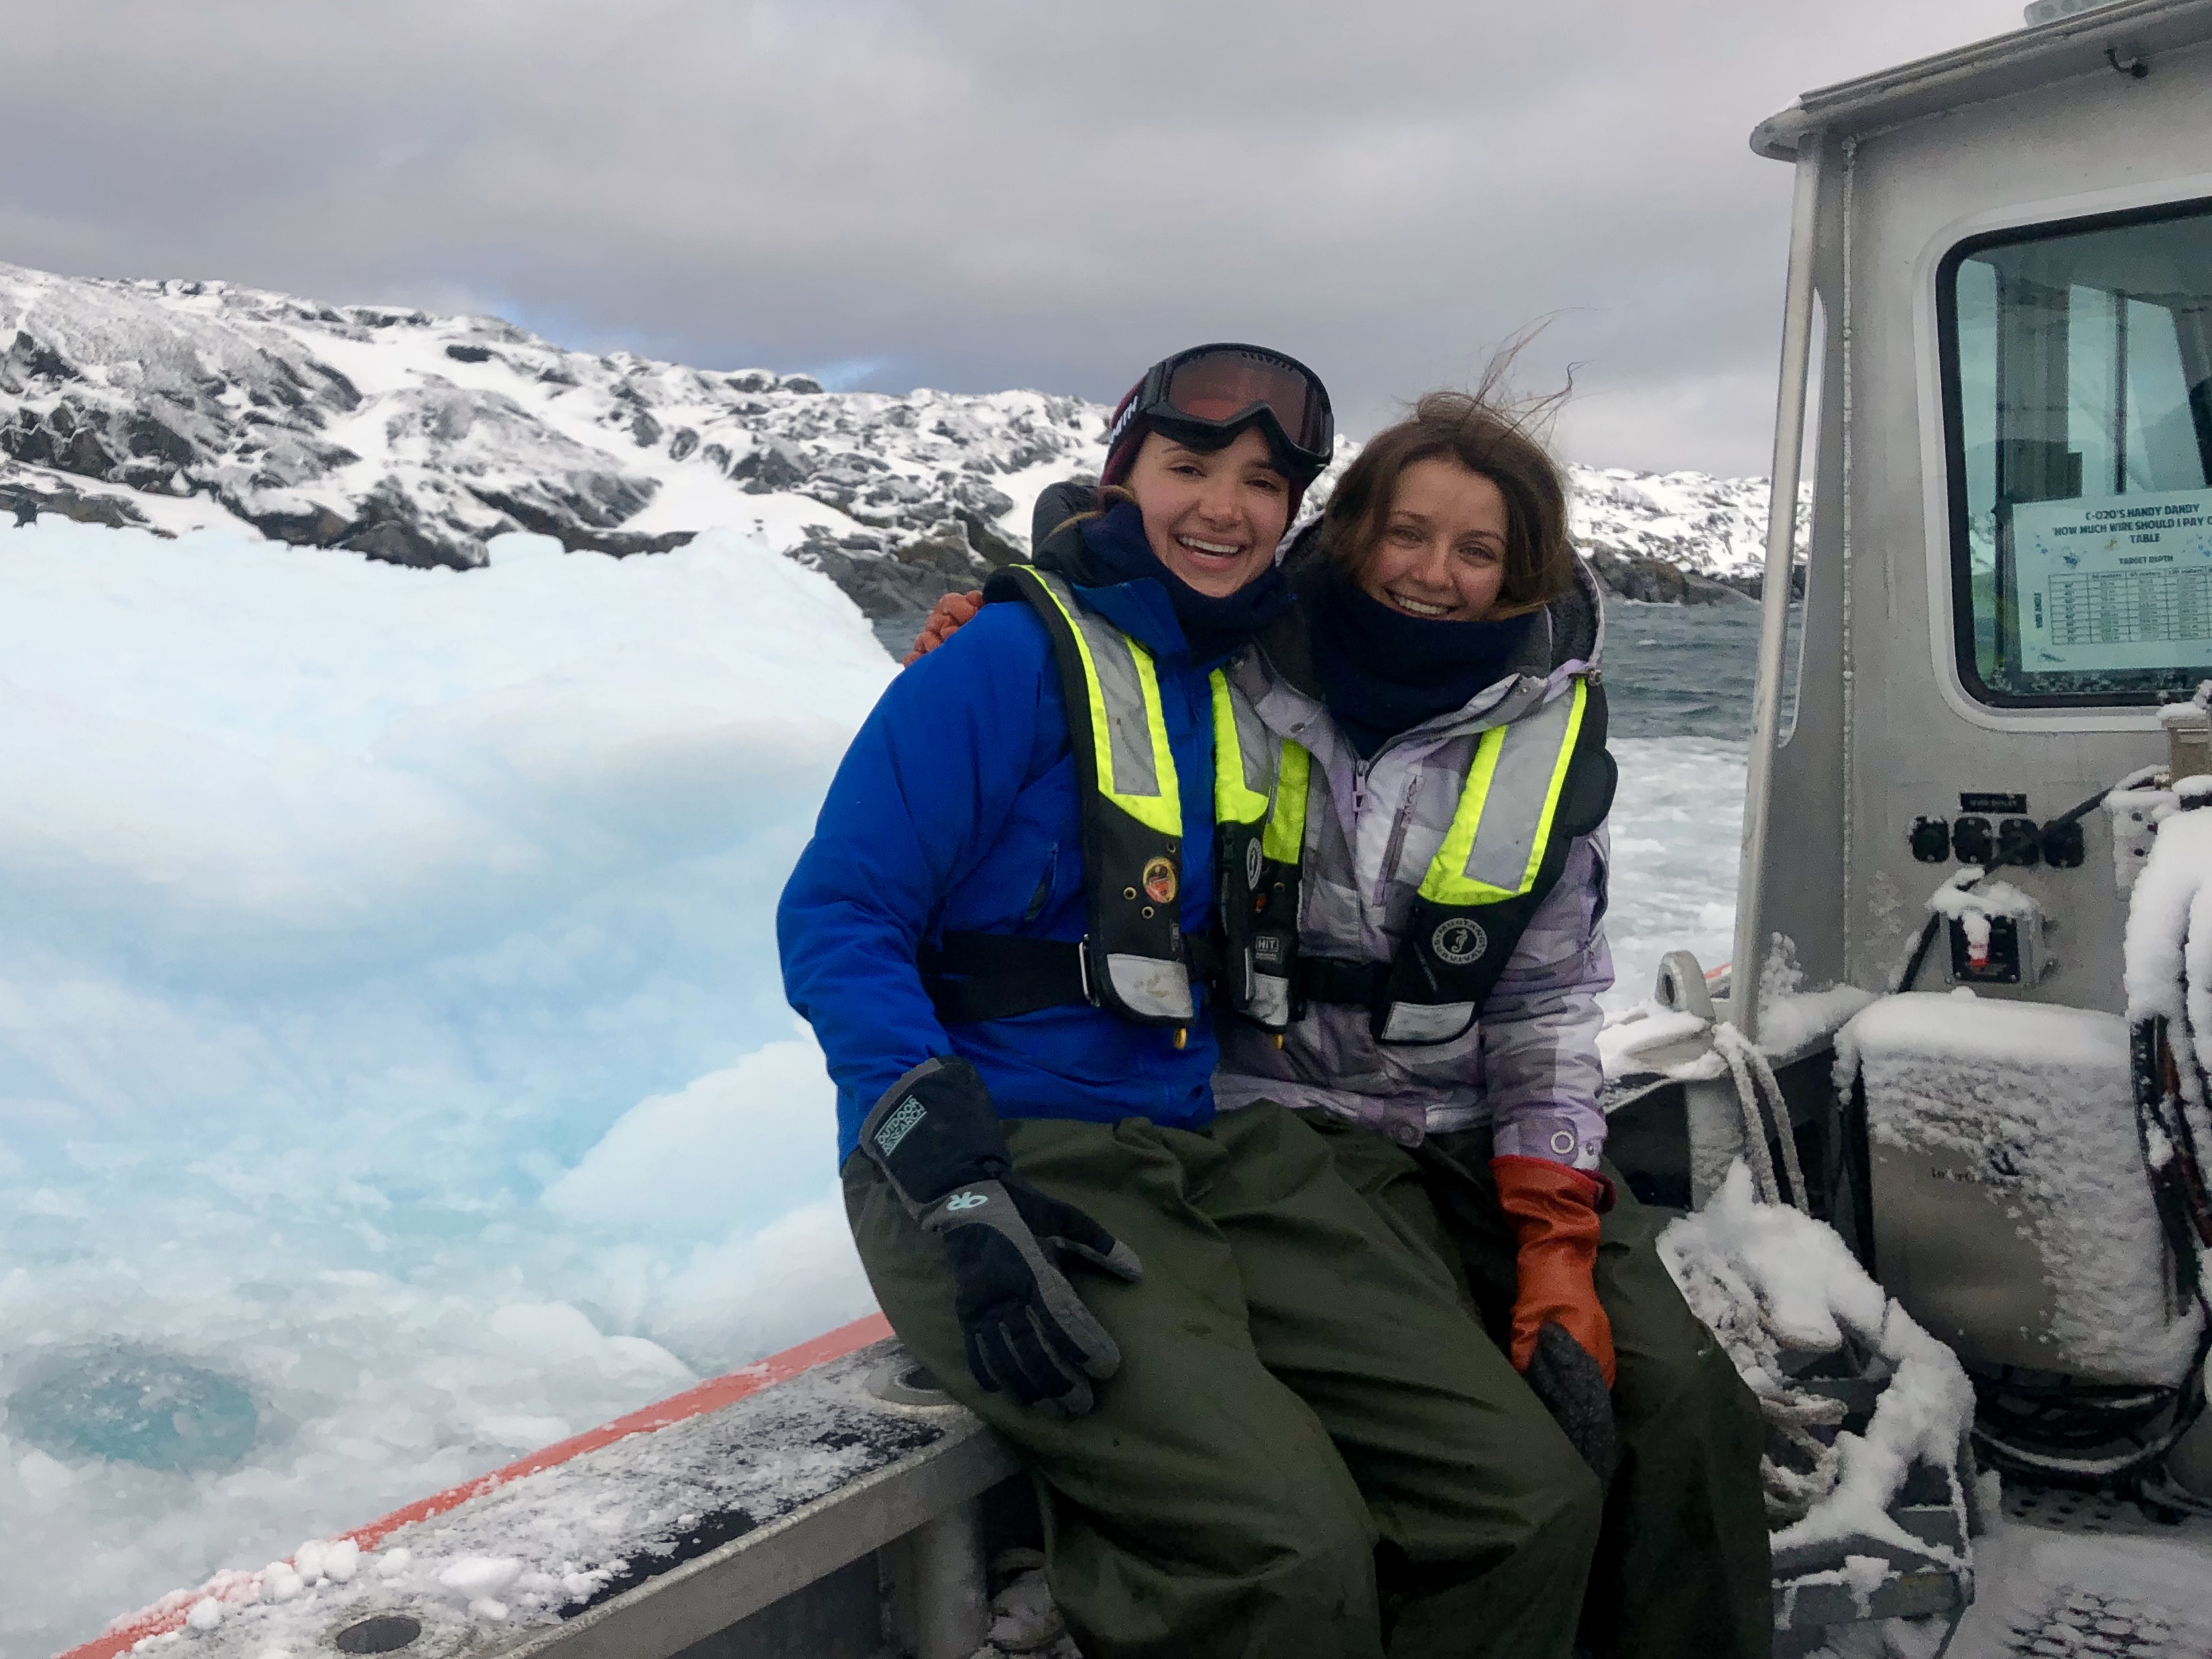
After 30 hours of travel from the US to Punta Arenas, Chile, and then a four-day transit on R/V Laurence M. Gould across the Drake Passage, Marie Zahn and Anna Bashkirova representing the Schofield team arrived on October 6th, 2018 to Palmer Station.

Marie Zahn (left) and Anna Bashkirova (right) aboard RHIB Hadar.
Typically foul weather conditions inhibit early season sampling, but this year’s open water and manageable winds allowed us to completely capture the first spring phytoplankton bloom, peaking around November 19th.
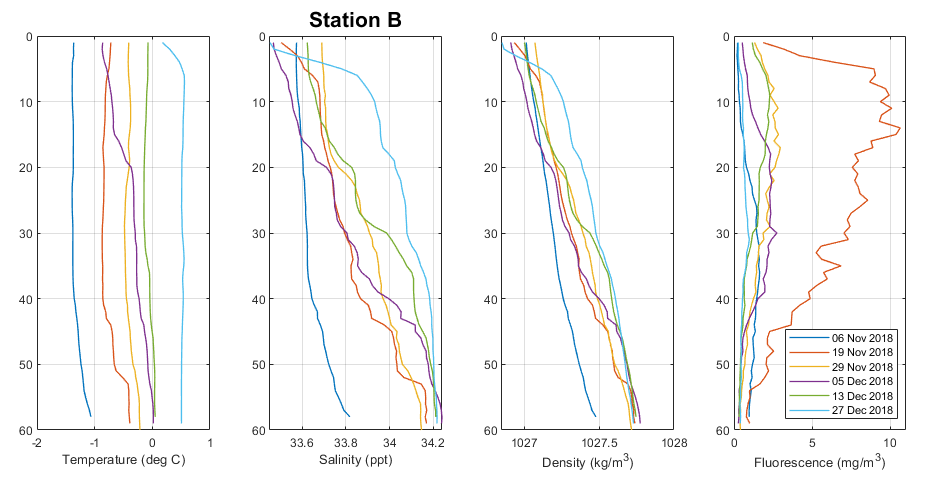
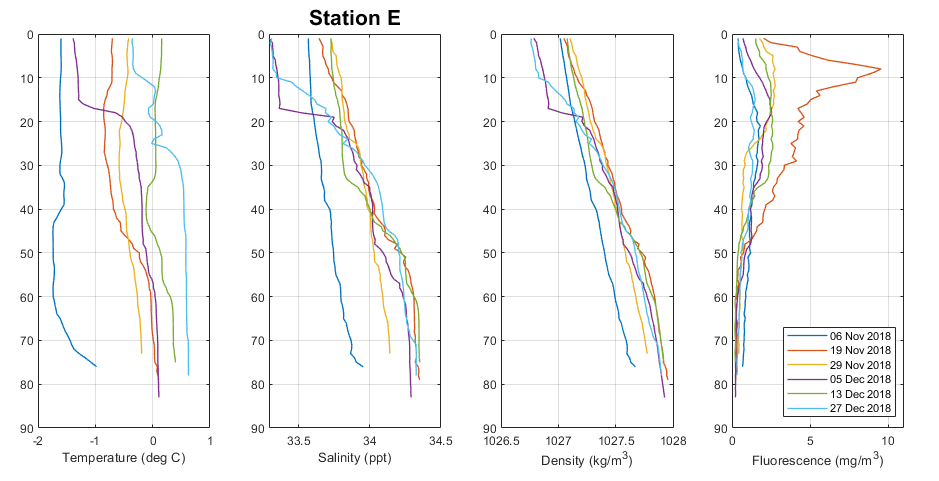
Wind speed decreased after the first week of November and sea ice retreated, allowing sufficient sunlight and water column stratification for a bloom. Stratification was especially pronounced November 15-19 and best observable in salinity and density values from CTD profiles collected at two locations: Stations B (nearshore) and E (offshore). This was accompanied by a steady rise in fluorescence, primary production, and chlorophyll concentrations, all three reaching a peak on November 19th. Strong winds beginning November 18th soon mixed the water column, quenching the bloom.
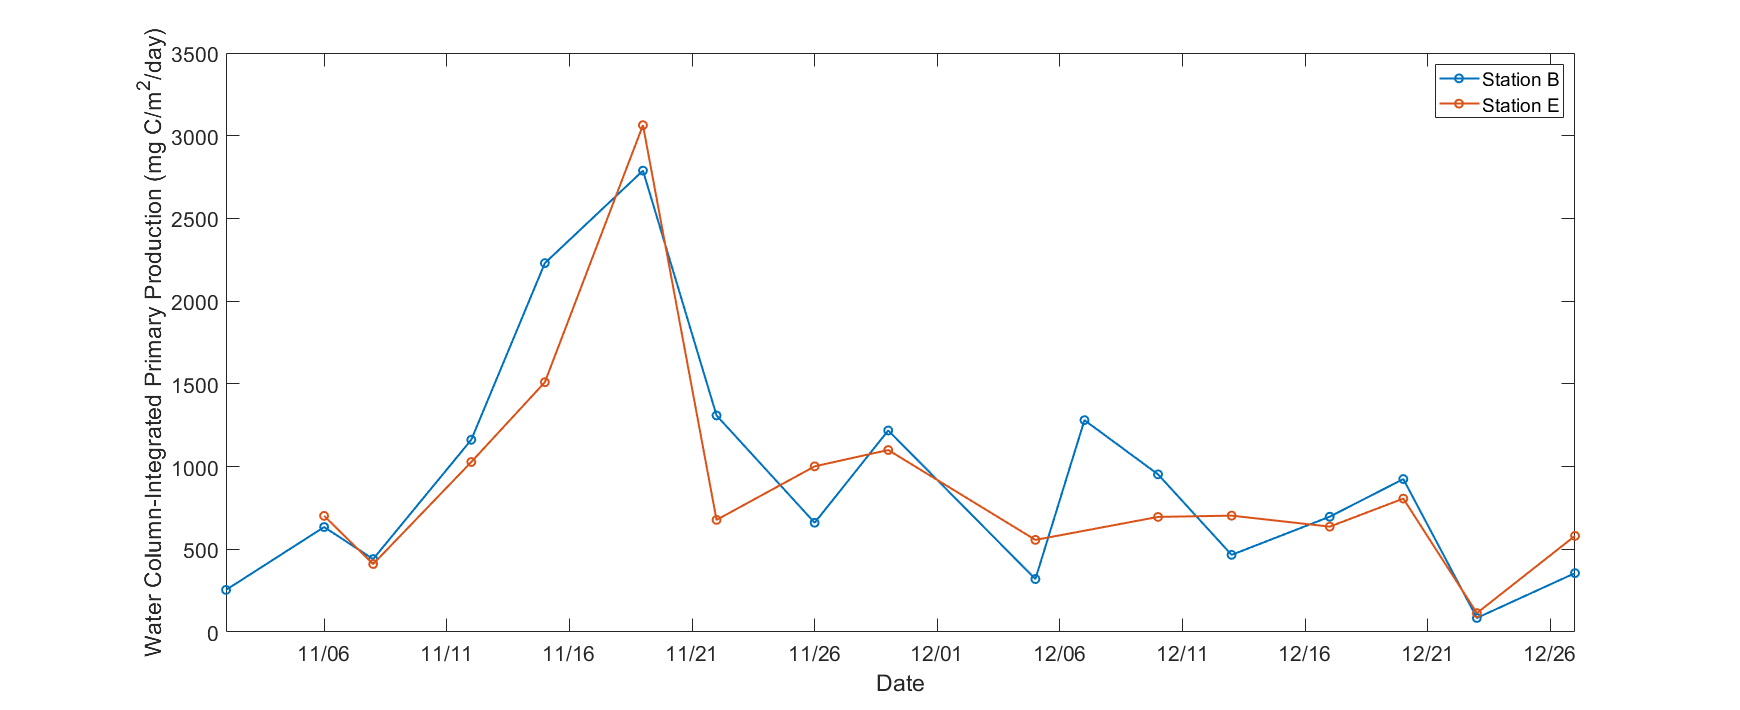
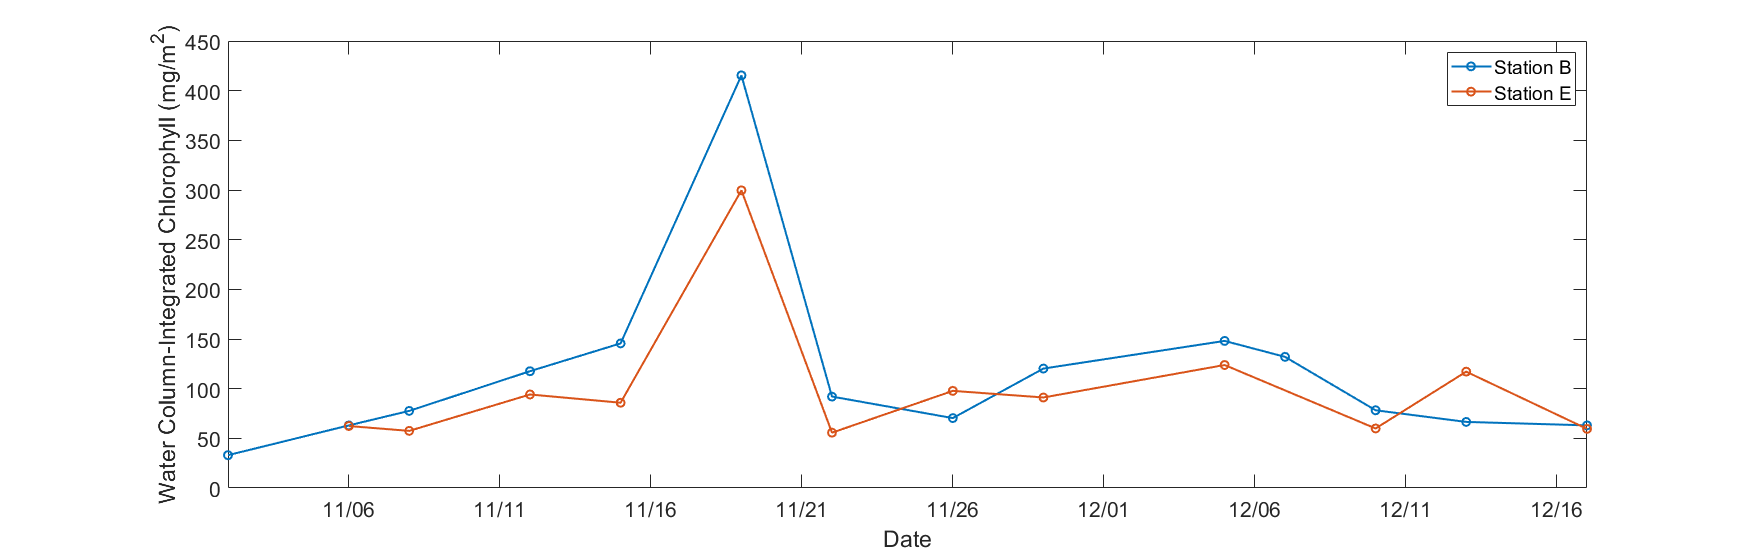
Our measurements of primary production (mg C/m2/day) and chlorophyll concentrations (mg/m2) dropped down after the spring bloom and have remained steady since. Fluorescence profiles also reflect the spring bloom (reaching nearly 10 mg/m3 at the chlorophyll maximum) and subsequent leveling-off to ~3 mg/m3 for both Stations B and E.
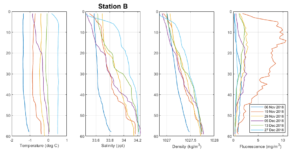
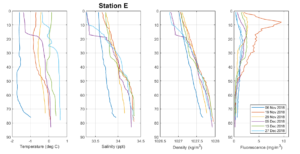
Temperature (˚C), salinity (ppt), density (kg m-3), and fluorescence (mg m-3) profiles against depth in meters (L-R) for six November and December 2018 sampling events at Station B (top row) and Station E (bottom row).
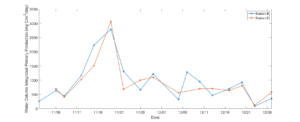
Depth-integrated primary production (mg C/m2/day) values from Station B (blue) and Station E (orange) for November and December 2018.
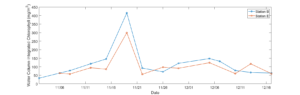
Depth-integrated chlorophyll (mg/m2) values from Station B (blue) and Station E (orange) for November and December 2018.
-
The science team for 2019
Posted on January 7th, 2019 No commentsRutgers Sends All Female Field Team to Antarctica for the 27th year of the Palmer LTER
The 27th Annual research cruise of the Palmer Long Term Ecological Research (LTER) (www.pal.lternet.edu) along the Western Antarctic Peninsula set sail on January 5, 2019 and will continue until February 7, 2019. The LTER annual cruise will be surveying the Western Antarctic Peninsula, studying the entire food web – from phytoplankton and bacteria to krill and other zooplankton to whales and penguins – working to understand the changing ecosystem and the influences climate change is having along the peninsula. The Palmer Station component of the LTER project, also in its 27th year, also adds a seasonal scale to the study, running from October 2018 to April 2019.
This season, the phytoplankton component of the Palmer LTER, headed by Dr. Oscar Schofield, has an all female field team! Led by Field Team Lead, Nicole Waite (RUCOOL Technician), team members include: Dr. Kim Thamatrakoln (DMCS Assistant Research Professor), Emily Slesinger (RUCOOL graduate student), Samantha Schofield (Rutgers undergraduate student), and Hailey Conrad (Rutgers undergraduate student). The Palmer Station field team is lead by Schuyler Nardelli (RUCOOL graduate student) who is also doing her dissertation research with the Palmer LTER and Marie Zahn (field technician). Not pictured, Anna Bashkirova (Rutgers undergraduate) was also a key member of the field team at Palmer Station from October to December 2018.
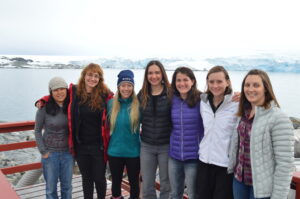
Picture Caption: From L-R: Kim Thamatrakoln, Samantha Schofield, Emily Slesinger, Marie Zahn, Schuyler Nardelli, Hailey Conrad, Nicole Waite. Not pictured: Anna Bashkirova
-
Glider is launched offshore Palmer Station
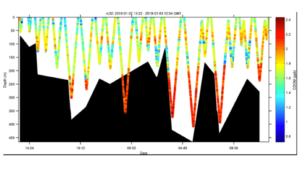
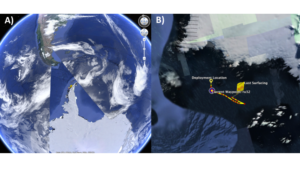
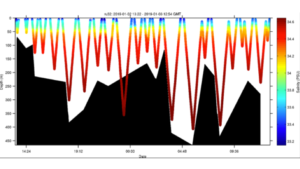
Posted on January 3rd, 2019 No commentsWeather cooperated and the LTER team was able to launch a glider this Wednesday offshore Palmer Station. Hopefully the ice will cooperate and we maintain a sustained presence for the rest of the summer season. The glider this year is outfitted with a SeaBird CTD, WetLabs fluorometer and optical backscatter sensor. The glider is also carrying a ASL Environmental Sciences multifrequency acoustic system to measure zooplankton and fish. The goal of this years mission is to measure the variability of phytoplankton, zooplankton, and fish distributions and their relationship to penguins and whales. Currently the glider is transecting back and forth along the head of the Palmer Deep canyon. Below is the glider location along the WAP (A) and the a zoom-in showing its movements near palmer station over the last 24 hours (B).
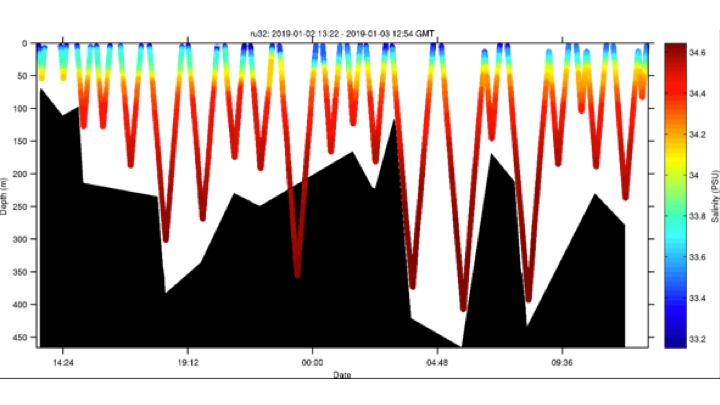
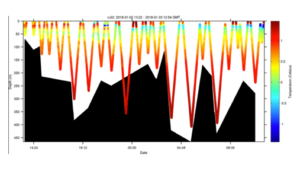
The figure below is the cross section of the water temperature. The black shapes is the “estimated sea floor” as measured by the onboard glider altimeter. The altimeter is obviously giving some false bottoms, as the glider is transecting deeper the altimeter derived sea floor. This has been seen before, and our working hypothesis is the altimeter is getting returns on large krill swarms not the seafloor. The AZFP will provide insight on this. Temperatures show a typical range for this location, with warm water at the surface (presumably reflecting radiant heating) and at depth reflecting remnant modified circumpolar deep water. A cooler layer at 30-50 meter water depth probably reflects residual cold surface water.
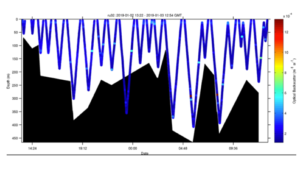
The salinity shows a fresher surface layer with a salinity at 33 to 33.2. This likely reflects sea ice and glacial melt.
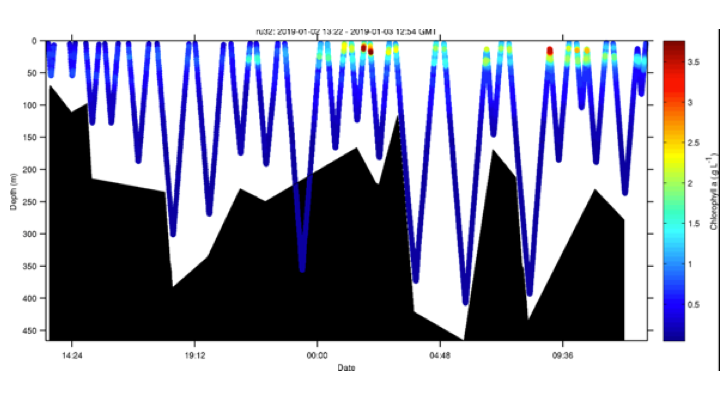
Chlorophyll fluorescence shows a surface bloom at the eastern portion of the transect indicating a moderately sized phytoplankton bloom.

Optical backscatter shows no strong correlation with the surface phytoplankton. However there does appear to be particles at depth which could be consistent with export flux events with the material potentially ranging from marine snow to animal poop.
Finally Colored Dissolved Organic Matter (CDOM) shows significant variability, however the deep modified circumpolar deep waters are distinct with a high fraction of fluorescent CDOM.