


-
Early Season in the Mid Atlantic
Posted on June 17th, 2021 No commentsOne purpose of this blog is to catalog our observations as the hurricane season progresses. In the Mid Atlantic, the challenge for years in the operational models has been to reproduce the strong 2 layer structure of the summer, the warm and fresh surface layer and the cold and salty bottom layer separated by a very strong thermocline/halocline.
For the glider operators in the Mid Atlantic, here is a quick look at the operational models from the NSF OOI Coastal Pioneer Array. The purpose is to highlight the complex structures near the shelf break that we see in the region around the Pioneer Array. First the temperature profiles. The highlight here is the remarkable agreement between the glider data in blue and the data assimilative RTOFS model in green. The background 2 layer structure is there with that main thermocline running between 20 m and 40 m – amazing agreement between green model and blue data. Below 40 m, we see the temperature warm up. This is a type of bottom intrusion of warm and salty water from offshore. Glider colleagues at VIMS have been studying these intrusions for years. Both the blue RTOFS model and the red GOFS model are seeing the intrusion, but the match between blue and green is again remarkable. Now look at the surface, a thin layer of cool water about 5 m deep. Definitely need to check the salinity on this.

Below is the salinity. The main halocline between 20 m and 40 m is again well represented by RTOFS. The warm water intrusion at the bottom is confirmed to be salty, the signature of warm salty slope water moving up onto the shelf. And the surface layer is indeed very fresh, so a cool and fresh layer has moved in along the surface. The source of this water needs to be determined. It is not in the models, so they might not help us. Likely first stop is the satellite imagery.

Bottom line message: RTOFS is doing a really good job of getting the main two layer system correct at the Pioneer array, as well as the bottom intrusion of warm salty water from offshore. RTOFS is doing this without the bias seen in GOFS. Both ROTFS and GOFS outperform Copernicus in this area as usual. None of the models are doing well with the cold, fresh surface layer, although GOFS does have some of this feature in the salinity profile. Further investigation needed to determine the transport pathways for the cold fresh surface water.
-
Disturbance in the Gulf
Posted on June 16th, 2021 No commentsThe disturbance in the southwestern Gulf of Mexico is forecast to start moving north tomorrow with a 70% chance of cyclone formation in the next 48 hours. Lets take a look at the oceanographic conditions in front of the storm.
First we have the SST maps from our two operational models, the NOAA RTOFS on the left and Navy GOFS on the right. The surface waters of the western Gulf are warmest, with a large area in the northwester Gulf above 29C. GOFS looks to be slightly warmer than RTOFS at the surface. The color-filled circles represent the locations of recently surfaced Argo float profiles.

Looking at the temperature at a depth of 200m, we see a large area of colder water below 15C in the northwestern Gulf. Highest surface temps, lowest temps at 200 m, means significant stratification in this region. At 200 m you can better see the mesoscale structures. Each model has the extended Loop Current, and that band of warm water stretching diagonally across the Gulf from northeast to southwest. The warm band exists in both models, but the mesoscale structure has differences.

Last map comparison is the surface salinity. Lots of fresh water from the Mississippi River in both models along the northern Gulf coast, extending way offshore in the northwester Gulf, again increasing the stratification.

Now a quick look at the Argo floats. We’ll publish the orange float #4902916, the most western one on the map. Here we zoom into the upper 400 m, the region where we often see the largest differences between the model profiles. The float data is in blue, RTOFS green, and GOFS orange. Temperature profiles are in good agreement between models and data, with GOFS slightly warmer at the surface and closer to the float observation. GOFS tends to follow the Argo profile quite closely. RTOFS tends to be a bit warmer below the surface mixed layer and a bit colder at 150 m. Salinity is similar with GOFS tending to follow the profile more closely, and RTOFS a bit fresher at depth and a bit saltier near the surface. Neither model is getting the very low salinity observed in the freshwater surface barrier layer.

So what dis we learn about oceanographic conditions in the Western Gulf where the current disturbance may be headed? The north western Gulf surface waters are the warmest in the Gulf, above 29C, and the western Gulf is highly stratified with cold water at depth and low salinity water at the surface. The stratification acts to inhibit mixing and cooling of the surface water. If the winds are sufficient to overcome the stratification, there is a large source of cooler water less than 40 m below the surface that could help rapidly cool the surface water. We have the possibility of two gliders, a Navy glider and a TAMU glider to be in place to capture the response if this develops.
-
Hurricane Gliders 2021
Posted on May 3rd, 2021 No commentsToday marks the start of our 10th year of dedicated storm glider flights, and the 4th year of the international North Atlantic hurricane glider picket lines. Just like the hurricanes in nature, we are spinning up the hurricane glider deployments and the hurricane blog before the official start of hurricane season. Our objective, to help keep the ocean components of the forecast models on track well ahead of any hurricane, requires us to mover to earlier and earlier underwater glider deployments.
The hurricane blog is about the ocean, how the ocean is impacted by the intense hurricane forcing, and how the ocean feeds back on hurricane intensity. We care about the full continuous spectrum of intensity change, including the “human-defined” rapid intensification, and also rapid weakening. Over the last few years of the hurricane glider picket line, we have defined the Essential Ocean Features that impact North Atlantic hurricane intensity, and have noted that they are regionally dependent. Our 4 hurricane regions, based on the Essential Ocean Features they contain, are the Caribbean, the Gulf of Mexico, the South Atlantic Bight, and the Mid Atlantic Bight. These regions roughly correspond to the U.S. IOOS Regional Association locations, with the simple caveat that nature is not constrained by national boundaries, and we must include the other national and international waters adjacent to our IOOS Regions in our hurricane analyses.
The 2021 hurricane blog will focus on a comparison of two operational global ocean models [NOAA’s Real Time Ocean Forecast System (RTOFS) and the Navy’s Global Ocean Forecast System (GOFS)] and three regional coupled atmosphere ocean forecast models (HWRF, HMON and HAFS). We also focus on the use of profile data from underwater gliders and Argo floats, and the evaluation of the ocean component of these models with the profile data. This serves as another set of eyes looking at the ocean models that are already undergoing their regular evaluation processes as part of these national efforts.
This blog is also intended to support student research. This is where we leave that trail of bread crumbs that document the research issues we discover as we move through the hurricane season, making it easier to retrace events during the end of season look-backs, and hopefully providing students opportunities to jump right into research studies that will have an impact.
This year we are starting the season early. The first hurricane glider was deployed in the Mid Atlantic on May 3. We’ll start seeing its data making it through the system in about a day. We’ll start by looking at the general conditions for the Mid Atlantic before today’s glider is assimilated.
-
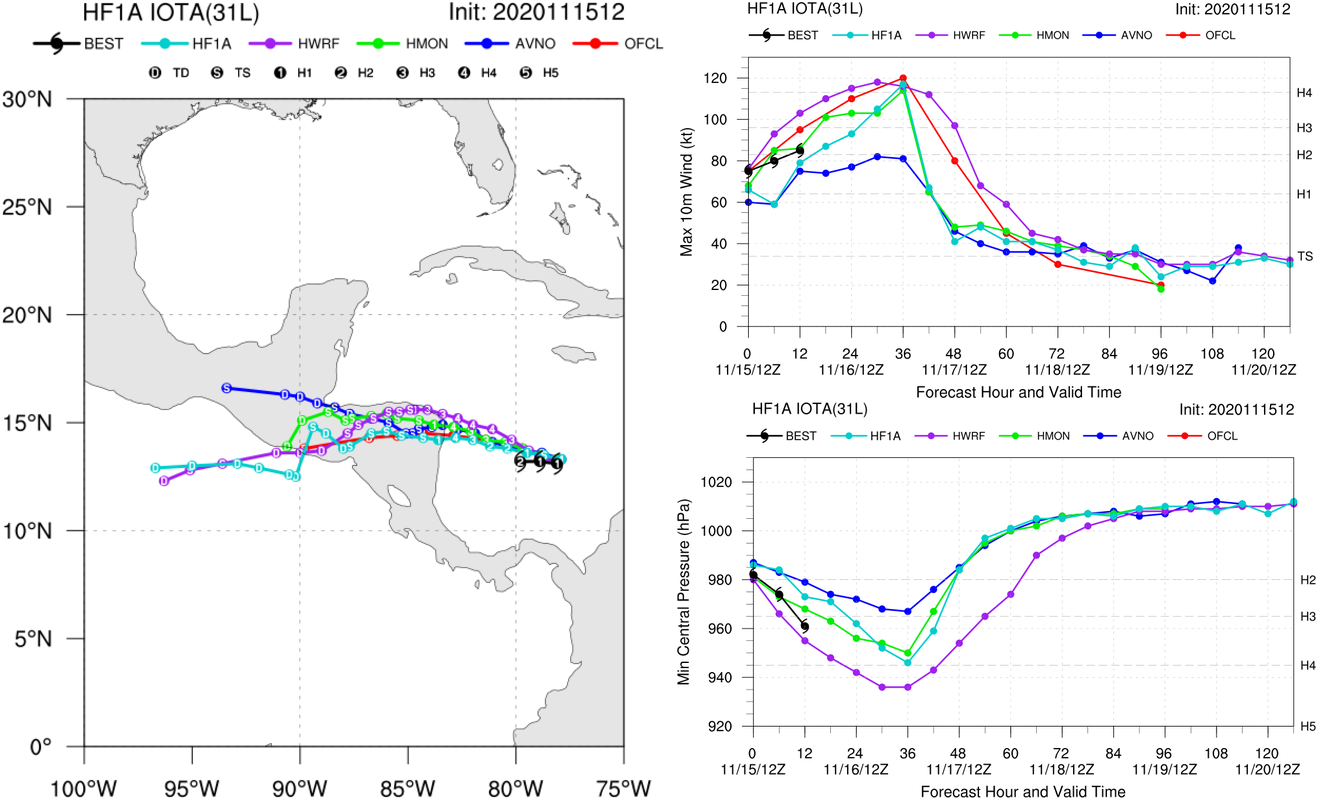
Hurricane Iota
Posted on November 16th, 2020 No commentsJust a quick placeholder post as we approach the winter analysis phase. Yesterday’s forecast for Iota intensification looks to be happening today. Looks like the hurricane forecasters are making good use of the HWRF guidance. Their discussion was about high sea surface temperatures, low wind shear, and high moisture contents.
-
Hurricane Eta – Low Wind Shear, High SST
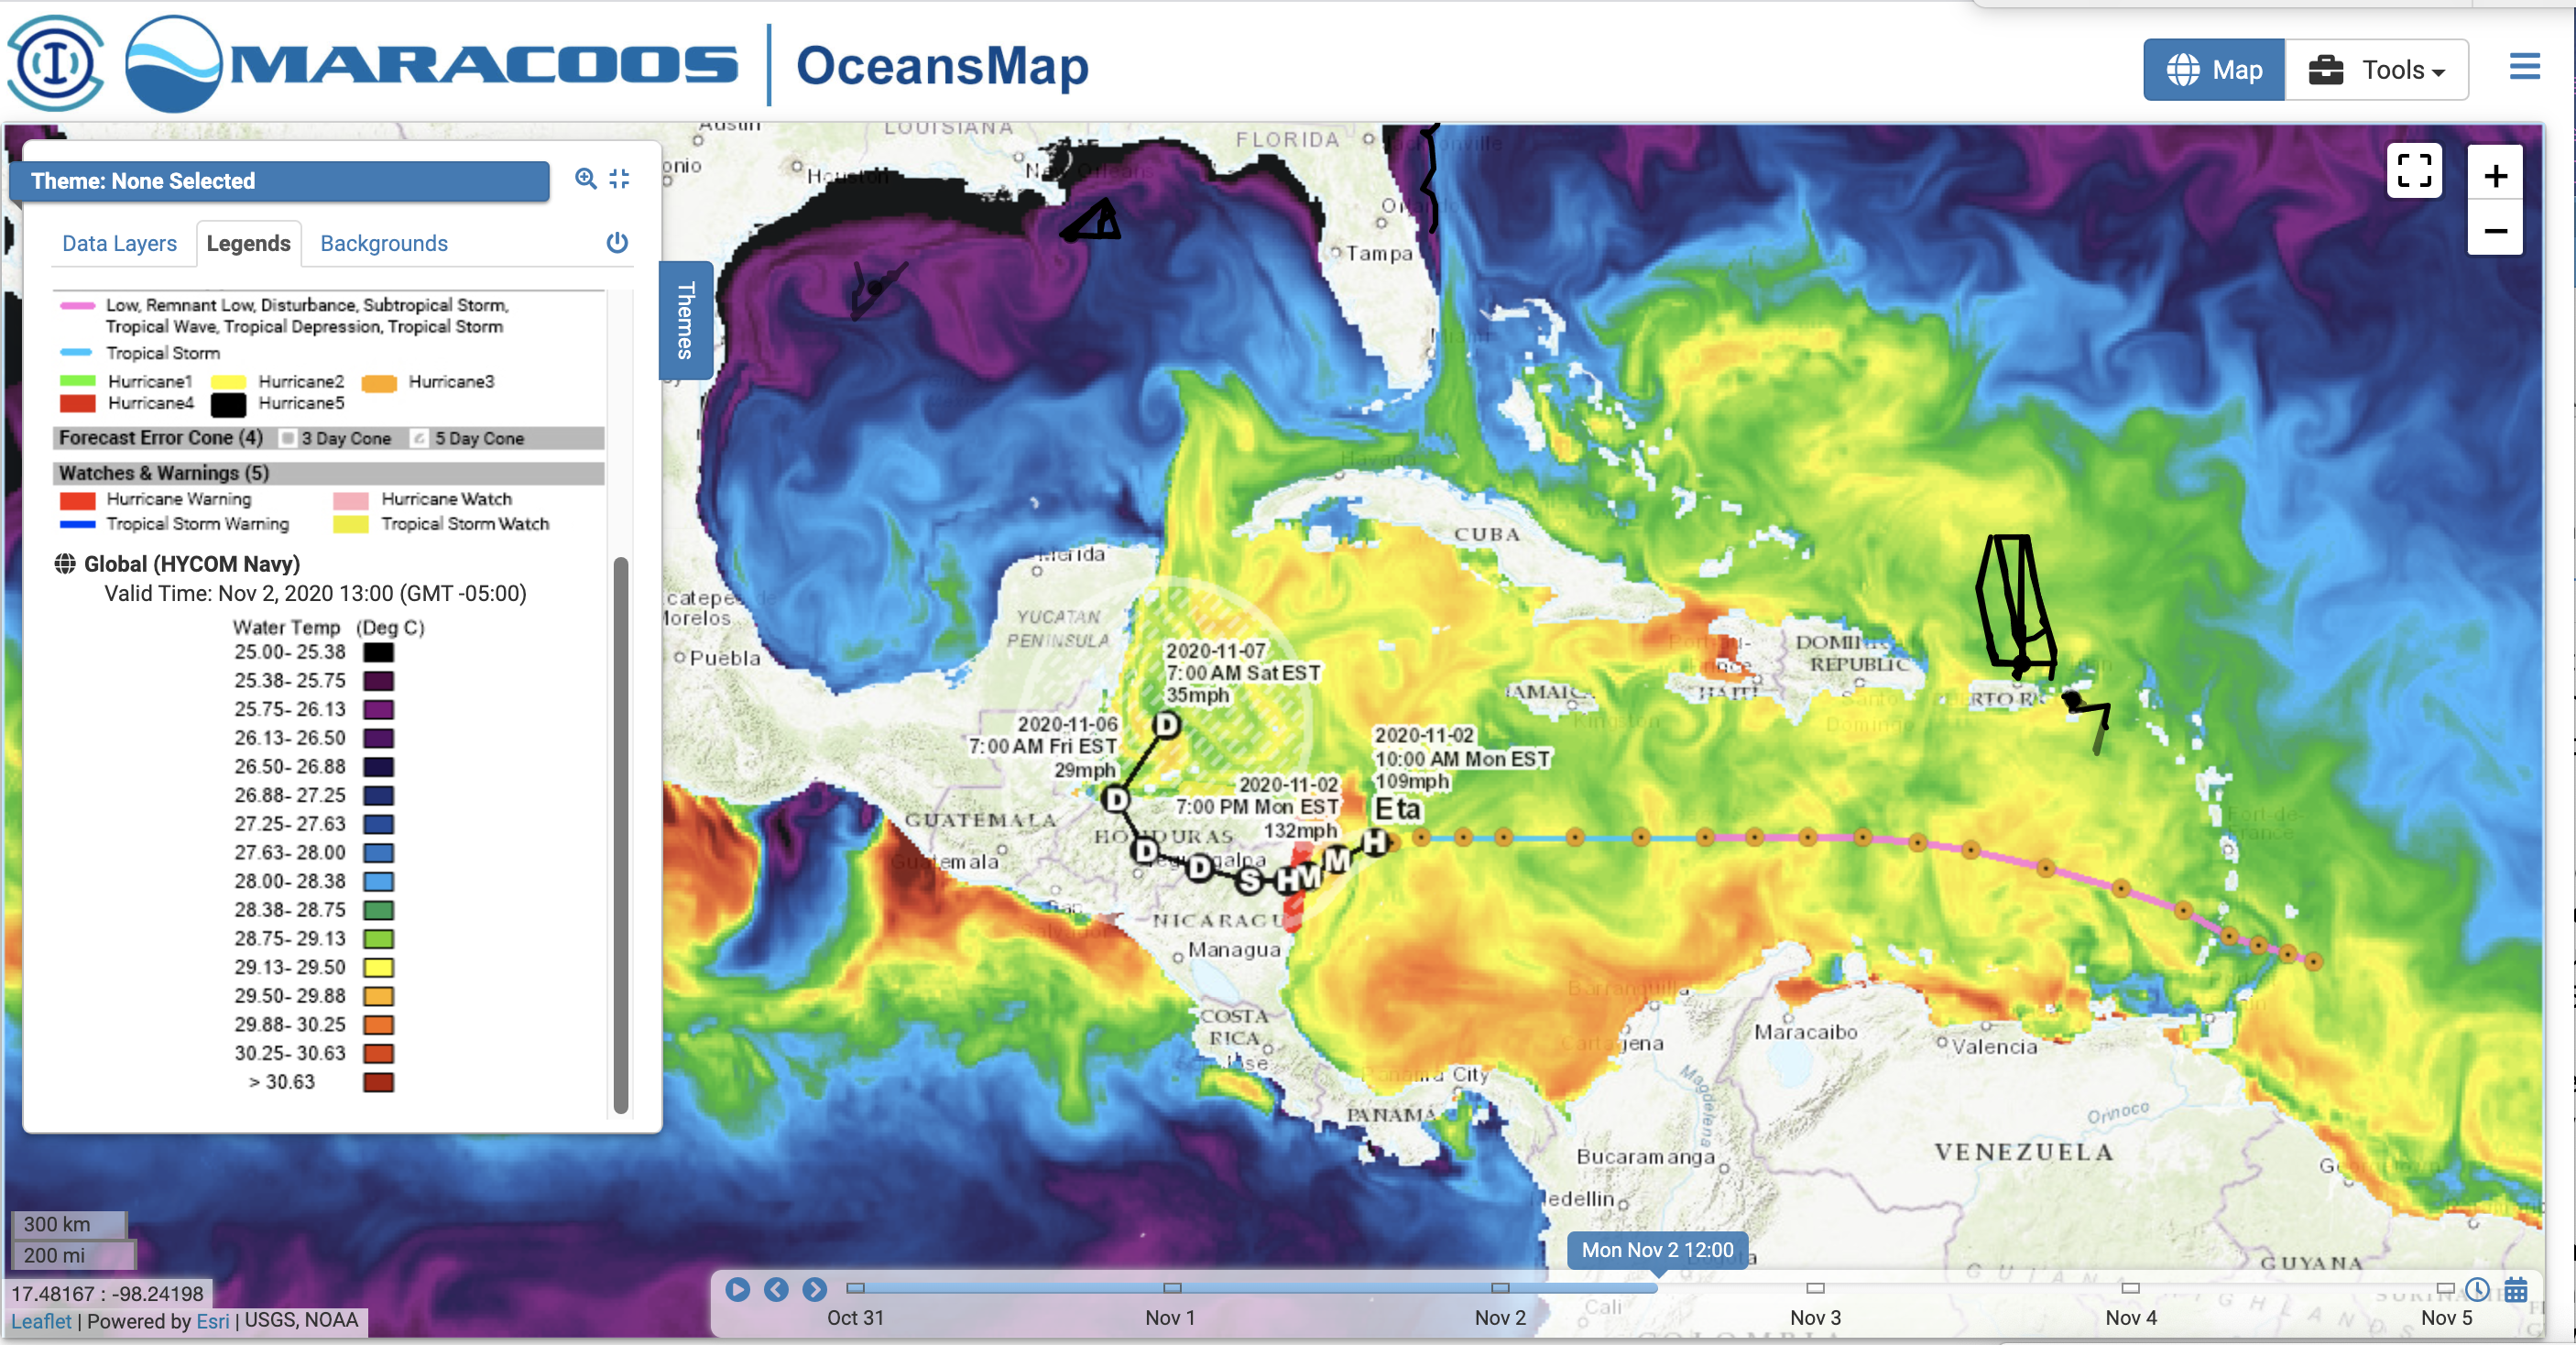
Posted on November 2nd, 2020 No commentsToday’s 10 am Discussion on the National Hurricane Center reflects a common theme:
"Low vertical wind shear and warm sea surface temperatures ahead of Eta are expected to
allow for continued rapid strengthening during the next 12 to 24 hours."
We see the forecasters are keying in on the relative impacts of vertical wind shear and sea surface temperature to help them turn the intensity guidance they get from decision aids into their intensity forecasts. Current shear and SST conditions are prompting the call for a Cat 4 hurricane:
"The updated NHC intensity forecast is above all of the
intensity aids and now calls for Eta to become a category 4
hurricane before it nears the coast of Nicaragua."
Step 2, lets look at those conditions in OceansMap. We see a rich mesoscale across the central Caribbean as Eta tracks from the Windward Islands to Nicaragua. Even the green colors in this image are above 28.75C.
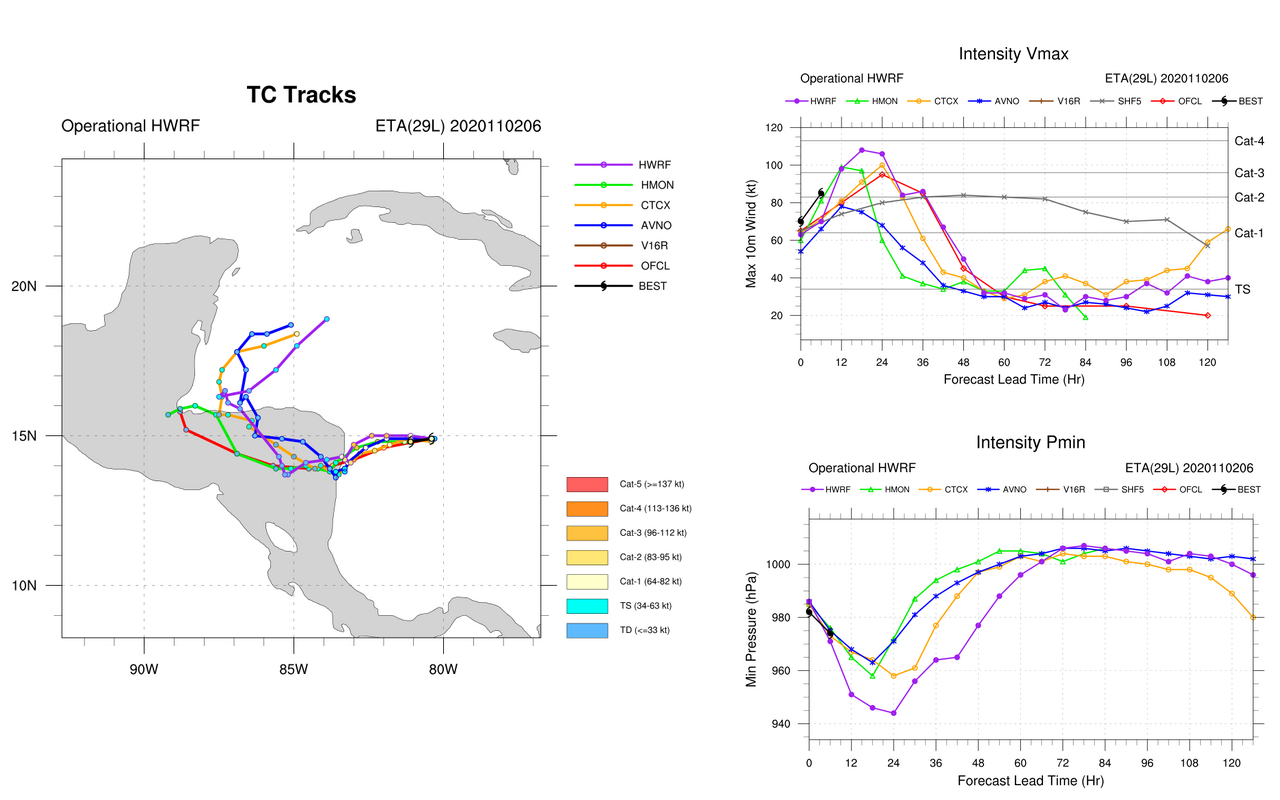
Step 3, check out the regional hurricane model forecast guidance:
Here is the most recent posting on the website for HWRF and HMON (intensity on upper right), with HMON a low Cat 3 and HWRF a high Cat 3. The short black line indicates that the best track is following the growth curves for HMON and HWRF. Official forecast in this forecast interval is taking Eta up to the edge of Cat 3.
-
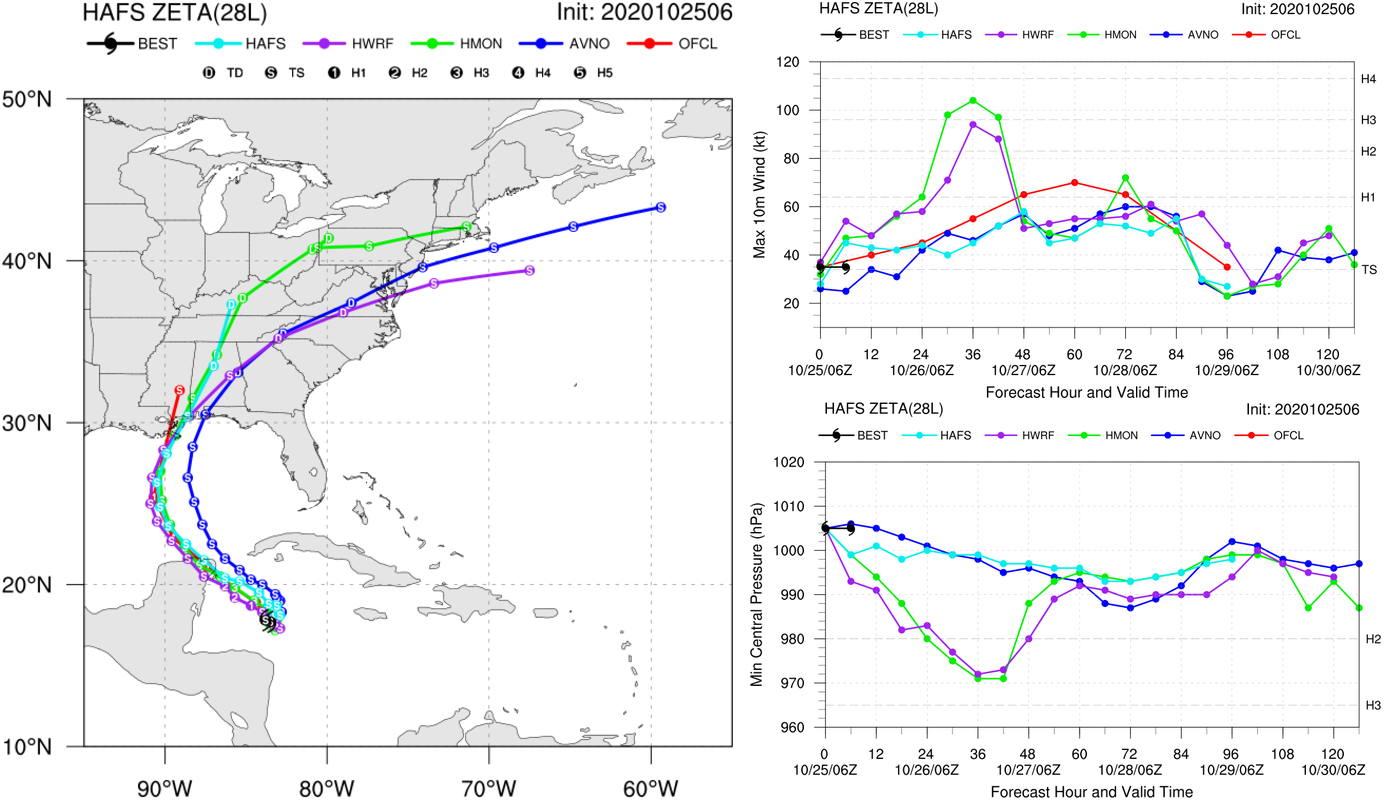
Tropical Storm Zeta
Posted on October 25th, 2020 No commentsThe 11 am National Hurricane Center discussion notes the importance of the ocean impacts on Zeta’s intensity in three locations.
- In the current location, the low shear and high ocean heat content in the western Caribbean favor intensification.
- As Zeta crosses the central Gulf, increasing shear and diminishing ocean heat content is expected to prevent intensification.
- As Zeta approaches the northern Gulf, the unfavorable ocean and atmospheric conditions could cause zeta to weaken beyond what is in the official forecast.
Below is the present regional guidance (HWRF in purple, HMON in green), and what we anticipate will evolve into future guidance, the experimental HAFS model (light blue). The tracks (left image) from these three models have converged since last night, and that makes them easier to compare. Zeta should be going over similar oceans in these models, something to check. On the top right is the intensity plot. The official intensity forecast (red) is above the model consensus. HAFS looks to be below the official forecast, keeping Zeta below hurricane strength as it approaches Yucatan. The operational models are showing the Zeta intensifying as it approaches Yucatan, with HMON going to Cat 3 and HWRF going to a high Cat 2. These models appear to be the ones that include the impact of the high ocean heat content in the western Gulf that the forecasters are saying favor intensification.
-
Tropical Depression Twenty-Eight
Posted on October 24th, 2020 No commentsThe 5 pm NHC forecast discussion reminds us that as this storm approaches the northern Gulf, the cooler shelf waters and the increasing wind shear will likely weaken this storm.
Lets take a look at those cooler temperatures by checking the Navy’s GOFS model SST. Here we see the official forecast track heading through the Yucatan Straits, with the cooler water way up on the shallow shelf of the northern Gulf. The green colors are still up around 27C, so the darker blues below 26c are really up by the coast.
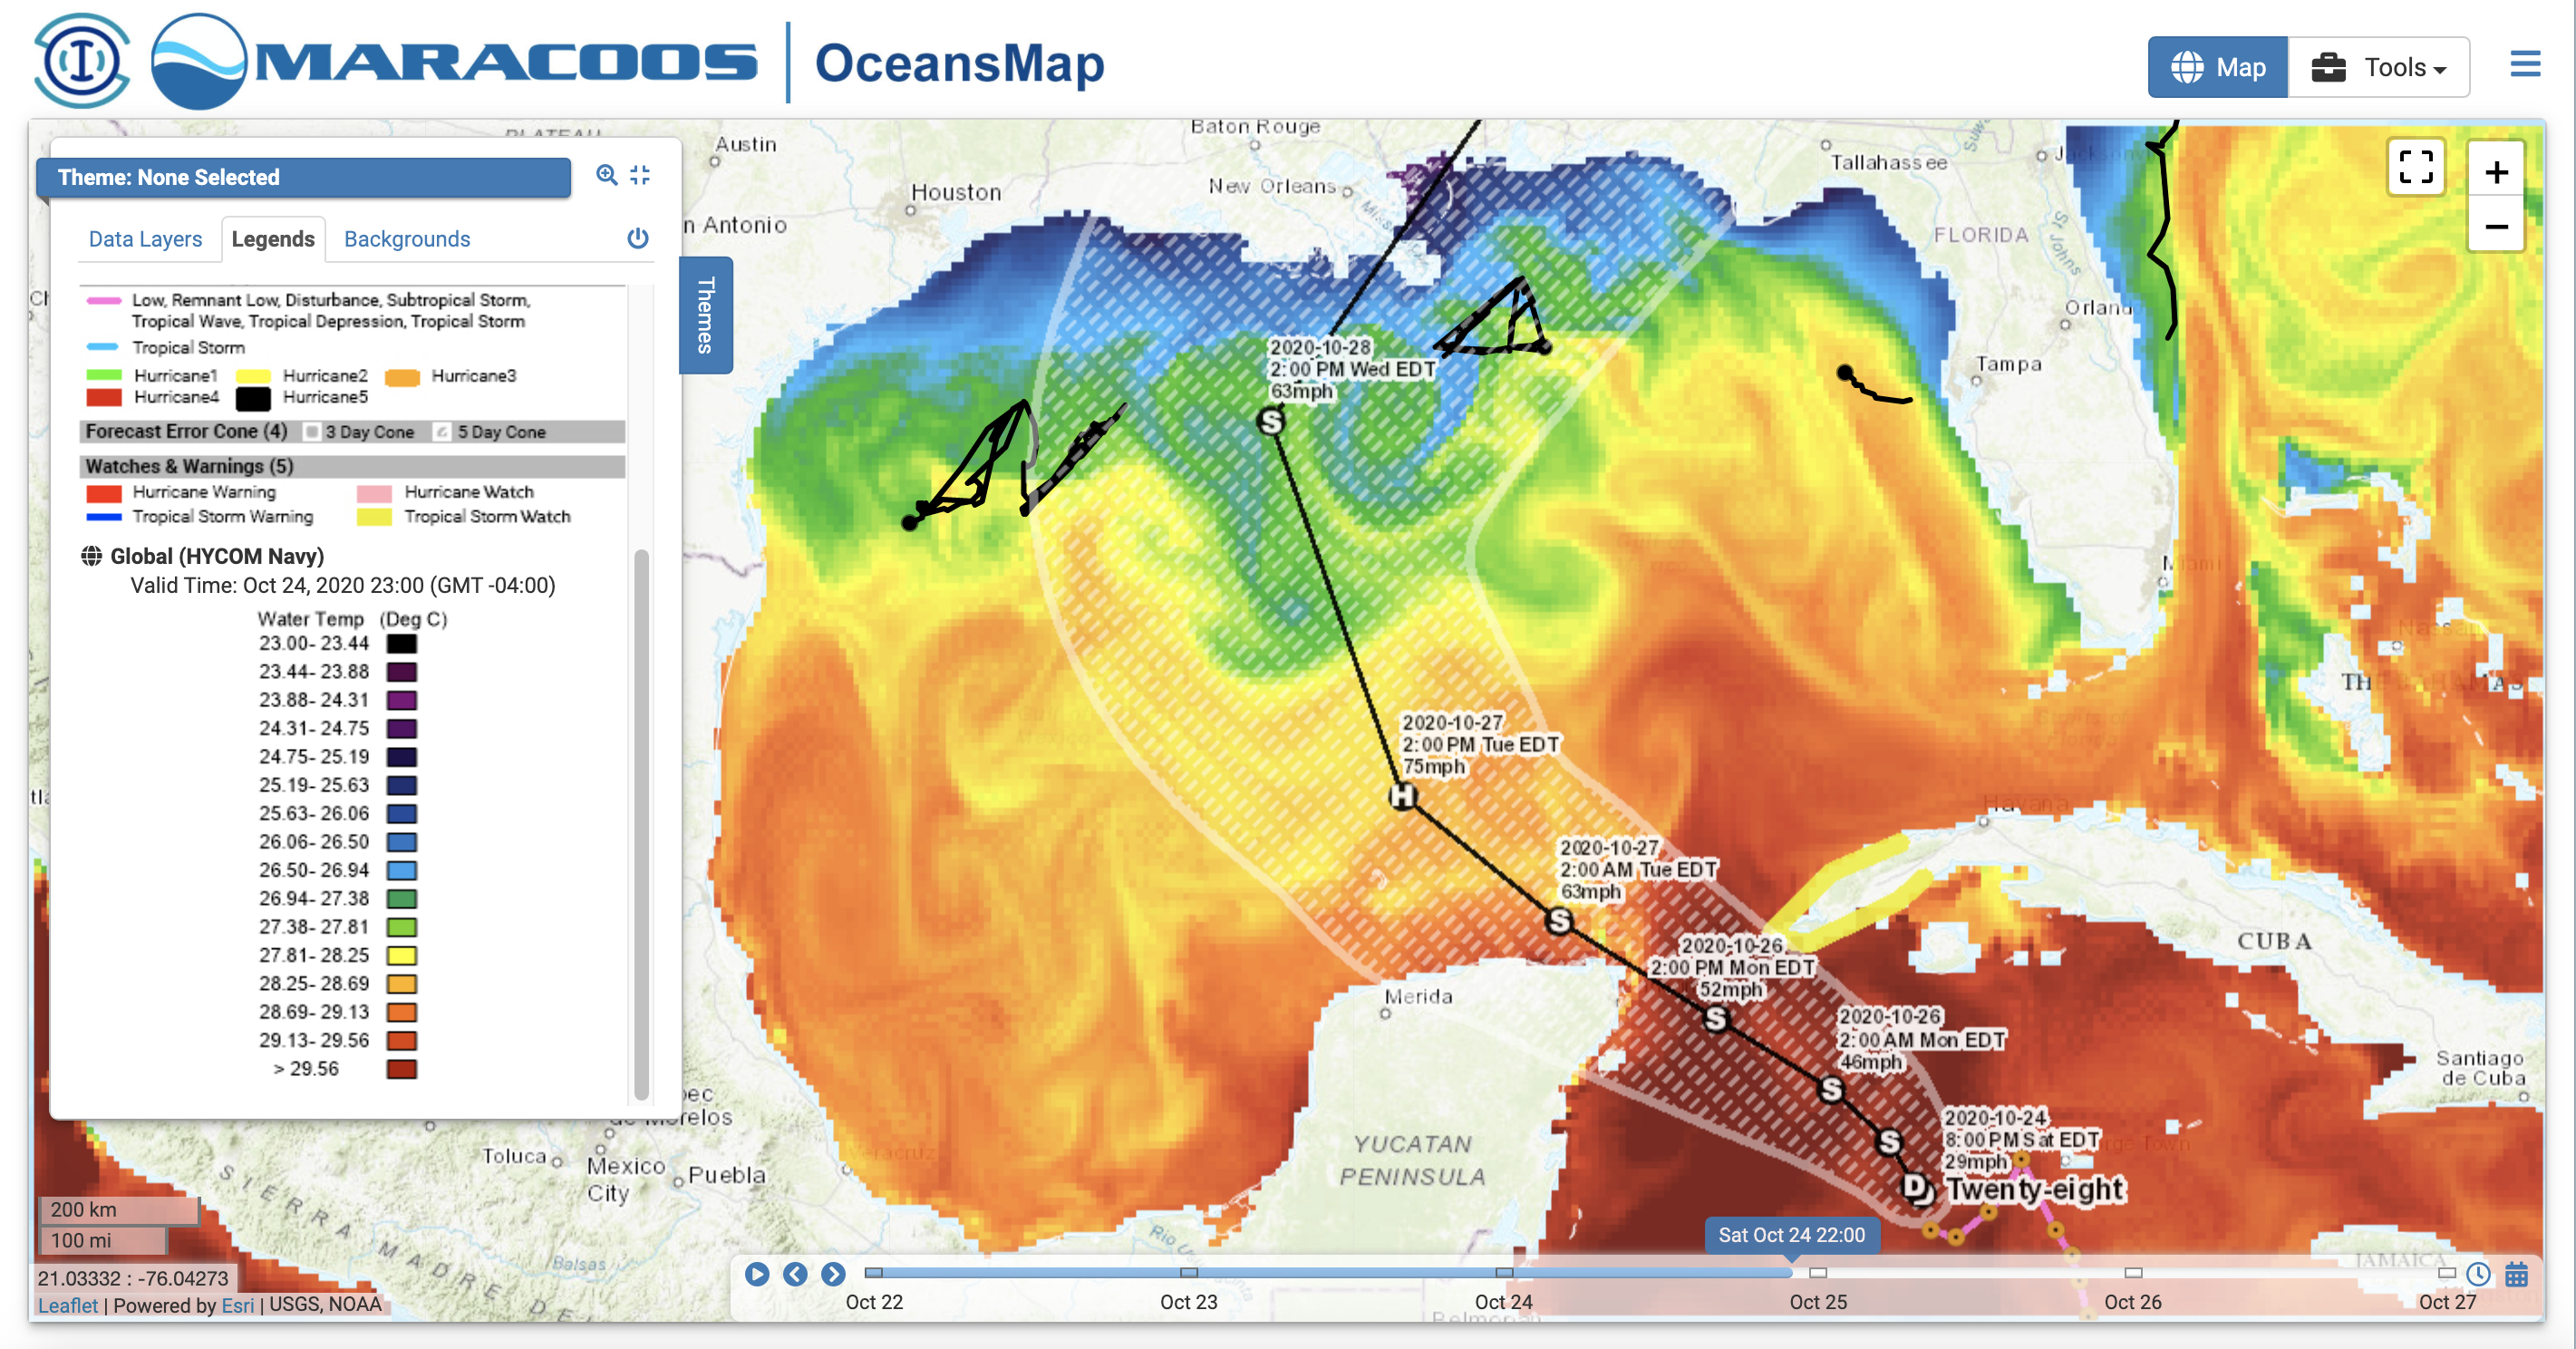
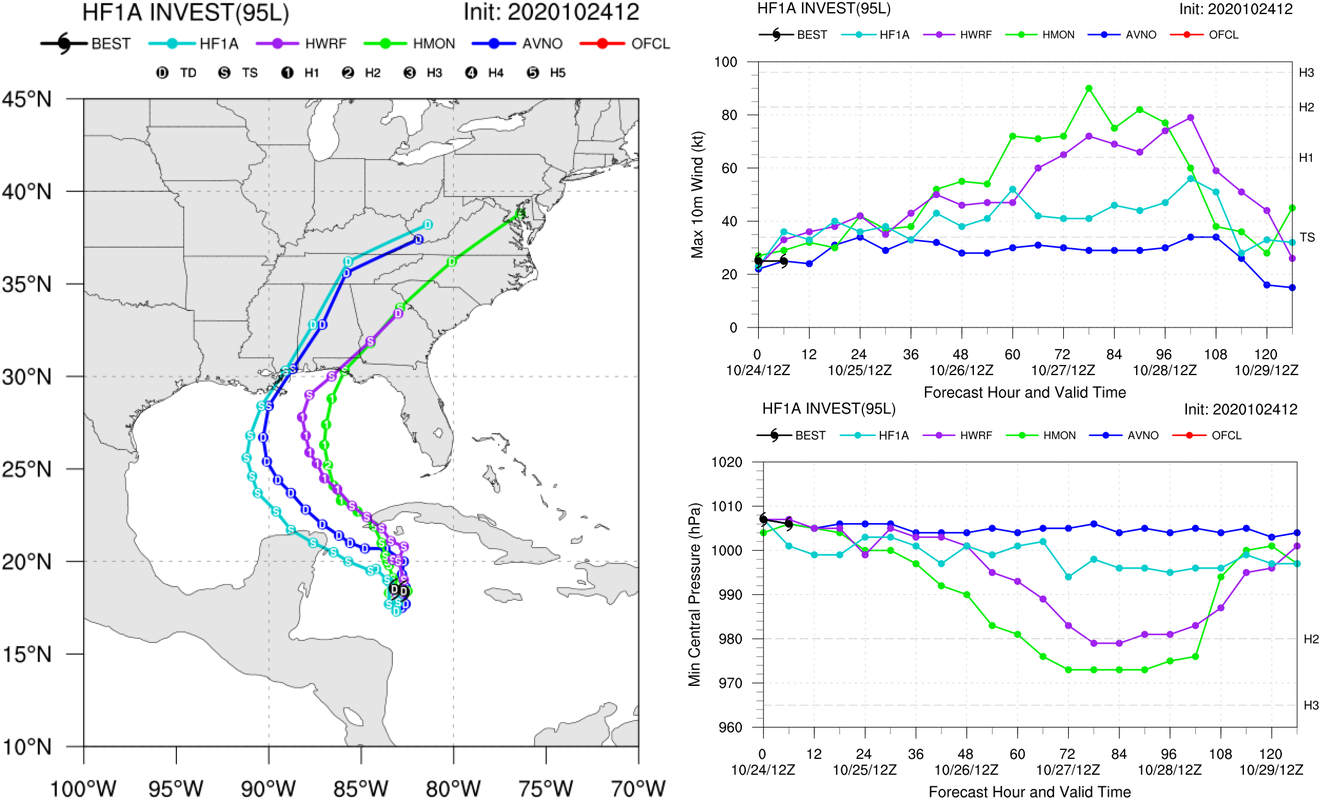
Now lets look at what the forecast guidance is telling us. HWRF and HMON, the two operational regional models, are hugging the right side of the cone, hitting western Cuba and tracking closer to the very warm (near 29C) waters of the Loop Current. Both of these models go to hurricane strength, with HMON hitting Cat 2 for a short period while the tracks are still very close (science question for the winter). If these tracks hold the storm will pass over NDBC’s glider SG601. The experimental HAFS model hugs the left side of the cone, tracking over Yucatan, and the cooler Mid-Gulf waters, remaining below hurricane strength throughout.
-
Five Gliders in a Picket Line
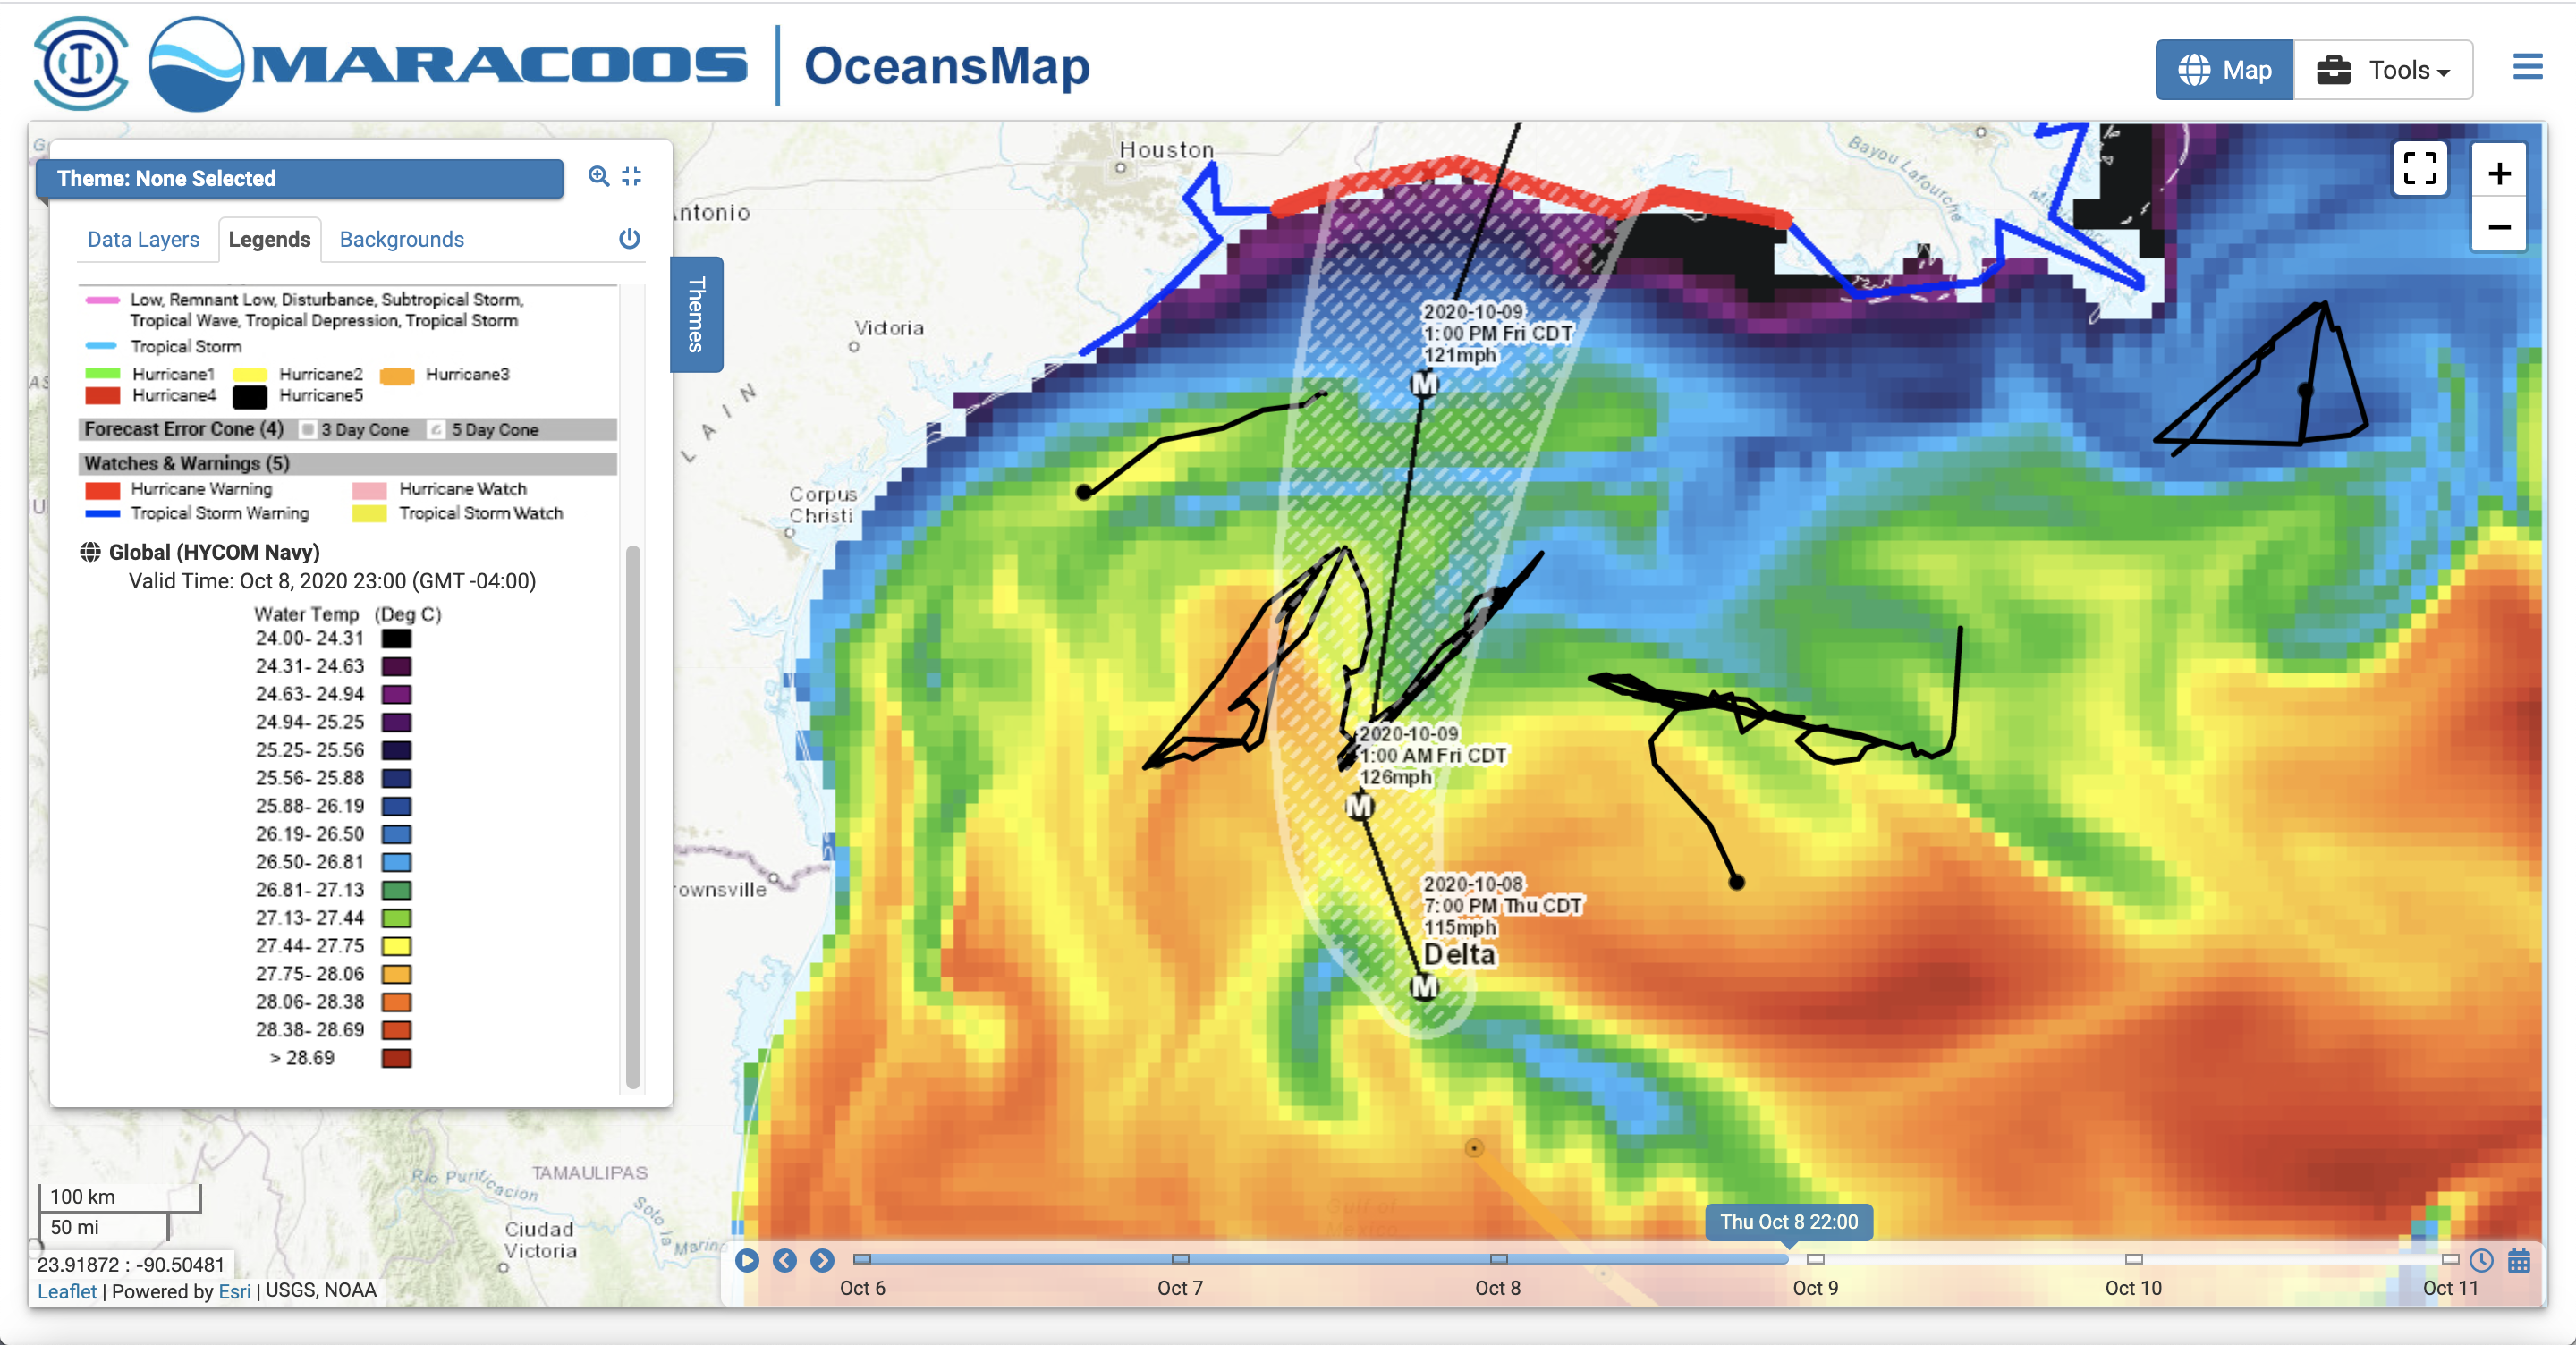
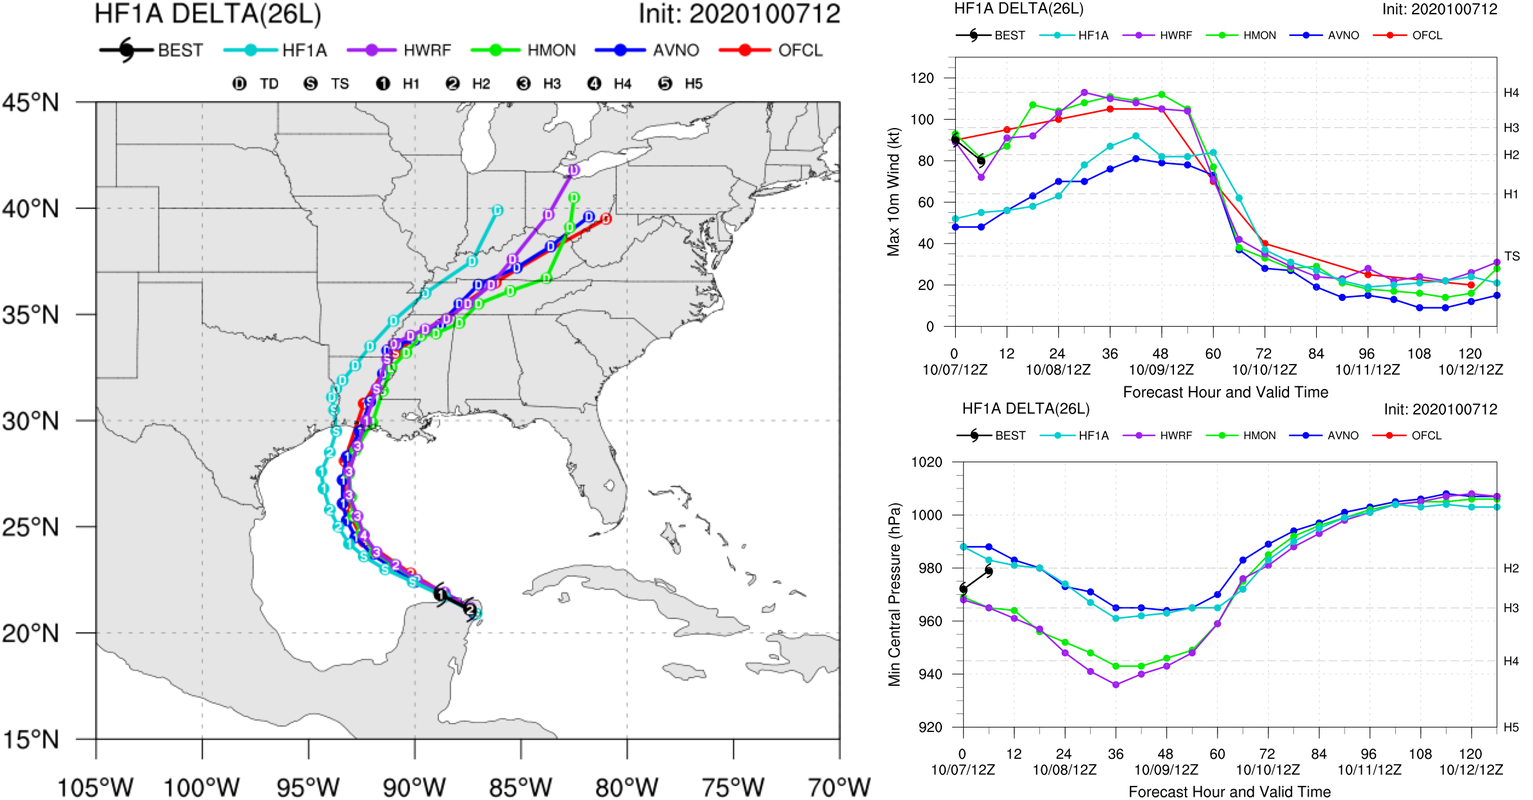
Posted on October 8th, 2020 No commentsFirst a quick view of the northern Gulf the night before landfall of what looks to be a major hurricane. The image below shows the Sea Surface Temperature forecast for the Navy’s data assimilative Global Ocean Forecast System, a consistently high performing ocean model, definitely a good choice for the start of our U.S. hurricane forecast workflow. It nicely demonstrates the value of the hurricane glider picket line concept. These gliders have been deployed for weeks, feeding their data into the GOFS model everyday to do everything we can to put the best representation of the ocean we can underneath our best hurricane models. We have two Texas A&M Gliders on the west, two Navy gliders in the middle, one NOAA glider piloted by USM on the east. Multiple government, university and industry groups working together for the common purpose of generated the best forecasts possible. We call it “Distributed Autonomy”. With sampling distributed in space and time. With operations distributed between multiple shore labs. And sponsorhips distributed between different agencies. What we see below, the pre-storm conditions established by the GOFS model, is one reason why we deploy the Hurricane Glider Picket Line each year – to improve the hurricane models that we are using today to forecast this very storm.
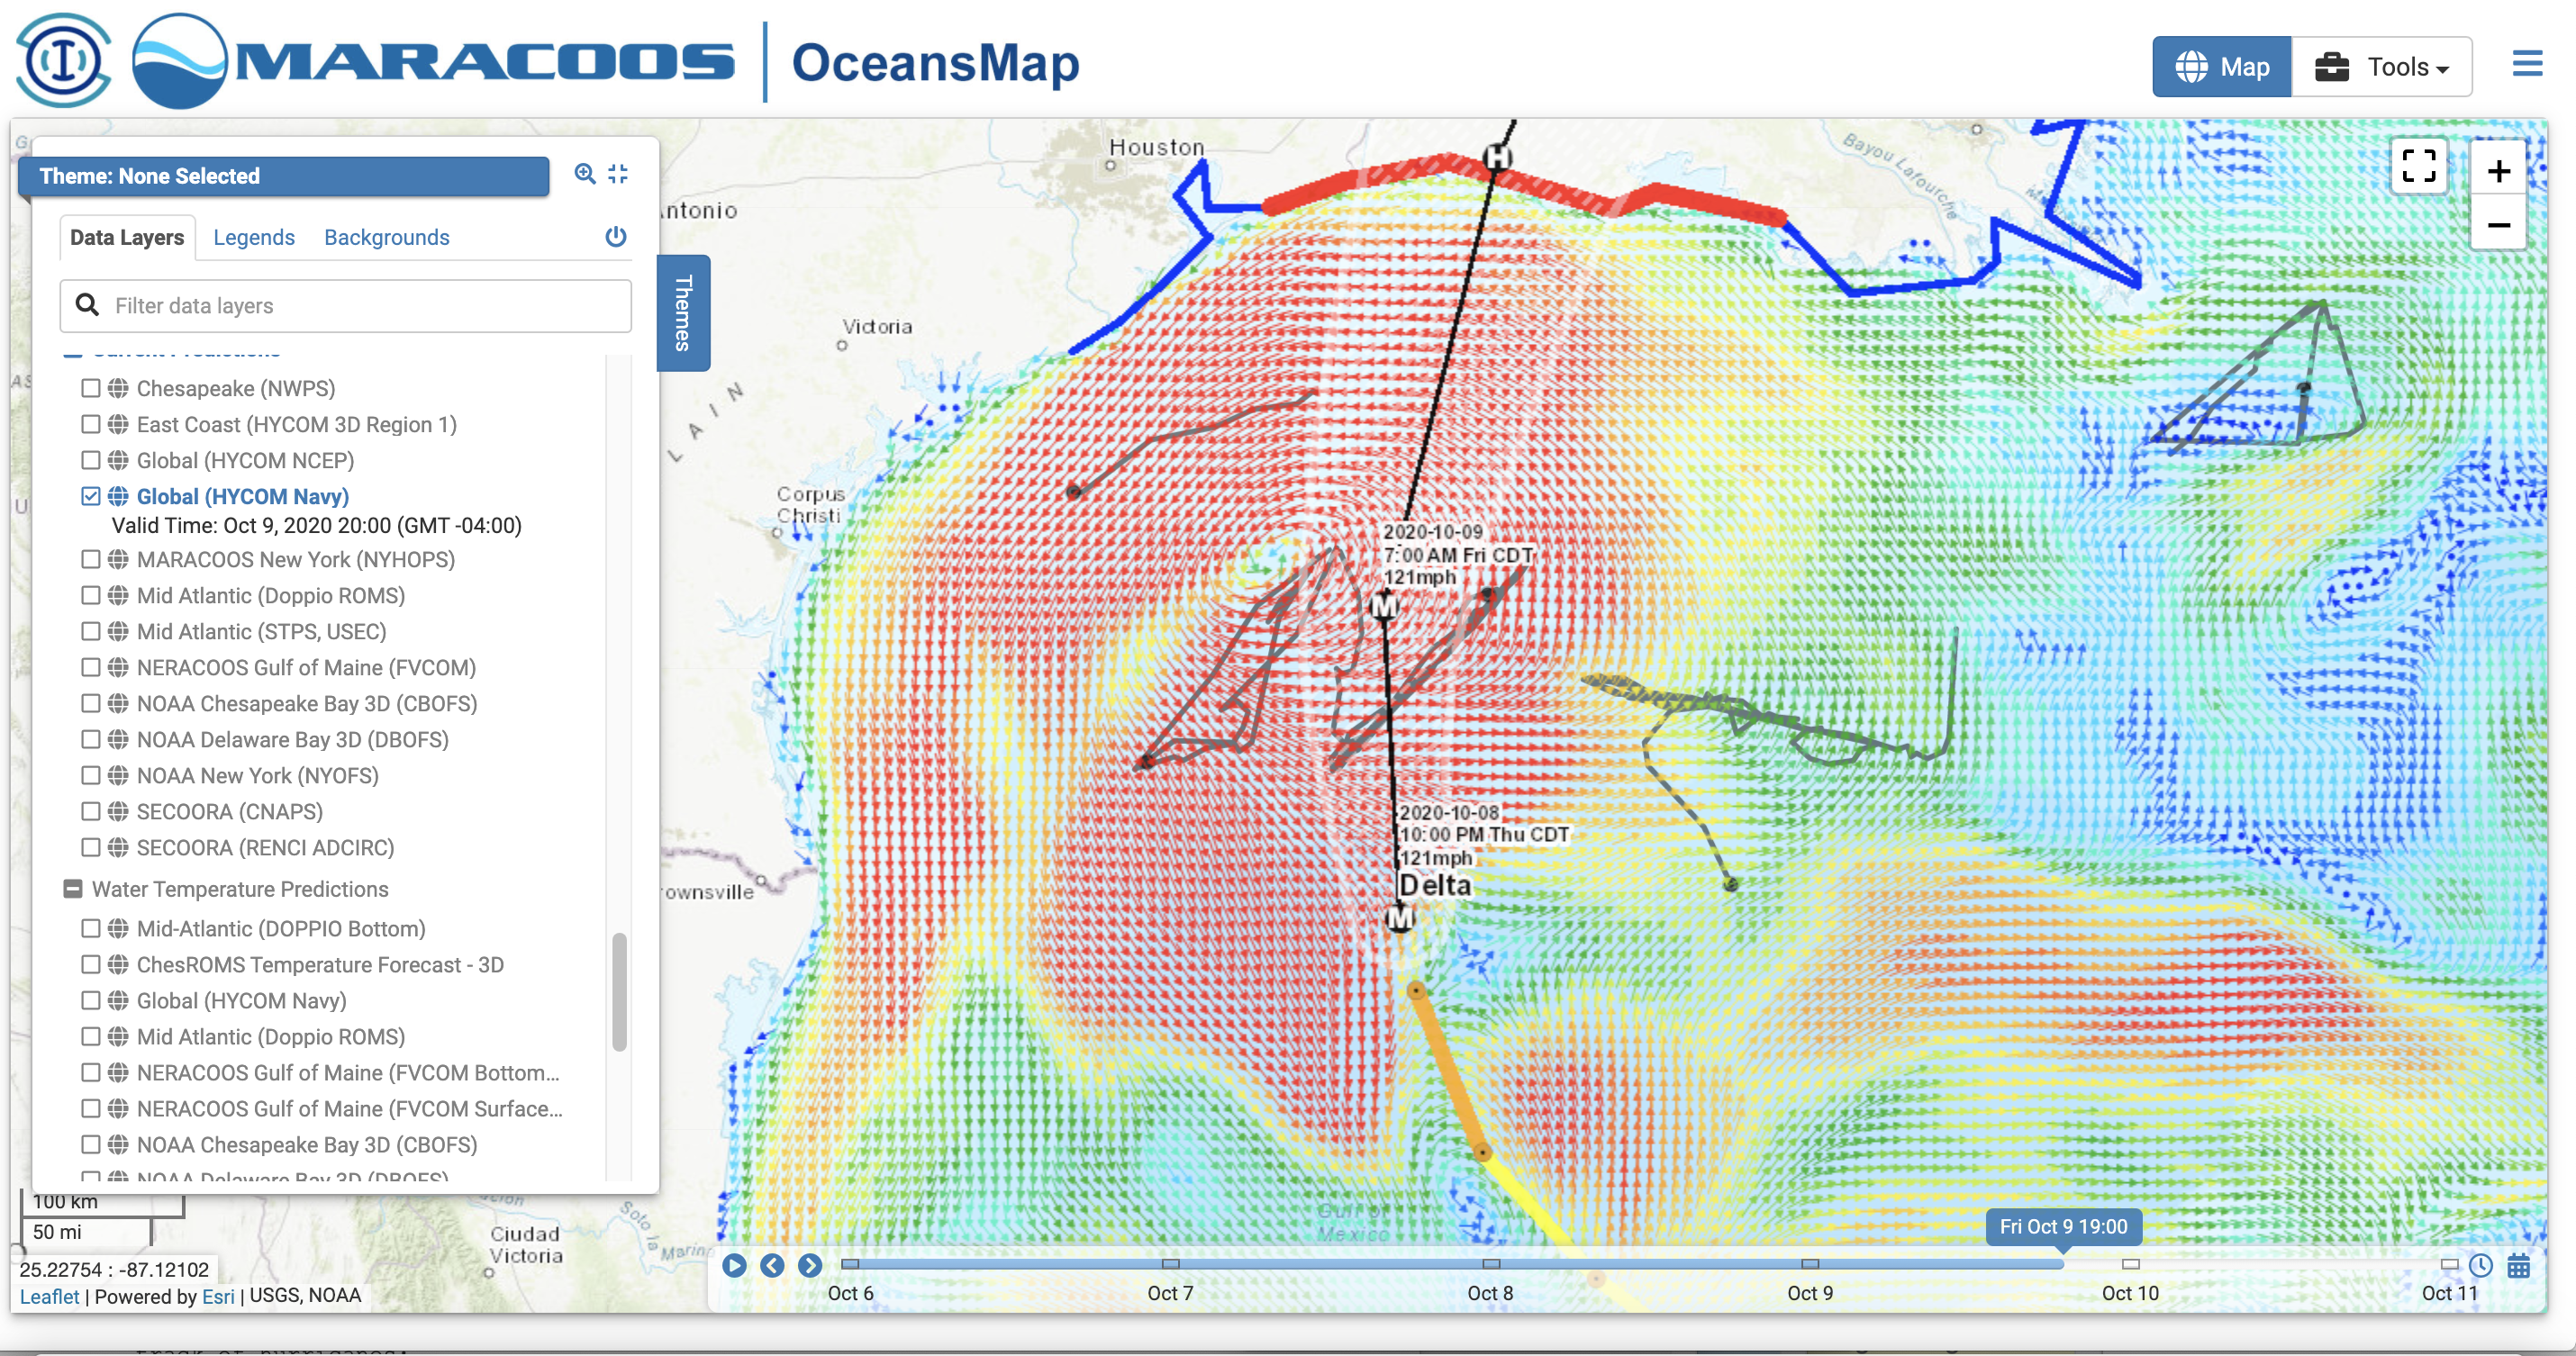
The second reason we deploy the glider picket line each year is shown below. It shows tomorrow’s GOFS forecast of the ocean currents, with the eye of Delta clearly visible a bit to the west of the official forecast, and the ocean current response to the downwelling-favorable winds (remember that blog entry from earlier in the week on upwelling versus downwelling?) along the LA-TX shelf, and we see the size of the storm. Four of the gliders will be directly in the thick of it, gathering the science data that will help us improve the hurricane models of the future. All that data to improve those future models is going to be gathered in the next 24 hours. By robots. No people have to go to sea. We are not overburdening the hurricane hunters and their flight crews. But we are there.
Stay safe Louisiana.
-
When Guidance and Forecasts Align
Posted on October 8th, 2020 No commentsAnother morning with remarkable agreement between the two operational regional models (HWRF and HMON) and the official NHC forecasts (red). Both models are skimming the bottom of the Cat 4 wind speed, and the official forecast is putting it in the middle of Cat 3. Not sure why the experimental HAFS model does not have the right initial condition. Something to check over the winter.
-
Hurricane Delta and the Barrier Layers
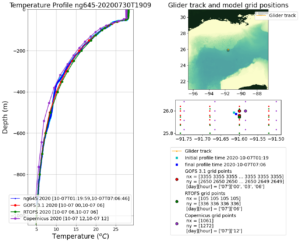
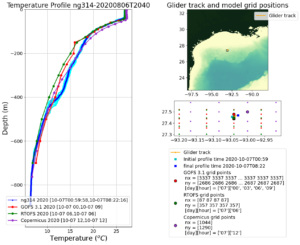
Posted on October 7th, 2020 No commentsWith multiple gliders in place, lets take a look at how the global models are doing with the data. We’ll focus on the two Navy gliders on the right hand side of the forecast track. NG645 is more south, almost central Gulf, and ng314 is further north, still in deepwater, but closer to any freshwater sources.
First the two temperature profiles. First is glider 645, near perfect agreement between the glider profiles in blue and the global ocean models – GOFS, RTOFS and Copernicus. For glider 314, we see a small difference between the temperature profiles in the 200m – 400m depth range. The data and the European Copernicus keep the warmer water deeper than the two US models. The upper ocean in all three look the same.
Now we check the salinity for the barrier layers. The southern glider 645 has lower surface salinity than at depth, but not a strong barrier layer like the European Copernicus. Both US models are close to the glider data at ng645. But look what happens to the salinity field closer to the freshwater at ng314. Here the Navy glider says there is a fresh barrier layer, and the Copernicus data assimilation is doing a good job of following this glider profile, both in the barrier layer and below. The US models are missing the barrier layer at 314, and are having trouble matching the salinity throughout the upper 400 m.
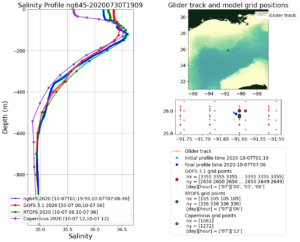
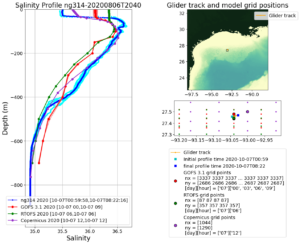
The conclusion for our winter lookback is to look more closely at the salinity structure. The previous blog posted noted the barrier layers based on the models were close to shore. Here Navy glider 314 says the barrier layer extends farther offshore than the models are showing us.
