-
NDBC Buoy-Codar Wind/Wave Comparison Plots
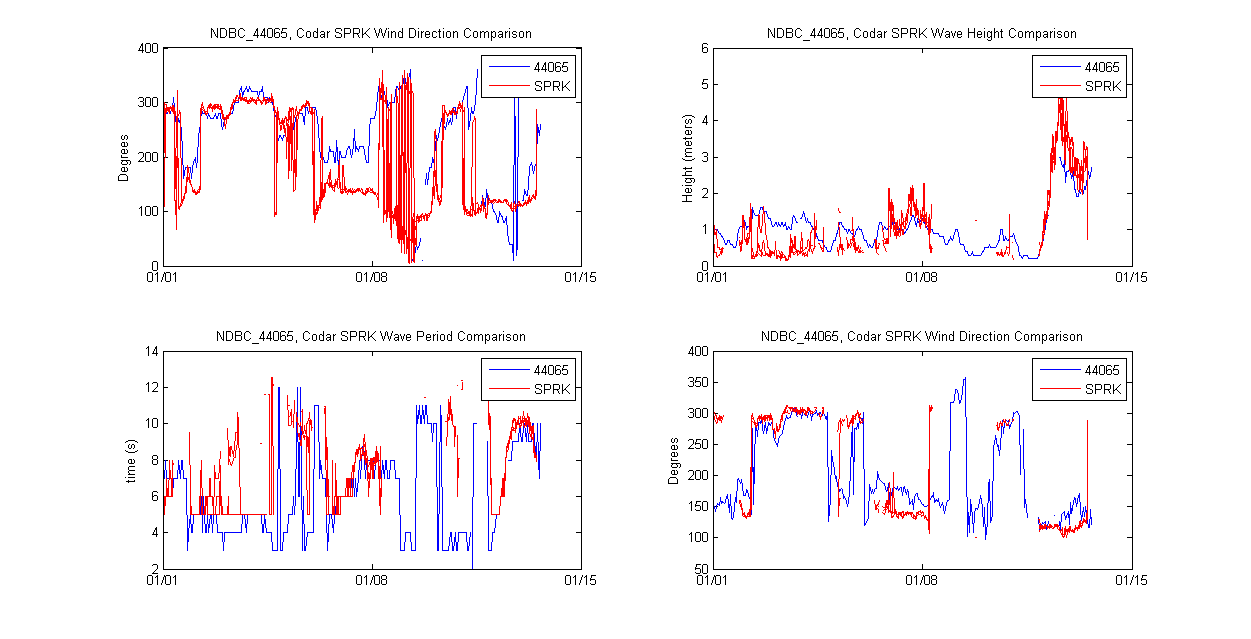
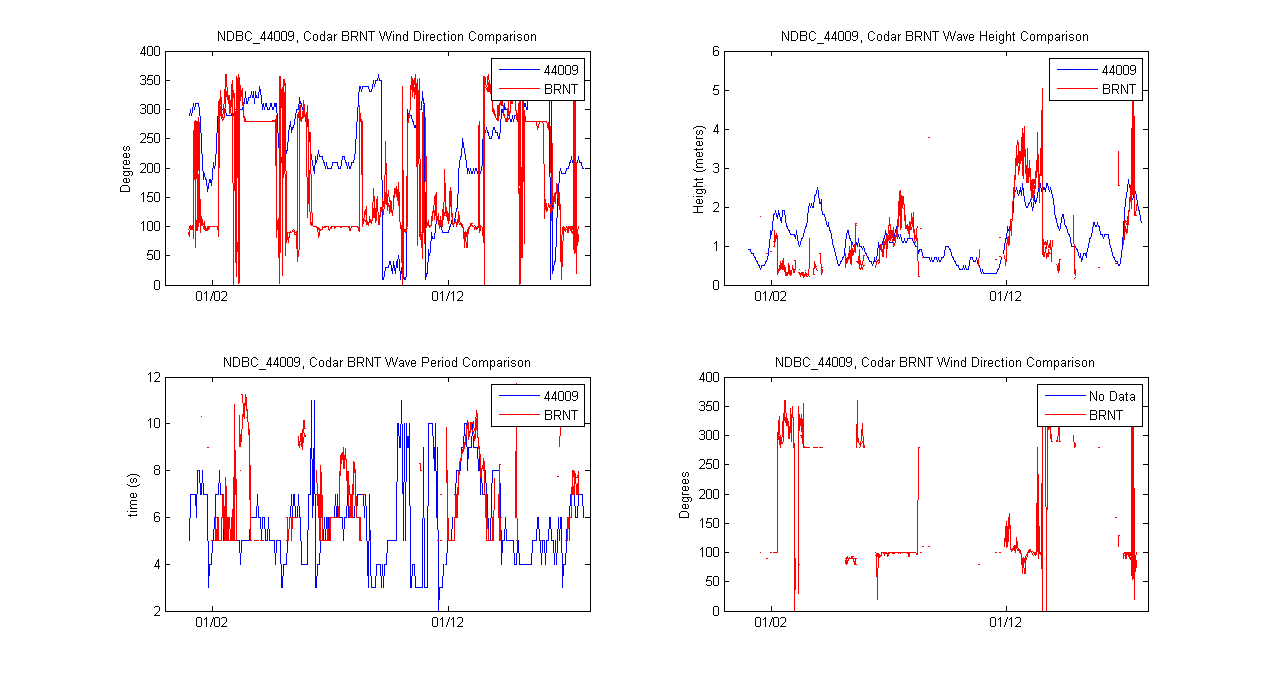
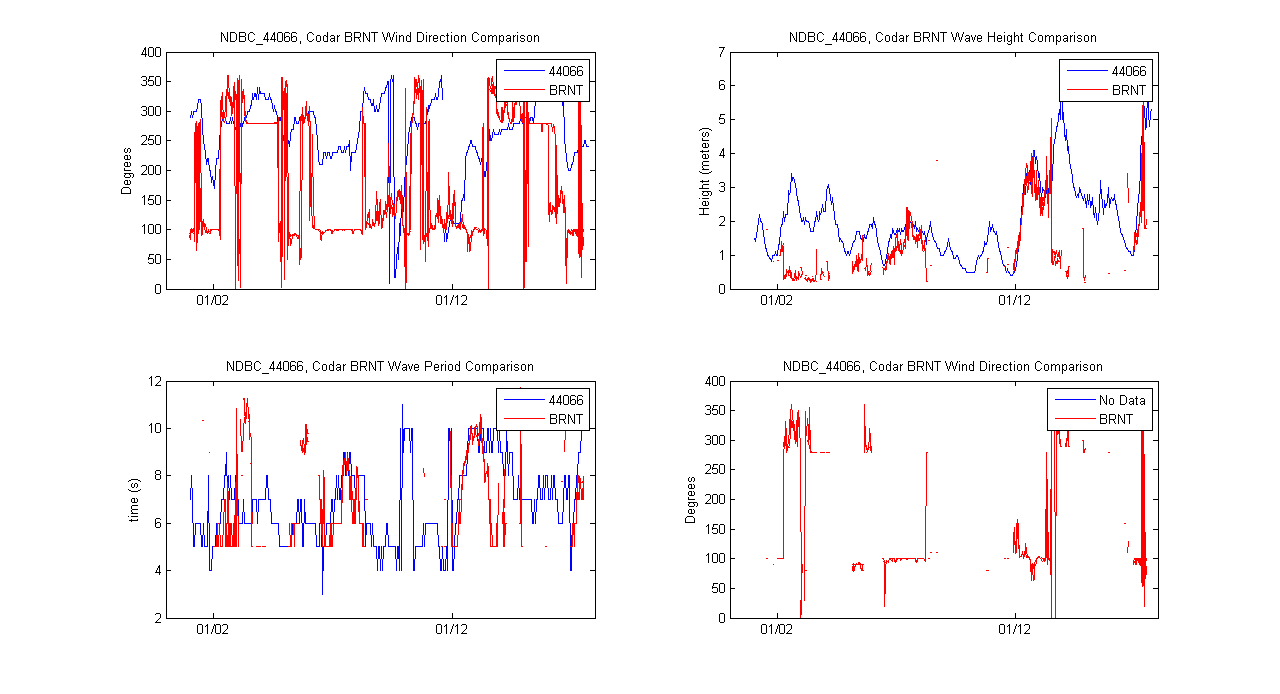
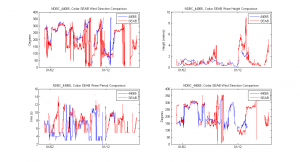
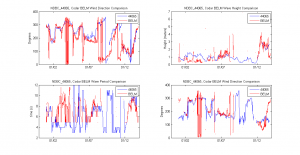
Posted on January 17th, 2012 No commentsBelow are a few subplots displaying real-time wave data taken from 5 13 MHz CODAR sites overlayed with 3 different buoys relative to the site locations. The 5 sites include SEAB, BELM, SPRK, BRNT, and RATH and the buoy locations range from the NY Harbor region to the Delaware bay region.
SEAB-Buoy_44065:
BELM-Buoy_44065:
SPRK-Buoy_44065:
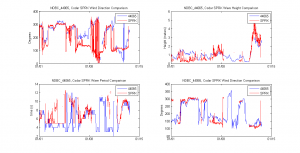
BRNT-Buoy_44009:
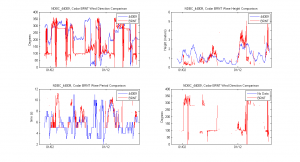
BRNT-Buoy_44066:
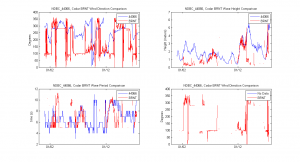
RATH-Buoy_44009:
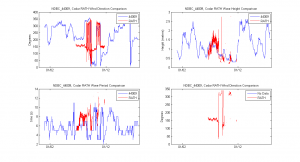
Some of the real-time buoy data taken from the NDBC webpage was missing wave direction values (Seen in the BRNT and RATH plots). For the most part, the data trends are very similar between the 2 systems but there are some spikes in the Codar data, which are evident in the wind direction plots.