-
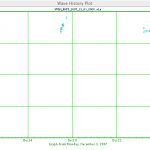
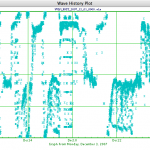
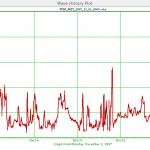
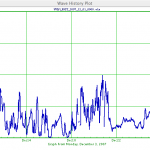
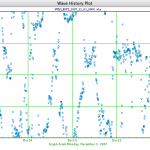
Data Plot: Wave Period, Wave Height, Wave Direction and Wind direction
Posted on June 12th, 2009 No commentsThese plots are for Breezy Point December 1, 2007. The plots are from the Codar data. I will be posting the AWAC and RDI 1200 and 600 plots next time so that we can compare the two.
The plot for Wave Direction seems odd because there isn’t an average for each unit of time, rather only for 2 days or so (Dec 17 and Dec 24).
-