


-
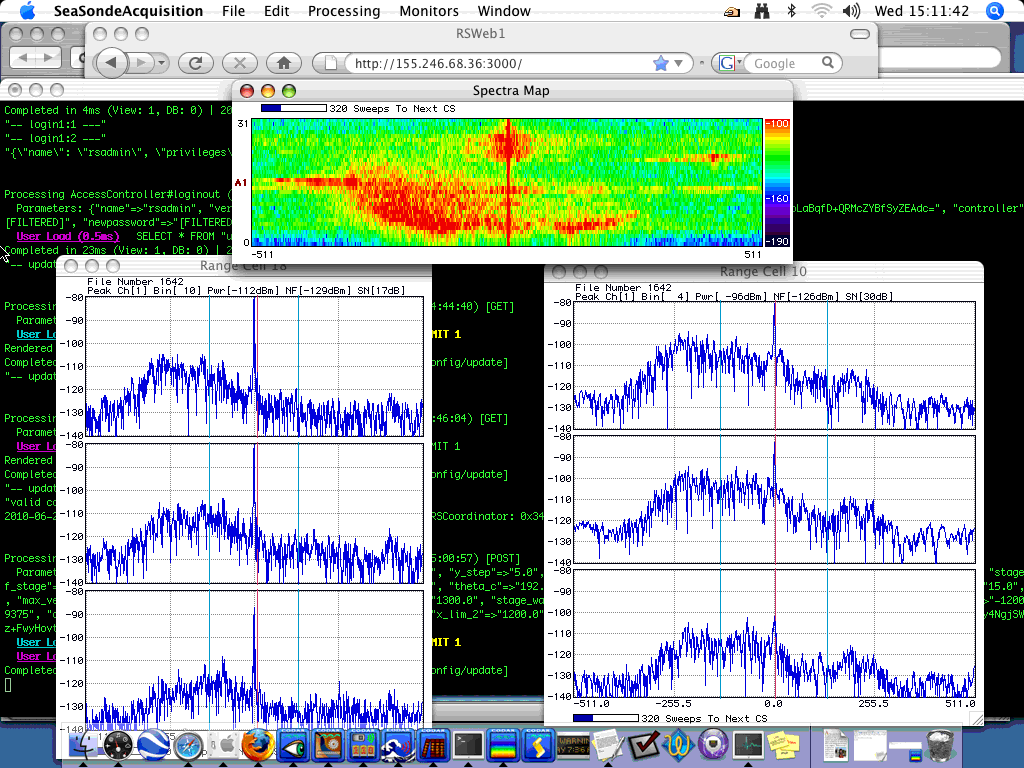
The effect of the buildings
Posted on June 29th, 2010 No comments
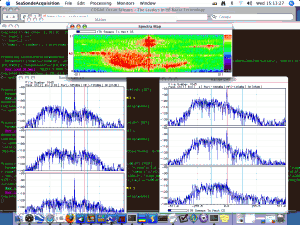
The above image shows the range of our riversonde. The system not only covers the entire width of the river but some range cells spread across the land on the other side(NYC). We know that the stationary buildings contribute to zero doppler shift. This is the reason y we see good smear in the range cells from about 25 to 32 at 0 hz. The fact becomes clear from the spectrogram below.
-
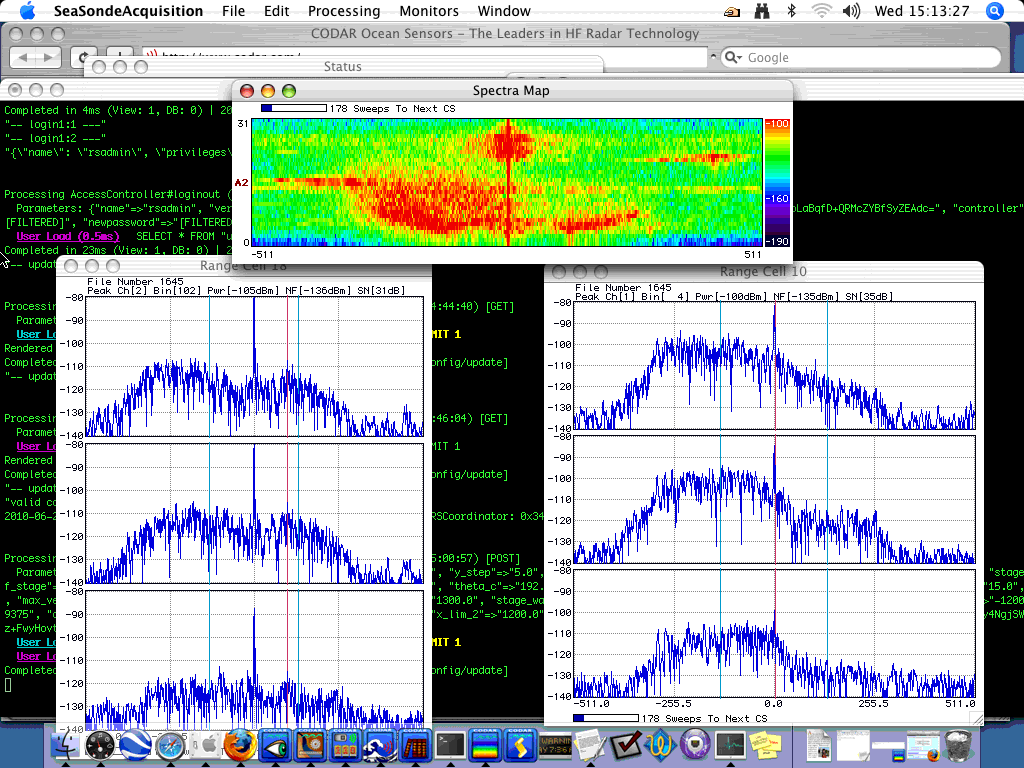
Aliasing
Posted on June 29th, 2010 No comments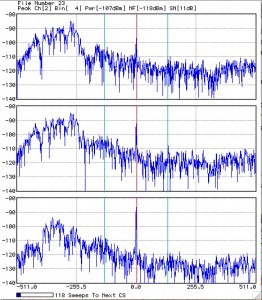
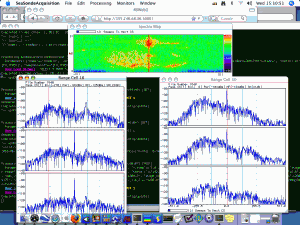
With 16 Hz and 512 Doppler Bins, the above image formed. Even though this graph indicates that a boat is traveling away from the Riversonde, it was actually traveling towards it. This is an example of aliasing, which is when the velocity of a boat is beyond the limits of the graph.
-
Boat Path
Posted on June 24th, 2010 No comments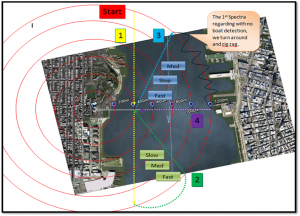
This is the path the Steven’s boat should take in order to perform the next radar test.
-
Configuration of antennas , cables, and channels
Posted on June 23rd, 2010 No comments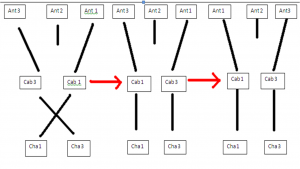
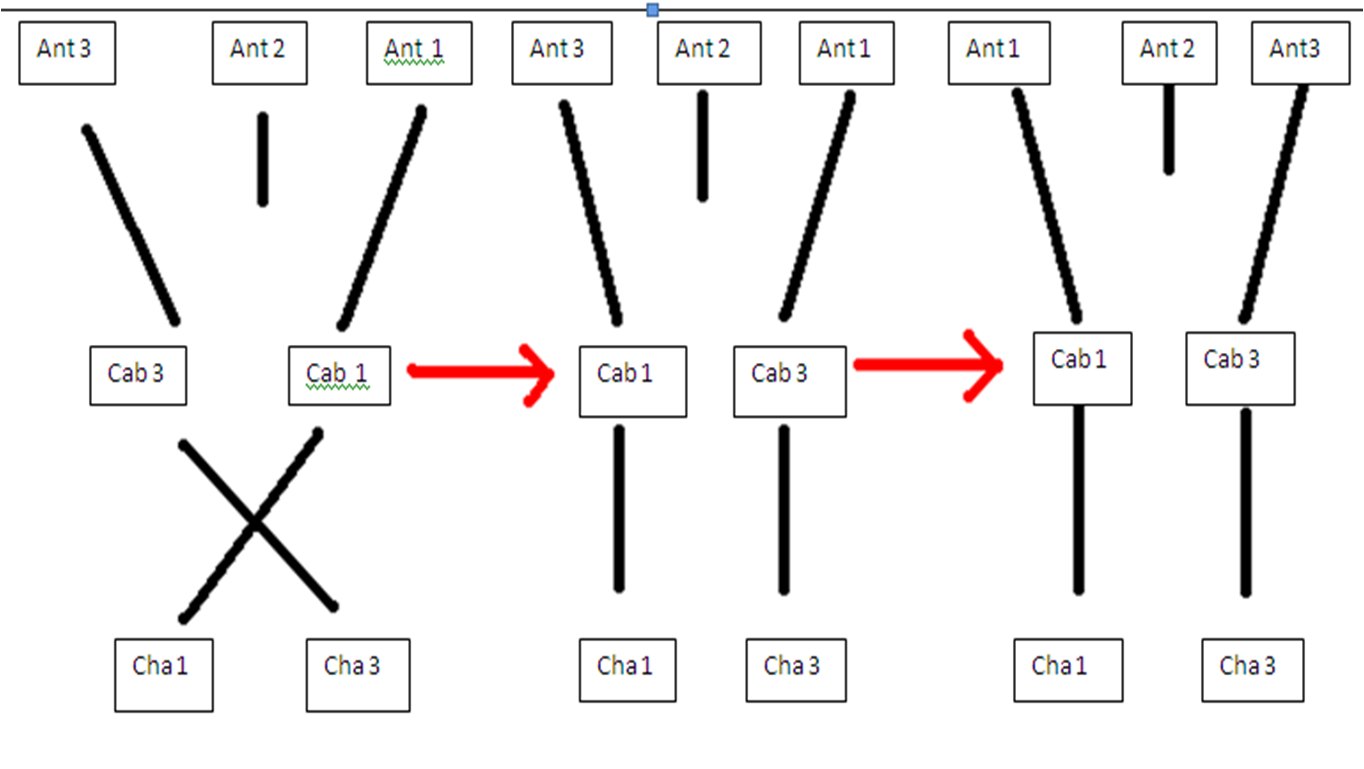
Step 1
First we assembled the antenna so that channel one was connected to cable one which was connected to antenna 0ne, channel three was connected to cable cable which was connected to antenna three. The result was that channel three had low signal.
Step 2
Second we connected channel one to cable one to antenna three, and channel three to cable three to antenna one. The result was channel one had low signal.
Step 3
Third we connected channel one with cable one with antenna one, and channel three with cable three to antenna three. The result was that channel three had low signal again. In this step we switched the legs of the antenna so that they were in the right configuration. one pointing up river and three pointing down river.
This test concluded that the antenna three was the only component to have a low signal in all trials therefore antenna three is at fault for low signal not the cable or the channels.
-
A bunch of discoveries: June 16 to 22
Posted on June 23rd, 2010 No commentsHello all-
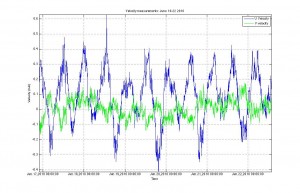
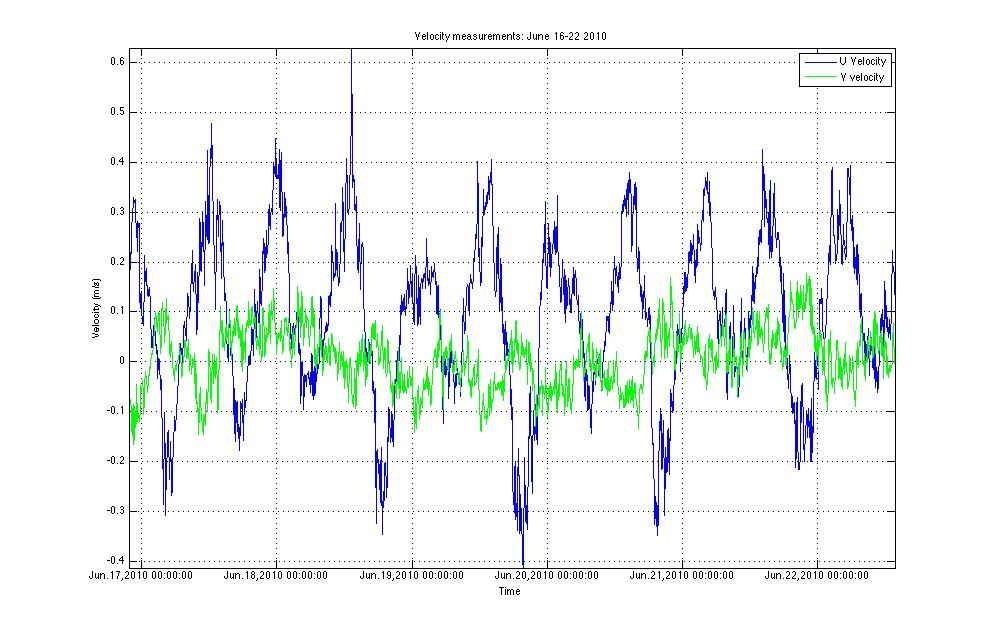
Here’s the u and v velocity plot from the first six days:
Here are the functions associated with this plot. I apologize that these files are NOT .m, but are in Microsoft Word documents. However, simply copy and paste these into Matlab and you should be good to go 🙂
Use these in the following order
variablesorter.doc : This will create variables from the RiverSonde data.
dataconverter.doc : This will converter time from a cell array to datenum format (i.e.:Matlab friendly)
plotcreator.doc : This will plot time and two other variables.
——————————————-
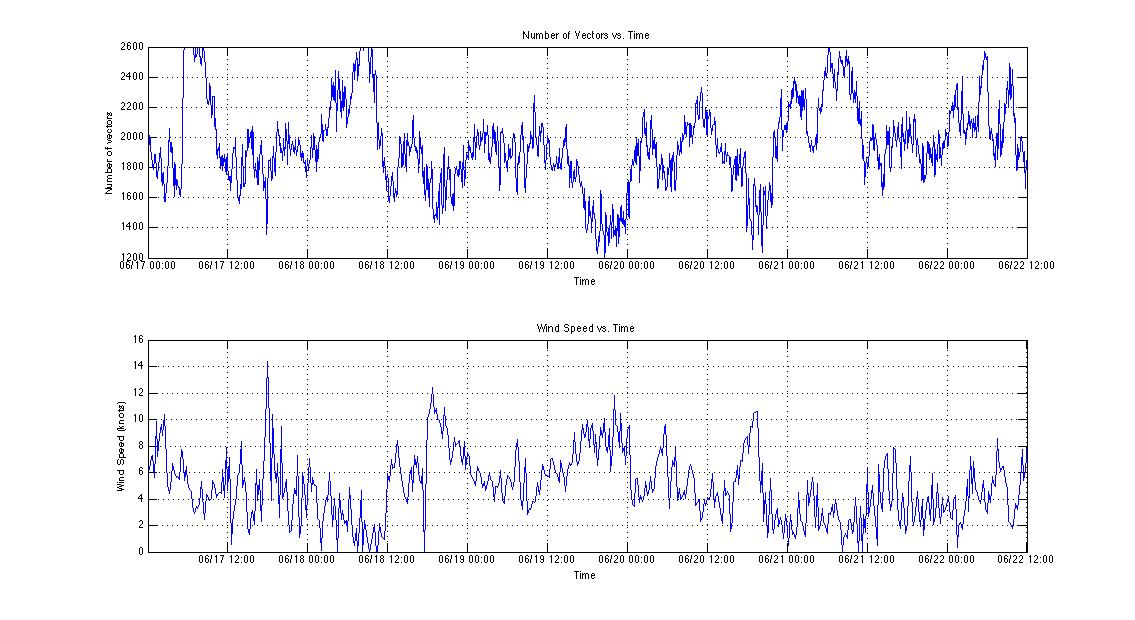
Another plot we wanted to focus on was the number of vectors collected by the RiverSonde. If less vectors were collected, the river surface was rough enough to collect adequate data. A rough surface indicates the presence of wind. Therefore, we decided to compare the number of vectors collected by the RiverSonde and the NYHOPS wind speed measurements:
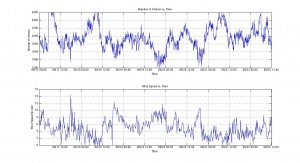
For the most part, the wind speed and the number of vectors mirror each other: when the wind speed increases, the number of vectors decreases.
-
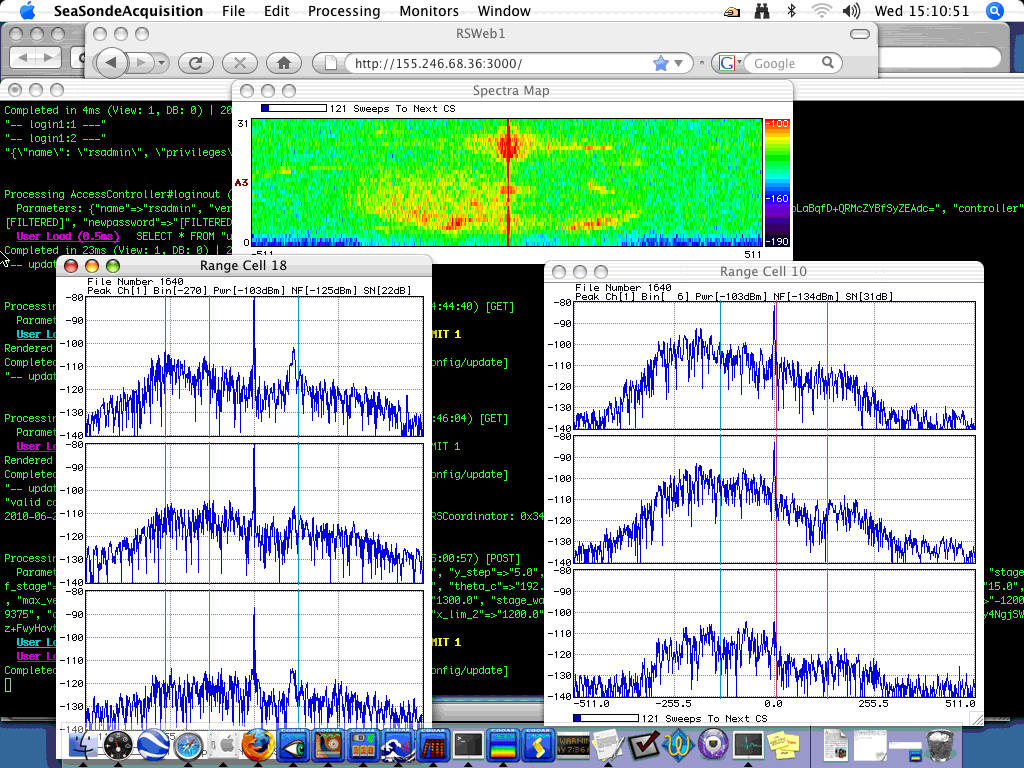
RivesSonde Antennas
Posted on June 23rd, 2010 No comments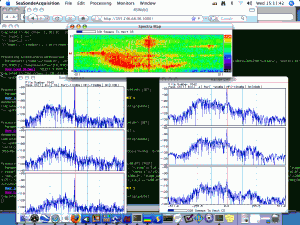

Antennas 1 and 2 are working good. However antenna 3 is not showing the correct spectra due to some problems with the antenna setup.
-
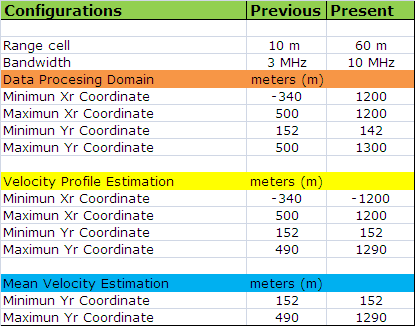
Changes made by Codar
Posted on June 23rd, 2010 No commentsThese parameters are ones that were used to get previous readings along with the new ones set to get current readings. These parameters change the range of the antenna and resolution of the data collected. We went from using low range high resolution data to using a much further range and less resolution.
-
References
Posted on June 23rd, 2010 No commentsHere are some references I found regarding research that has already been done on current measurements:
Ttitle: Near-surface current profile measurements using time series optical imagery
Author(s): Dugan, J., Piotrowski, C., Zuckerman, S., Chinn, C., Yi, M., Vierra, K.
Summary: Currents were measured from Castle Point along the Hudson River via “optical imagery-based measurements of the Doppler spectrum of wide-band gravity waves under a variety of conditions. The goal of this investigation is to extend the spectral measurements to shorter waves than typically resolved from the aircraft, and determine the current velocity profile throughout the top several meters above the ADCPs.”
Title: Airborne optical system for remote sensing of ocean waves
Author(s): Dugan, J.P., Fetzer, G.J., Bowden, J., Farruggia, G.J., Williams, J.Z., Piotrowski, C.C., Vierra, K., Campion, D., Sitter, D.N.
Summary: “A compact, turret-based optical system has been designed and constructed for passive imaging of ocean waves using a small aircraft. The purpose of the system is to collect time series of images, which are mapped to a common geodetic surface in order to extract the space-time characteristics of the waves.”
Title: Jetski-based nearshore bathymetric and current survey system
Author(s): Dugan, J.P., Morris, W.D., Vierra, K.C., Piotrowski, C.C., Farruggia, G.J., Campion, D.C.
Summary: “Nearshore coastal research programs need a methodology for determining the bathymetry and currents in and near the surf, a region notably difficult to survey in the presence of even moderate waves. A reasonably portable system has been designed and constructed that provides survey data on these variables in the nearshore along remote coastlines using either a jetski or amphibious vehicle.”
Title: Multifrequency HF Radar Observations of Currents and Current Shears
Author(s): Teague, Calvin C.
Summary: “Techniques developed for using high-frequency (HF) surface-wave radar to measure ocean currents and vertical current shears in the upper 1 or 2 m of the ocean surface are discussed. A portable coherent pulsed-Doppler HF radar system, developed and used in several experiments, both on land on the California coast and onboard a ship during the Joint Air-Sea Interaction (JASIN) experiment, is also reviewed.”
-
Codar optimizes Riversonde
Posted on June 22nd, 2010 No commentsemail from Don Barrick
Hugh —It didn’t take us long to get into the RiverSonde and optimize the settings after you sent the connection info to us. Lo and behold, we are getting all the way across the Hudson! We did this partly by reducing the sweep bandwidth to 2.5 MHz, which gives us a 60-m range cell. However, we still have 20 range cells to span the river. The bigger the range cell, the more SNR we get because of the larger scatter-patch echo. We can also try smaller range cells, for higher resolution studies for a while.Pass this along to your staff and the Stevens people. We shouldn’t get too optimistic from a couple hours data, maybe wind/roughness conditions were just right. We’d still like to put it on top of the Admin building at some point. And we’d like to plan for a boat antenna pattern run. The latter will need to be done with an active transmitter on the boat, so when Pete returns, we’ll plan for how to do this.
-
River Sonde data
Posted on June 22nd, 2010 No commentsExportedData(2) –works for macs
DHS.exporteddata.xls –SHOULD work for others (Microsoft Excel format)
This is the filtered extracted data from the web interface.


