-
A bunch of discoveries: June 16 to 22
Posted on June 23rd, 2010 No commentsHello all-
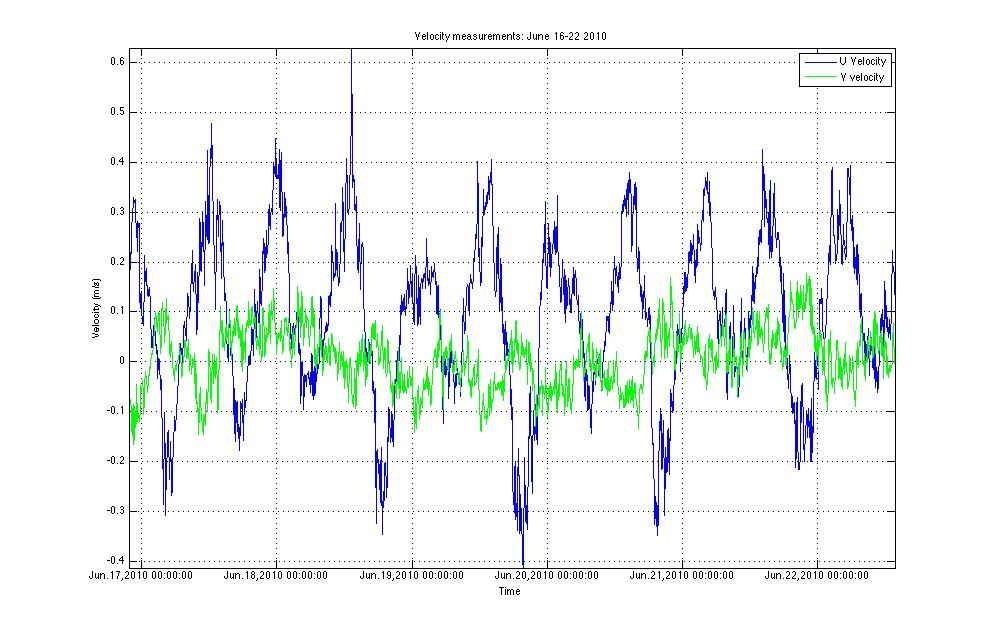
Here’s the u and v velocity plot from the first six days:
Here are the functions associated with this plot. I apologize that these files are NOT .m, but are in Microsoft Word documents. However, simply copy and paste these into Matlab and you should be good to go 🙂
Use these in the following order
variablesorter.doc : This will create variables from the RiverSonde data.
dataconverter.doc : This will converter time from a cell array to datenum format (i.e.:Matlab friendly)
plotcreator.doc : This will plot time and two other variables.
——————————————-
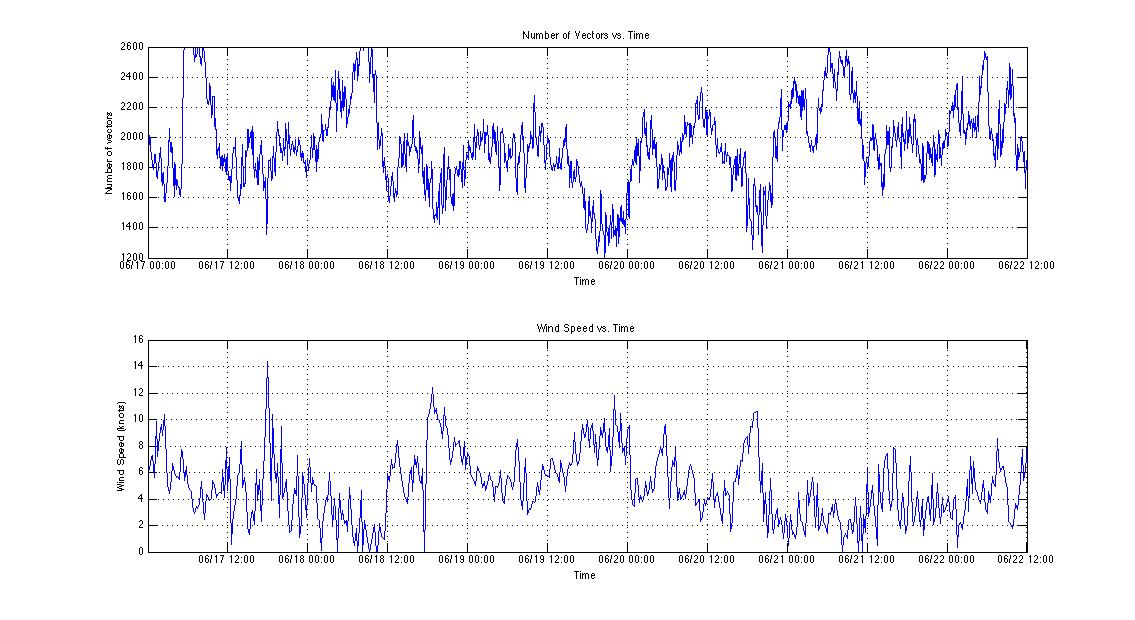
Another plot we wanted to focus on was the number of vectors collected by the RiverSonde. If less vectors were collected, the river surface was rough enough to collect adequate data. A rough surface indicates the presence of wind. Therefore, we decided to compare the number of vectors collected by the RiverSonde and the NYHOPS wind speed measurements:
For the most part, the wind speed and the number of vectors mirror each other: when the wind speed increases, the number of vectors decreases.
Last 5 posts by admin
- Quality Control of Bistatic Signals - June 7th, 2012
- Radial Coverage for March 2012 - April 23rd, 2012
- ru23 as a drifter, Travis Analysis - February 14th, 2012
- Fisher Island - Ideal Pattern Results - February 2nd, 2012
- Yorktown Express - January 31st, 2012