-
Tropical Storm Zeta
Posted on October 25th, 2020 No commentsThe 11 am National Hurricane Center discussion notes the importance of the ocean impacts on Zeta’s intensity in three locations.
- In the current location, the low shear and high ocean heat content in the western Caribbean favor intensification.
- As Zeta crosses the central Gulf, increasing shear and diminishing ocean heat content is expected to prevent intensification.
- As Zeta approaches the northern Gulf, the unfavorable ocean and atmospheric conditions could cause zeta to weaken beyond what is in the official forecast.
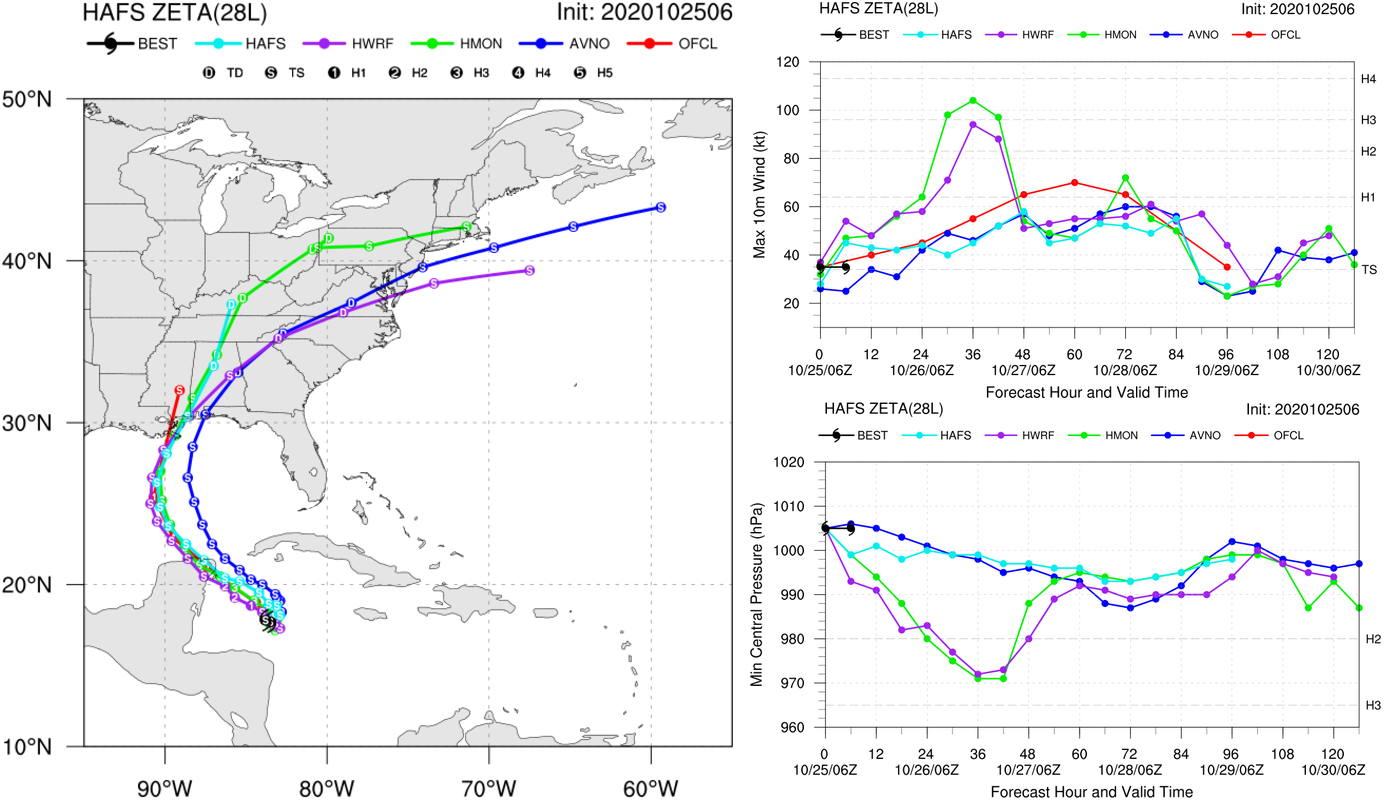
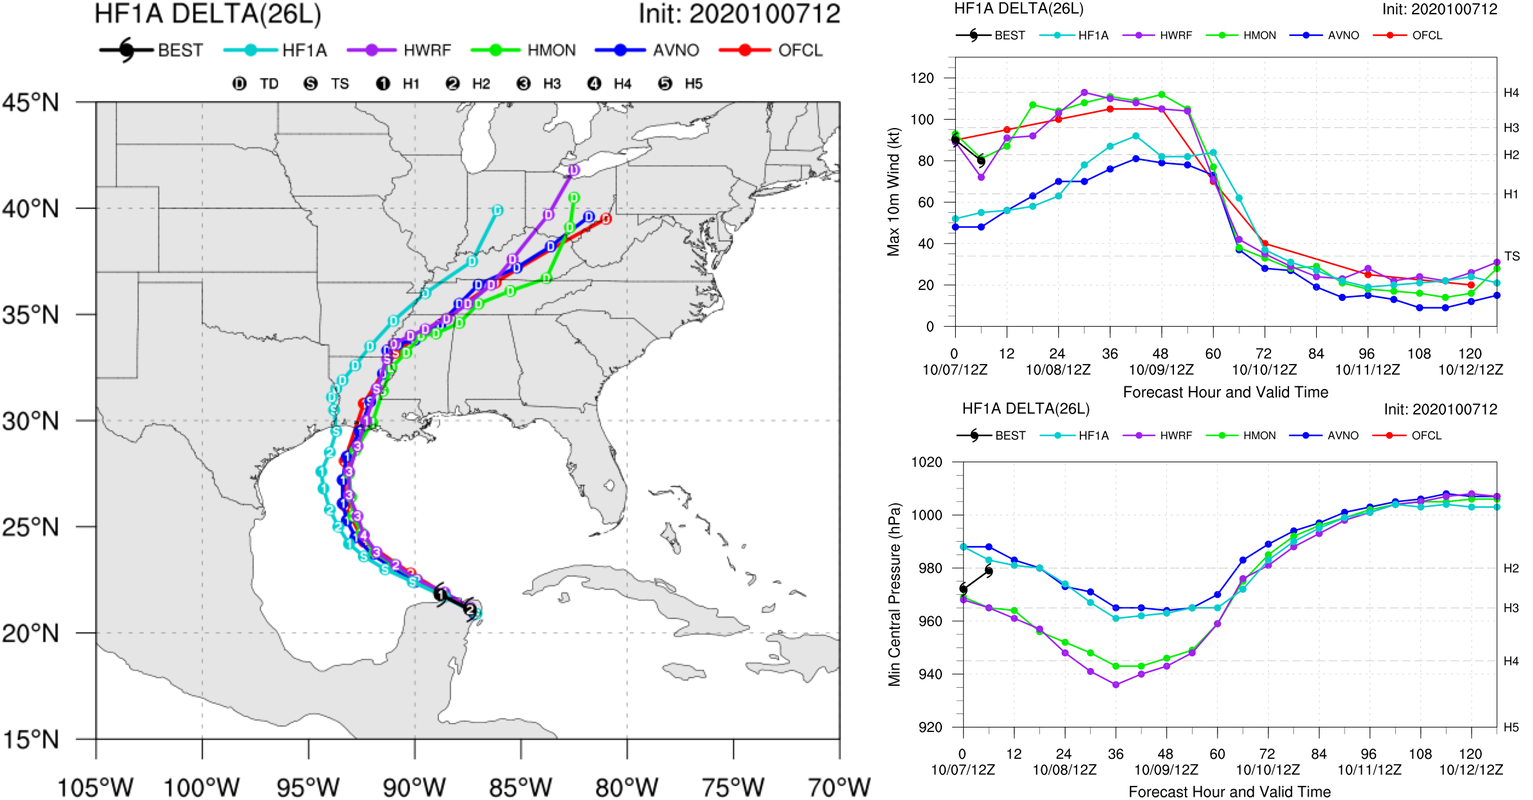
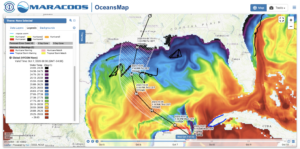
Below is the present regional guidance (HWRF in purple, HMON in green), and what we anticipate will evolve into future guidance, the experimental HAFS model (light blue). The tracks (left image) from these three models have converged since last night, and that makes them easier to compare. Zeta should be going over similar oceans in these models, something to check. On the top right is the intensity plot. The official intensity forecast (red) is above the model consensus. HAFS looks to be below the official forecast, keeping Zeta below hurricane strength as it approaches Yucatan. The operational models are showing the Zeta intensifying as it approaches Yucatan, with HMON going to Cat 3 and HWRF going to a high Cat 2. These models appear to be the ones that include the impact of the high ocean heat content in the western Gulf that the forecasters are saying favor intensification.
-
Tropical Depression Twenty-Eight
Posted on October 24th, 2020 No commentsThe 5 pm NHC forecast discussion reminds us that as this storm approaches the northern Gulf, the cooler shelf waters and the increasing wind shear will likely weaken this storm.
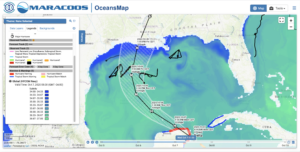
Lets take a look at those cooler temperatures by checking the Navy’s GOFS model SST. Here we see the official forecast track heading through the Yucatan Straits, with the cooler water way up on the shallow shelf of the northern Gulf. The green colors are still up around 27C, so the darker blues below 26c are really up by the coast.
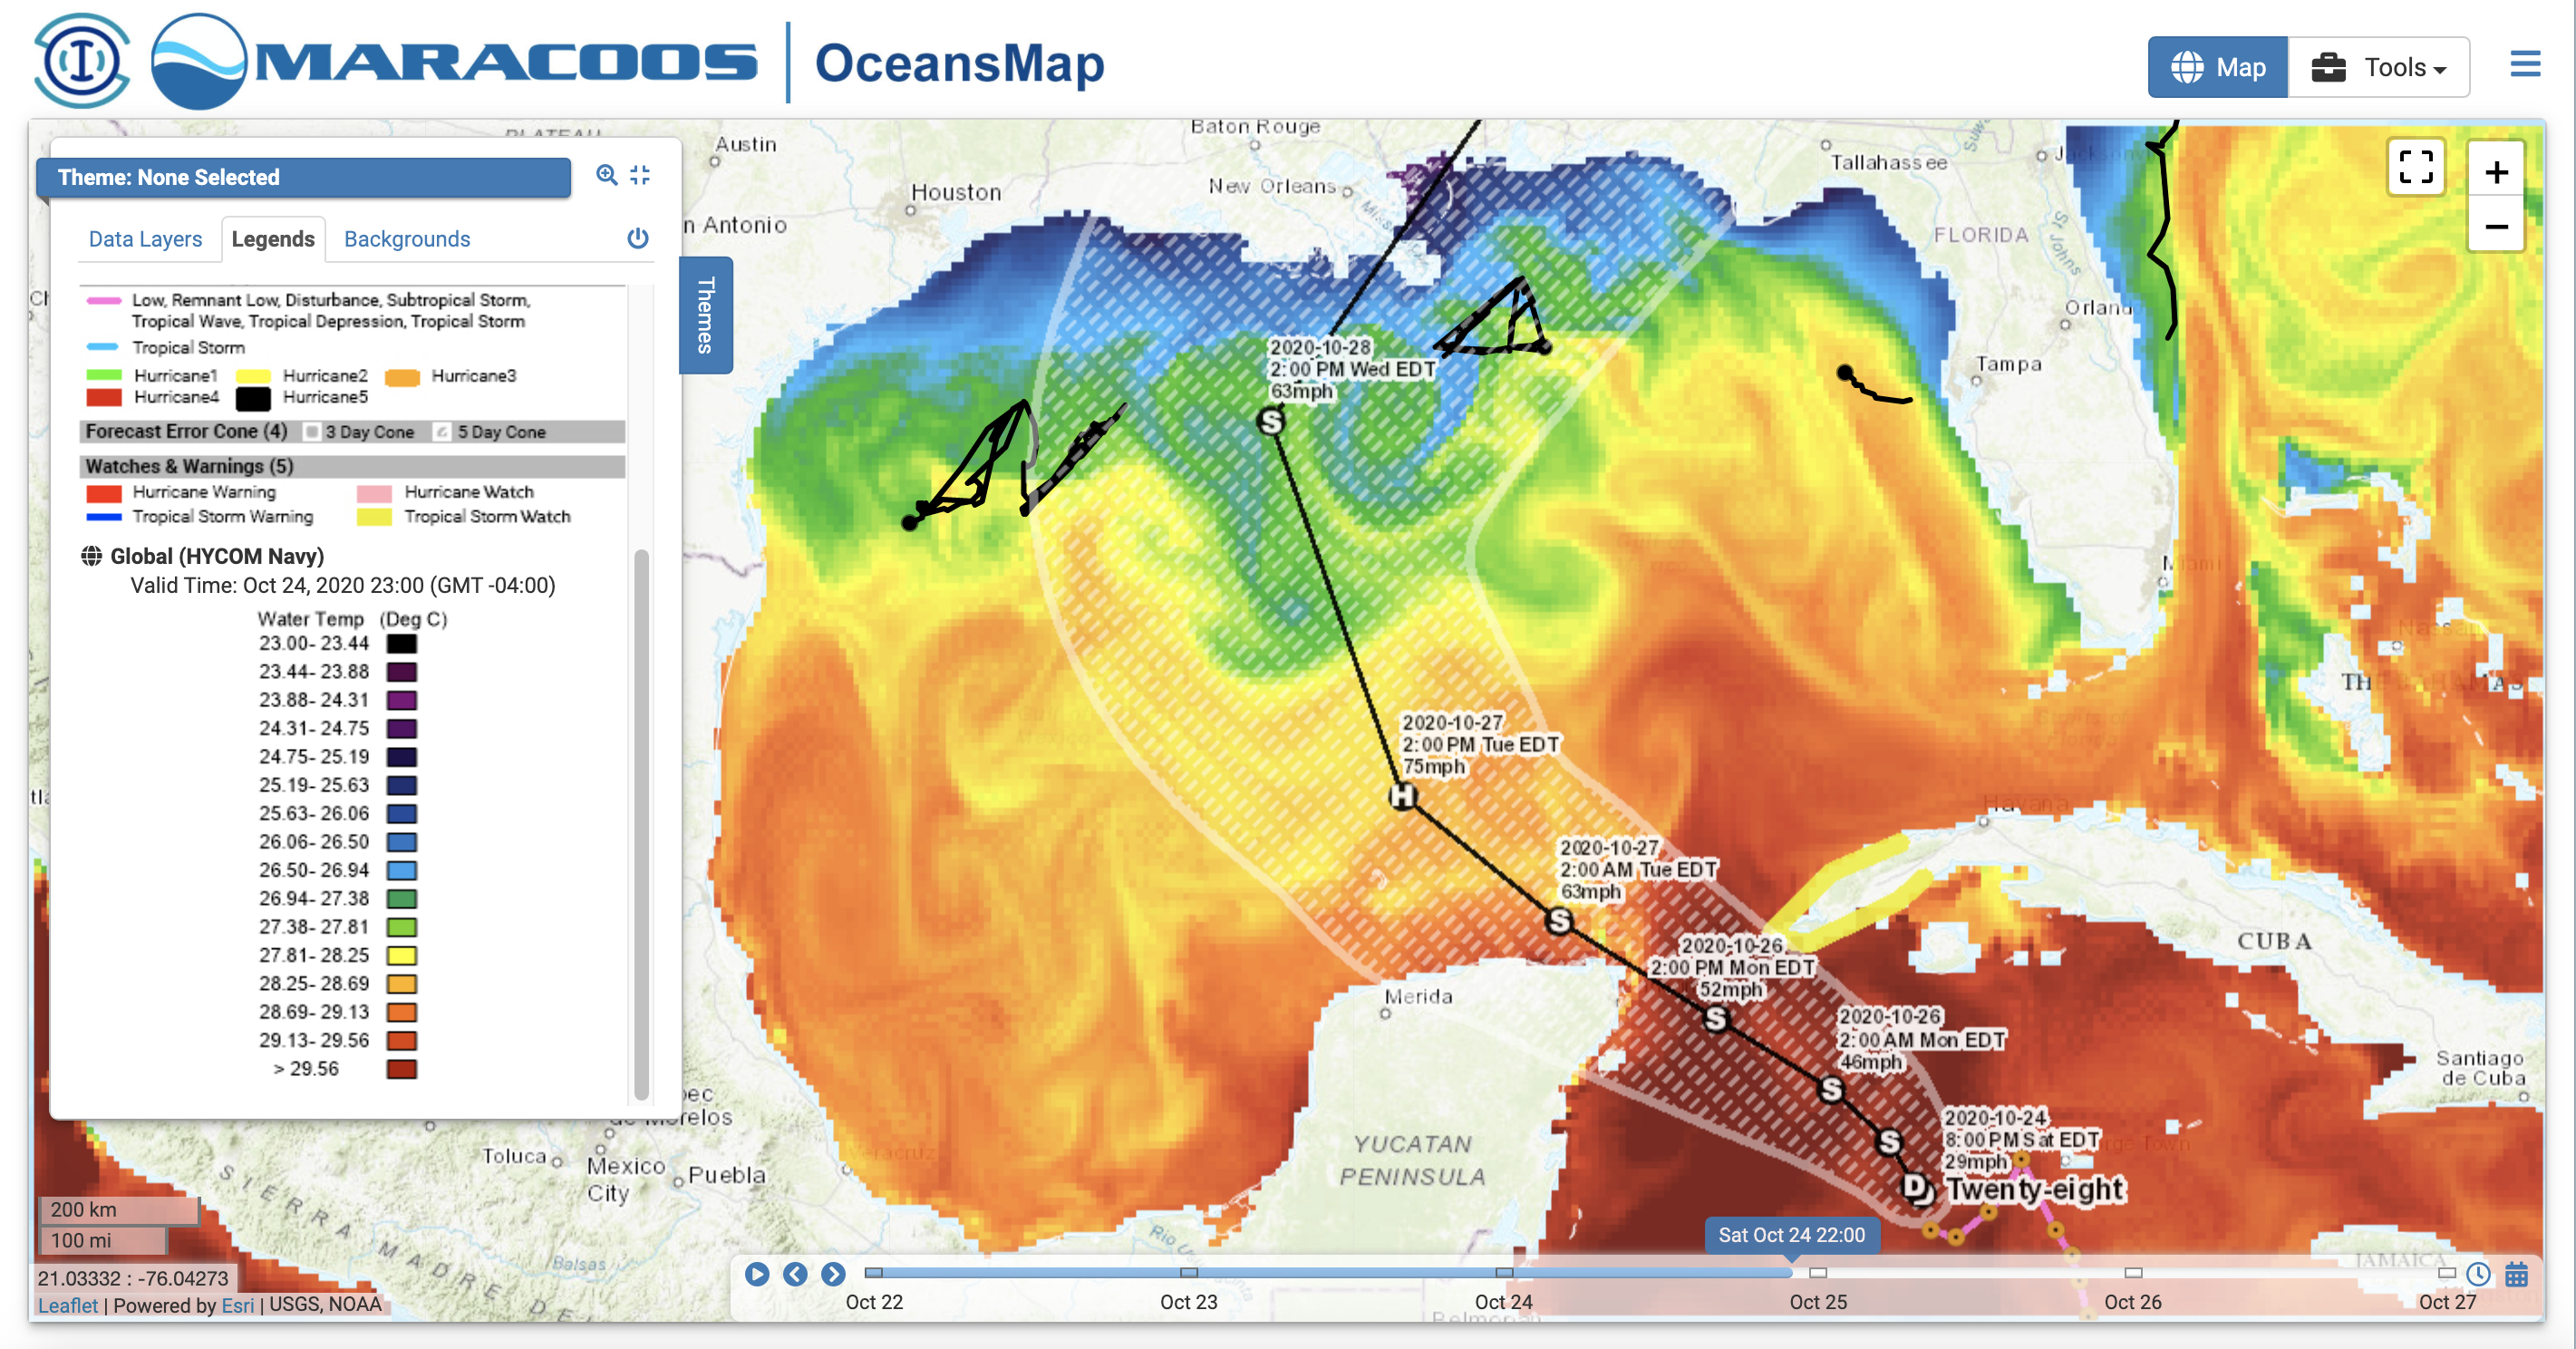
Now lets look at what the forecast guidance is telling us. HWRF and HMON, the two operational regional models, are hugging the right side of the cone, hitting western Cuba and tracking closer to the very warm (near 29C) waters of the Loop Current. Both of these models go to hurricane strength, with HMON hitting Cat 2 for a short period while the tracks are still very close (science question for the winter). If these tracks hold the storm will pass over NDBC’s glider SG601. The experimental HAFS model hugs the left side of the cone, tracking over Yucatan, and the cooler Mid-Gulf waters, remaining below hurricane strength throughout.
-
RUCOOL Updates: August & September 2020
Posted on October 14th, 2020 No commentsAs we transitioned from summer to a new school year, RUCOOL spun up virtual teaching for 7 fall semester courses and continued delivering on 28 research projects in a safe manner, enabled by Rutgers COVID-19 guidelines and our own documented procedures for remaining safe at sea and on shore.
State
- RU COOL faculty are involved in teaching 7 classes this Fall term. Courses include: Software Bootcamp, Ocean Observing, Ocean Modeling and Synthesis, Biological Oceanography, Waves and Sediment Transport, Undergraduate Ocean Observing, Freshmen Oceanography House.
- The first two Masters of Operational Oceanography students defended their theses in August! Julia Engdahl presented her talk on “Developing an Automated Analysis of Fish Migration Video Using Computer Vision Algorithms” in mid August, and in late August, Joe Anarumo presented on “An Open-Source Software Application for Drifter Trajectory Prediction in the Mid-Atlantic Bight”. They have already acquired jobs as oceanographic data analysts at NOAA CO-OPS and Sage Environmental consulting. Congrats to Joe and Julia on jobs well done!
- The second cohort of students have started their fall classes and thesis project. Students are participating in the operations of glider RU29 deployed in the Caribbean to help improve hurricane forecasting. Along with classes and research the students are learning to operate and make decisions about the glider deployment with daily ‘mission control’ meetings.
- Oscar Schofield was named Chair of the School of Environmental and Biological Sciences Chair Council.
- The RUCOOL Education team just completed an online program for 156 middle school kids through the ENIGMA project. ENIGMA strives to answer the question “Are we alone in the Universe?” To answer this fundamental question, scientists from Rutgers University and NASA are going all the way back to Earth’s beginning — back before there were people, dinosaurs, or even plants! The team also completed a new trailer for their research/education work.
- The Ørsted ECO-PAM glider, RU34, completed its first mission on August 26, after spending 28 days surveying the Ocean Wind offshore wind lease area. During that mission, it detected 4 tagged fish, and a fin whale on August 23. It was also at sea during Hurricane Isaias, contributing its data to the other hurricane glider data being taken at the time. The glider is expected to be redeployed in early October. (link: https://go.rutgers.edu/ECO-PAM).
- Through its ongoing work with NJ BPU, RUCOOL contributed to the New Jersey Offshore Wind Strategic Plan, issued by the State of New Jersey in September. (Link: https://www.nj.gov/bpu/pdf/Final_NJ_OWSP_9-9-20.pdf).
- Grace Saba worked alongside Jeanne Herb (Bloustein School) and graduate student Janine Barr (DMCS) to create a science-informed framework for the NJDEP’s overall ocean acidification initiative. They provided consultative science and planning and policy expertise over a compressed period of time for NJDEP to plan, research and design a comprehensive science-informed statewide ocean acidification initiative that may be included in the Coastal Resilience Plan under Gov. Murphy’s executive order 89.
National
- Oscar Schofield has been named Chair of the National Academy Sciences Study “Mid-Course Assessment of NSF progress on 2015 Strategic Vision for Antarctic and Southern Ocean Research”.
- Scott Glenn is chairing the NOAA Science Advisory Board (SAB) Environmental Information Services Working Group (EISWG) Task Team for the review of NOAA’s Response to Congress on the Hurricane Forecast Improvement Program. Draft report submitted for internal EISWG review.
- The RUCOOL Glider Team was involved either in deploying, piloting or recovering 11 gliders in August and September. Our partners in these deployments include the Univ. of Massachusetts Dartmouth, Virginia Institute of Marine Science, the University of Delaware, US Navy, and CARICOOS. During this time of year, the science focus is hurricanes predictability, however supports study of ocean pH, listening for whales, track fish and other tagged animals, and water quality in NJ coastal waters. Data from all of these gliders can be found here.
- RUCOOL maintains the high profile Hurricane Blog. It documents in real-time research findings for August and September focused on Isaias, Laura, Marco and Sally. The blog site is circulated by NOAA leadership and was distributed through the US IOOS Eyes-on-the-Ocean as a recommended data resource (https://rucool.marine.rutgers.edu/blog/category/hurricanes/).
- The RUCOOL Education Team completed an annual report for The Polar Literacy project. An online flipbook of the report is available here. The report includes evaluation results; a summary of the advice and guidance of their advisors; and our second year (2021) plans summarized, in light of the COVID-19 pandemic.
- Our Education Team also just completed a new Broader Impacts Wizard. The Wizard will help applicants develop a broader impacts plan that will satisfy the National Science Foundation Broader Impact requirements and fulfill their interest in communicating your science.
- The Data Labs Blog continues to feature articles on Ocean Observing Education, Python tutorials and examples of Labs. Additionally, the Education Team also has completed several new OOI Data Python Notebooks that involve students in data analysis through interactive widgets.
- MSC research partners from Rutgers University released a RFI for next generation sensor technology for Coast Guard Vessel Traffic Services (VTS). Collectively, the research team received responses from ten companies primarily focused on radar and camera technologies. The team will be reviewing the submissions this fall to assess how the technology will integrate into Coast Guard VTS operations. They will then model the sensor types based on the specifications supplied in the RFI and will make recommendations on the most promising technologies in a final report to the Coast Guard in late December.
- Scott Glenn attended the National Academies of Science, Engineering and Medicine (NASEM) Understanding Gulf Ocean Systems (UGOS) coordination meeting, reporting on the new HF Radar Quality Control procedures developed by the RUCOOL operations team that sets a new standard for the U.S. National HF Radar network.
International
- Oscar Schofield chaired the virtual science symposium focused on the West Antarctic Peninsula on behalf of the International Southern Ocean Observing System.
- Oscar Schofield was asked to Chair the virtual symposium of the Global Biogeochemical Argo program for G7 nations on behalf of the National Science Foundation and NASA.
- Scott Glenn was an invited speaker on Ocean Observing for the US-Indonesia (NOAA-BMKG) 3-day virtual collaboration meeting on climate and weather. BMKG Academy students are excellent candidates for the DMCS Masters in Operational Oceanography.
- Serving on the National Academies of Science, Engineering and Medicine (NASEM) Ocean Studies Board (OSB), Scott Glenn is working on the U.S. Committee for the U.N. Decade of Ocean Science for Sustainable Development to help launch the coordinated U.S. effort in October.
Student Awards
- Emily Slesinger was selected as a runner-up for the 2020 J. Frances Allen Scholarship Award. The scholarship was established in 1986 to honor Allen, who pioneered women’s involvement in the AFS and in the field of fisheries. The scholarship award comes with $2,500. Congratulations to Emily and her mentor, Grace Saba!
Newly Funded Research
- State of NJ Department of Environmental Protection, “Glider deployments for water quality monitoring”, Kohut ($84,464).
- National Science Foundation, “Supplemental Funding LTER Palmer, Antarctica (PAL): Land-Shelf-Ocean Connectivity, Ecosystem Resilience and Transformation in a Sea-Ice Influenced Pelagic Ecosystem”. This proposal was transferred to Rutgers to be the lead institution. Schofield, ($592,668).
- L3Harris (DARPA), “Timely Information for Maritime Engagements”, Glenn ($130,000).
- NOAA IOOS Alaska Ocean Observing System, “Autonomous Assessment of pH and Plankton in the Southeastern Gulf of Alaska”, Saba ($212,507).
- NSF Collaborative Research, “Developing a profiling glider pH sensor for high resolution coastal ocean acidification monitoring”, Saba ($164,347).
- New Jersey Department of Environmental Protection, “Creating a framework to support efforts of the New Jersey Coastal Management Program to address ocean acidification as an element of state coastal climate resilience planning”, Saba with Jeanne Herb ($56,985)
Papers Published: (**Current or Former Graduate Student or Postdoctoral Researchers)
- **Xu, Y., Miles, T., Oscar Schofield. O. 2020. Physical processes controlling chlorophyll-a variability on the Mid-Atlantic Bight along northeast United States. Journal of Marine Systems Volume 2012. DOI: 10.1016/j.jmarsys.2020.103433
- **Slesinger, E., Langan, J., Sullivan, B., Borkman, D., Smayda, T.. 2020. Multi-decadal (1972–2019) Mnemiopsis leidyi (Ctenophora) abundance patterns in Narragansett Bay, Rhode Island, USA. Journal of Plankton Research, fbaa035. DOI: 10.1093/plankt/fbaa035
- Barr, J., Bean, C., McDonnell, J. Aug 20, 2020. Strategies for Running a Successful Virtual Career Panel. Oceanography The Official Magazine of the Oceanography Society. DOI: 10.5670/oceanog.2020.220
- R. Lindeman, F. Straneo, N. J. Wilson, J. M. Toole, R. A. Krishfeld, N. L. Beaird , T. Kanzow J. Schaffer, 2020. Ocean circulation and variability beneath Nioghalvfjerdsbræ (79 North Glacier) ice tongue. Journal of Geophysical Research: Oceans. e2020JC016091. DOI: 10.1029/2020JC016091
- Friedland, K. D., Morse, R., Manning, J., Melrose, D., Miles, T., Goode, A., Brady, D., Kohut, J., Powell, E. 2020. Trends and change points in surface and bottom thermal environments of the US Northeast Continental Shelf Ecosystem. Fisheries Oceanography 29(5):396-414. DOI: 10.1111/fog.12485
RUCOOL Meetings & Conferences
- Though there were no in person meetings due to COVID, there were plenty of virtual meetings during the last two months: Ocean Hackweek Workshop, Offshore Wind Turbine Radar Interference Mitigation Webinar Series, Presentations to several local NJ Schools on various oceanography topics, Ocean Best Practices System Workshop IV, NJ PACT Stakeholder Meetings on Offshore Wind and Renewable Energy. New Jersey Water Monitoring Council Meeting, numerous recurrent hurricane meetings, including (a) national Hurricane Glider Picket Line coordination, (b) Extreme Event Ocean Observing Task Team (EEOOTT), (c) hurricane science meeting with NOAA Research Lab AOML, National Academies of Science, Engineering and Medicine (NASEM) Ocean Studies Board (OSB) Meetings.
-
Five Gliders in a Picket Line
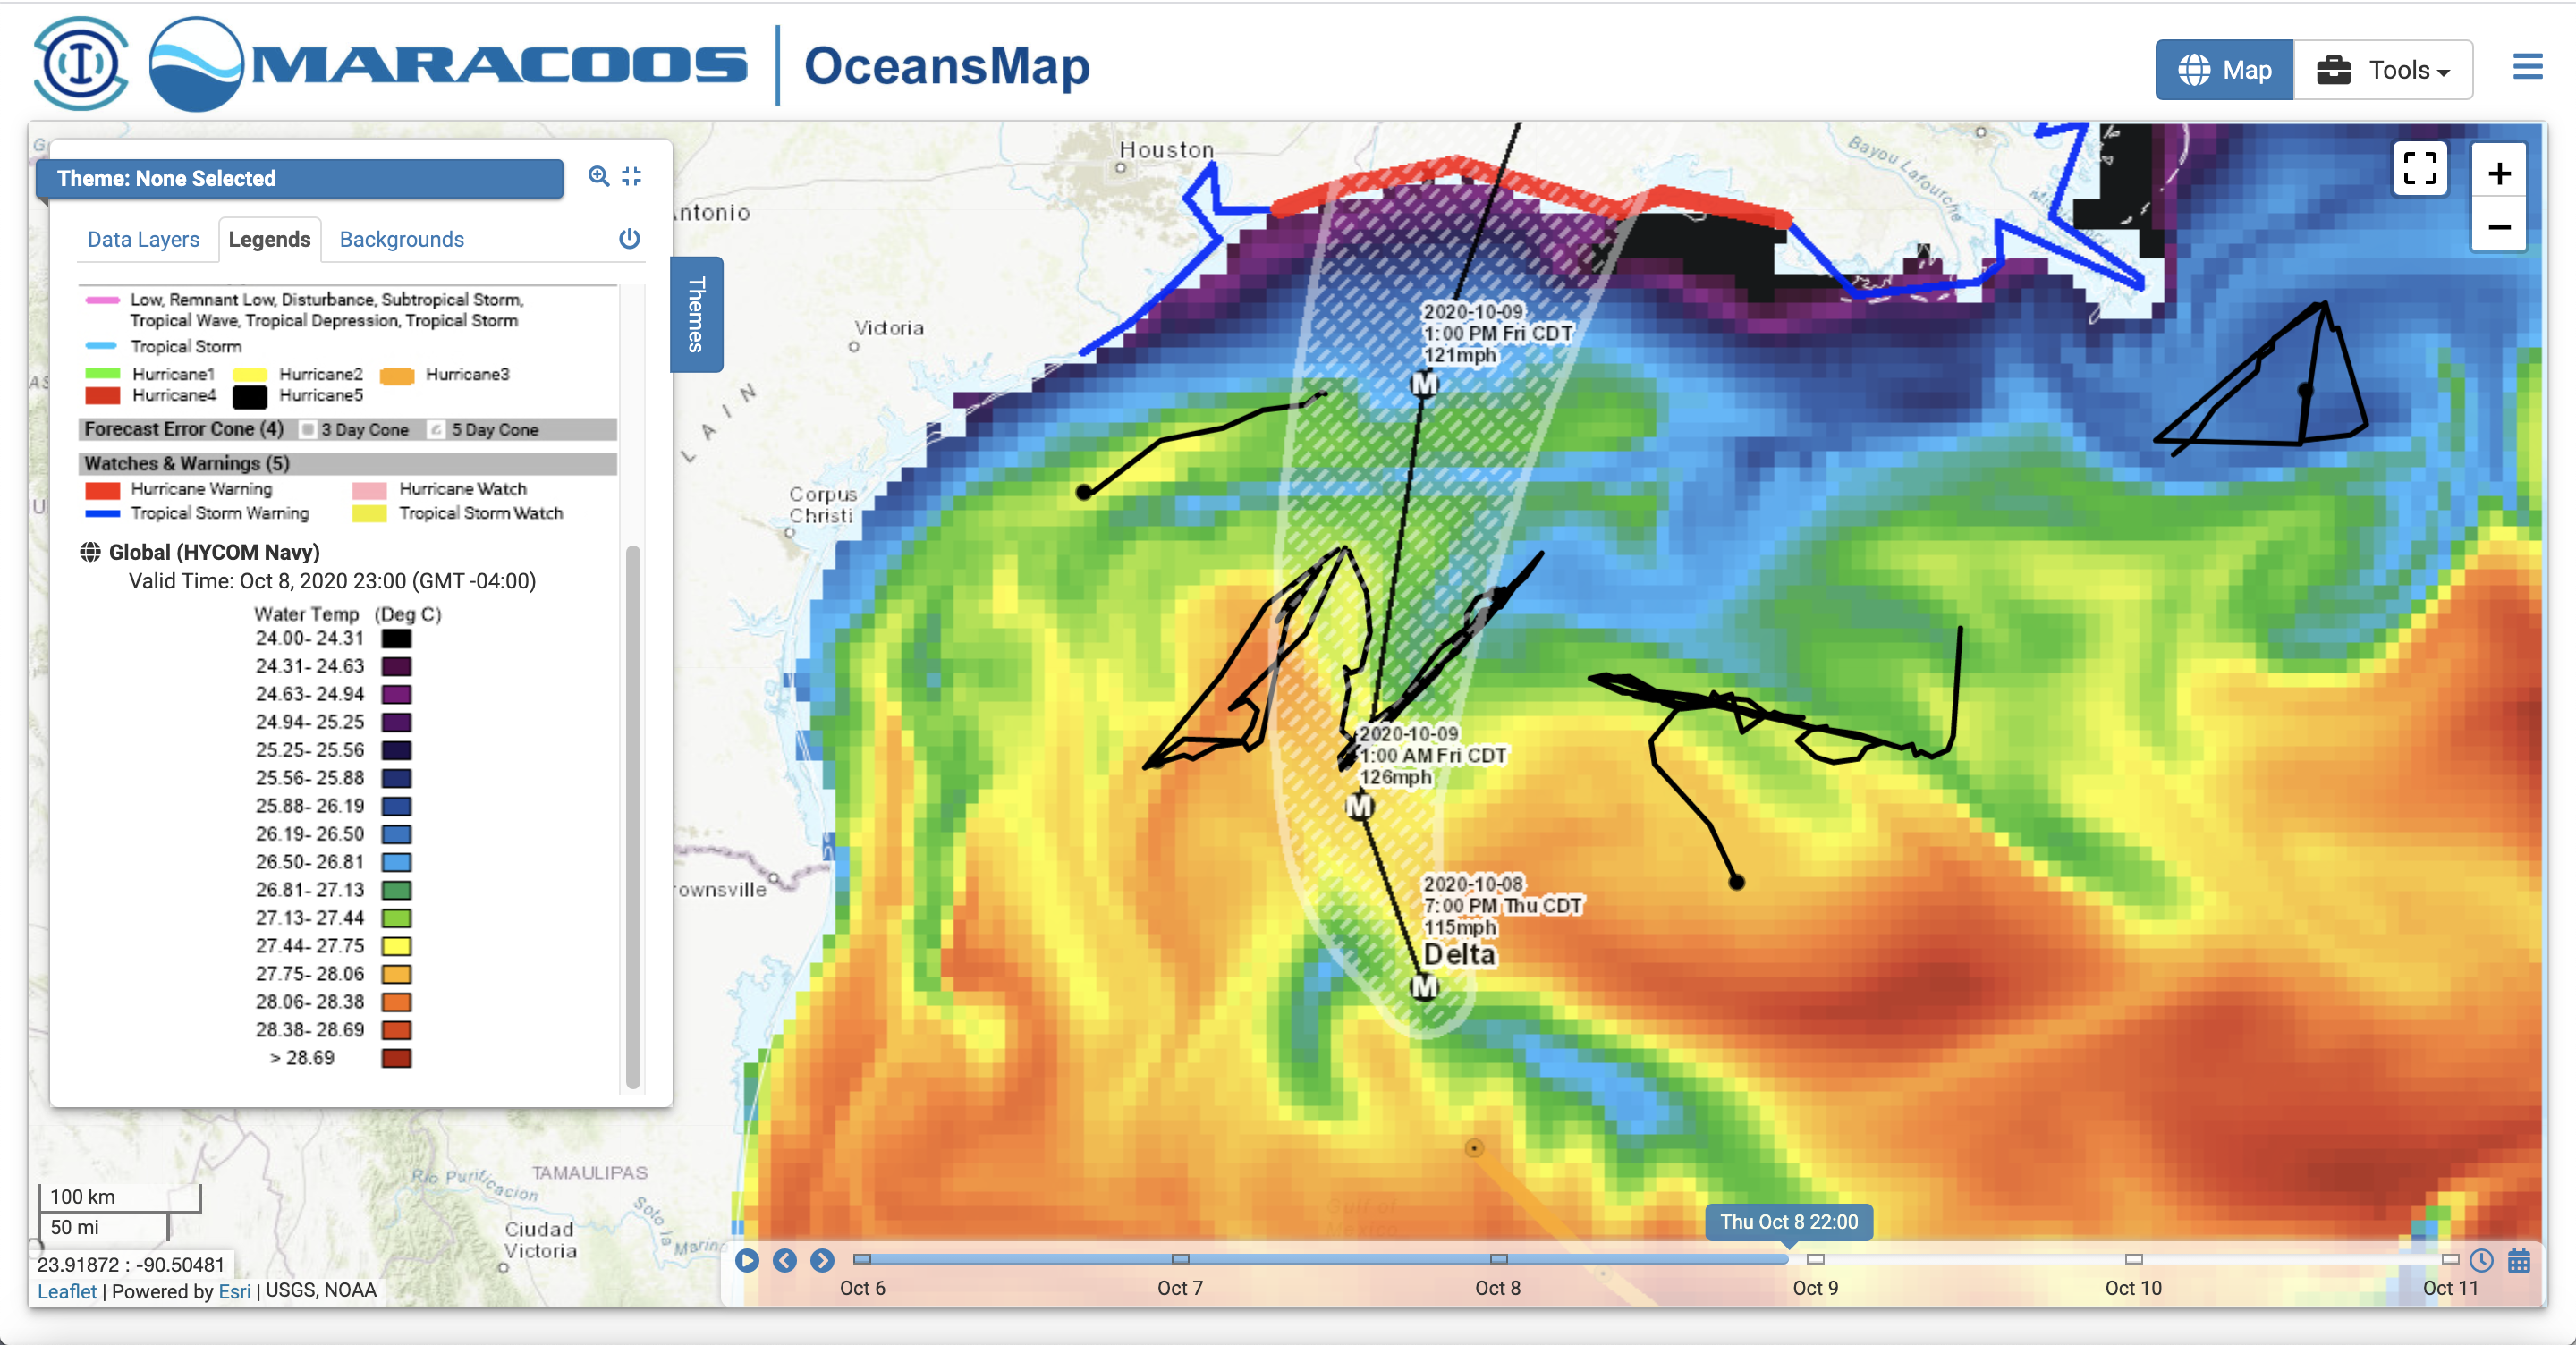
Posted on October 8th, 2020 No commentsFirst a quick view of the northern Gulf the night before landfall of what looks to be a major hurricane. The image below shows the Sea Surface Temperature forecast for the Navy’s data assimilative Global Ocean Forecast System, a consistently high performing ocean model, definitely a good choice for the start of our U.S. hurricane forecast workflow. It nicely demonstrates the value of the hurricane glider picket line concept. These gliders have been deployed for weeks, feeding their data into the GOFS model everyday to do everything we can to put the best representation of the ocean we can underneath our best hurricane models. We have two Texas A&M Gliders on the west, two Navy gliders in the middle, one NOAA glider piloted by USM on the east. Multiple government, university and industry groups working together for the common purpose of generated the best forecasts possible. We call it “Distributed Autonomy”. With sampling distributed in space and time. With operations distributed between multiple shore labs. And sponsorhips distributed between different agencies. What we see below, the pre-storm conditions established by the GOFS model, is one reason why we deploy the Hurricane Glider Picket Line each year – to improve the hurricane models that we are using today to forecast this very storm.
The second reason we deploy the glider picket line each year is shown below. It shows tomorrow’s GOFS forecast of the ocean currents, with the eye of Delta clearly visible a bit to the west of the official forecast, and the ocean current response to the downwelling-favorable winds (remember that blog entry from earlier in the week on upwelling versus downwelling?) along the LA-TX shelf, and we see the size of the storm. Four of the gliders will be directly in the thick of it, gathering the science data that will help us improve the hurricane models of the future. All that data to improve those future models is going to be gathered in the next 24 hours. By robots. No people have to go to sea. We are not overburdening the hurricane hunters and their flight crews. But we are there.
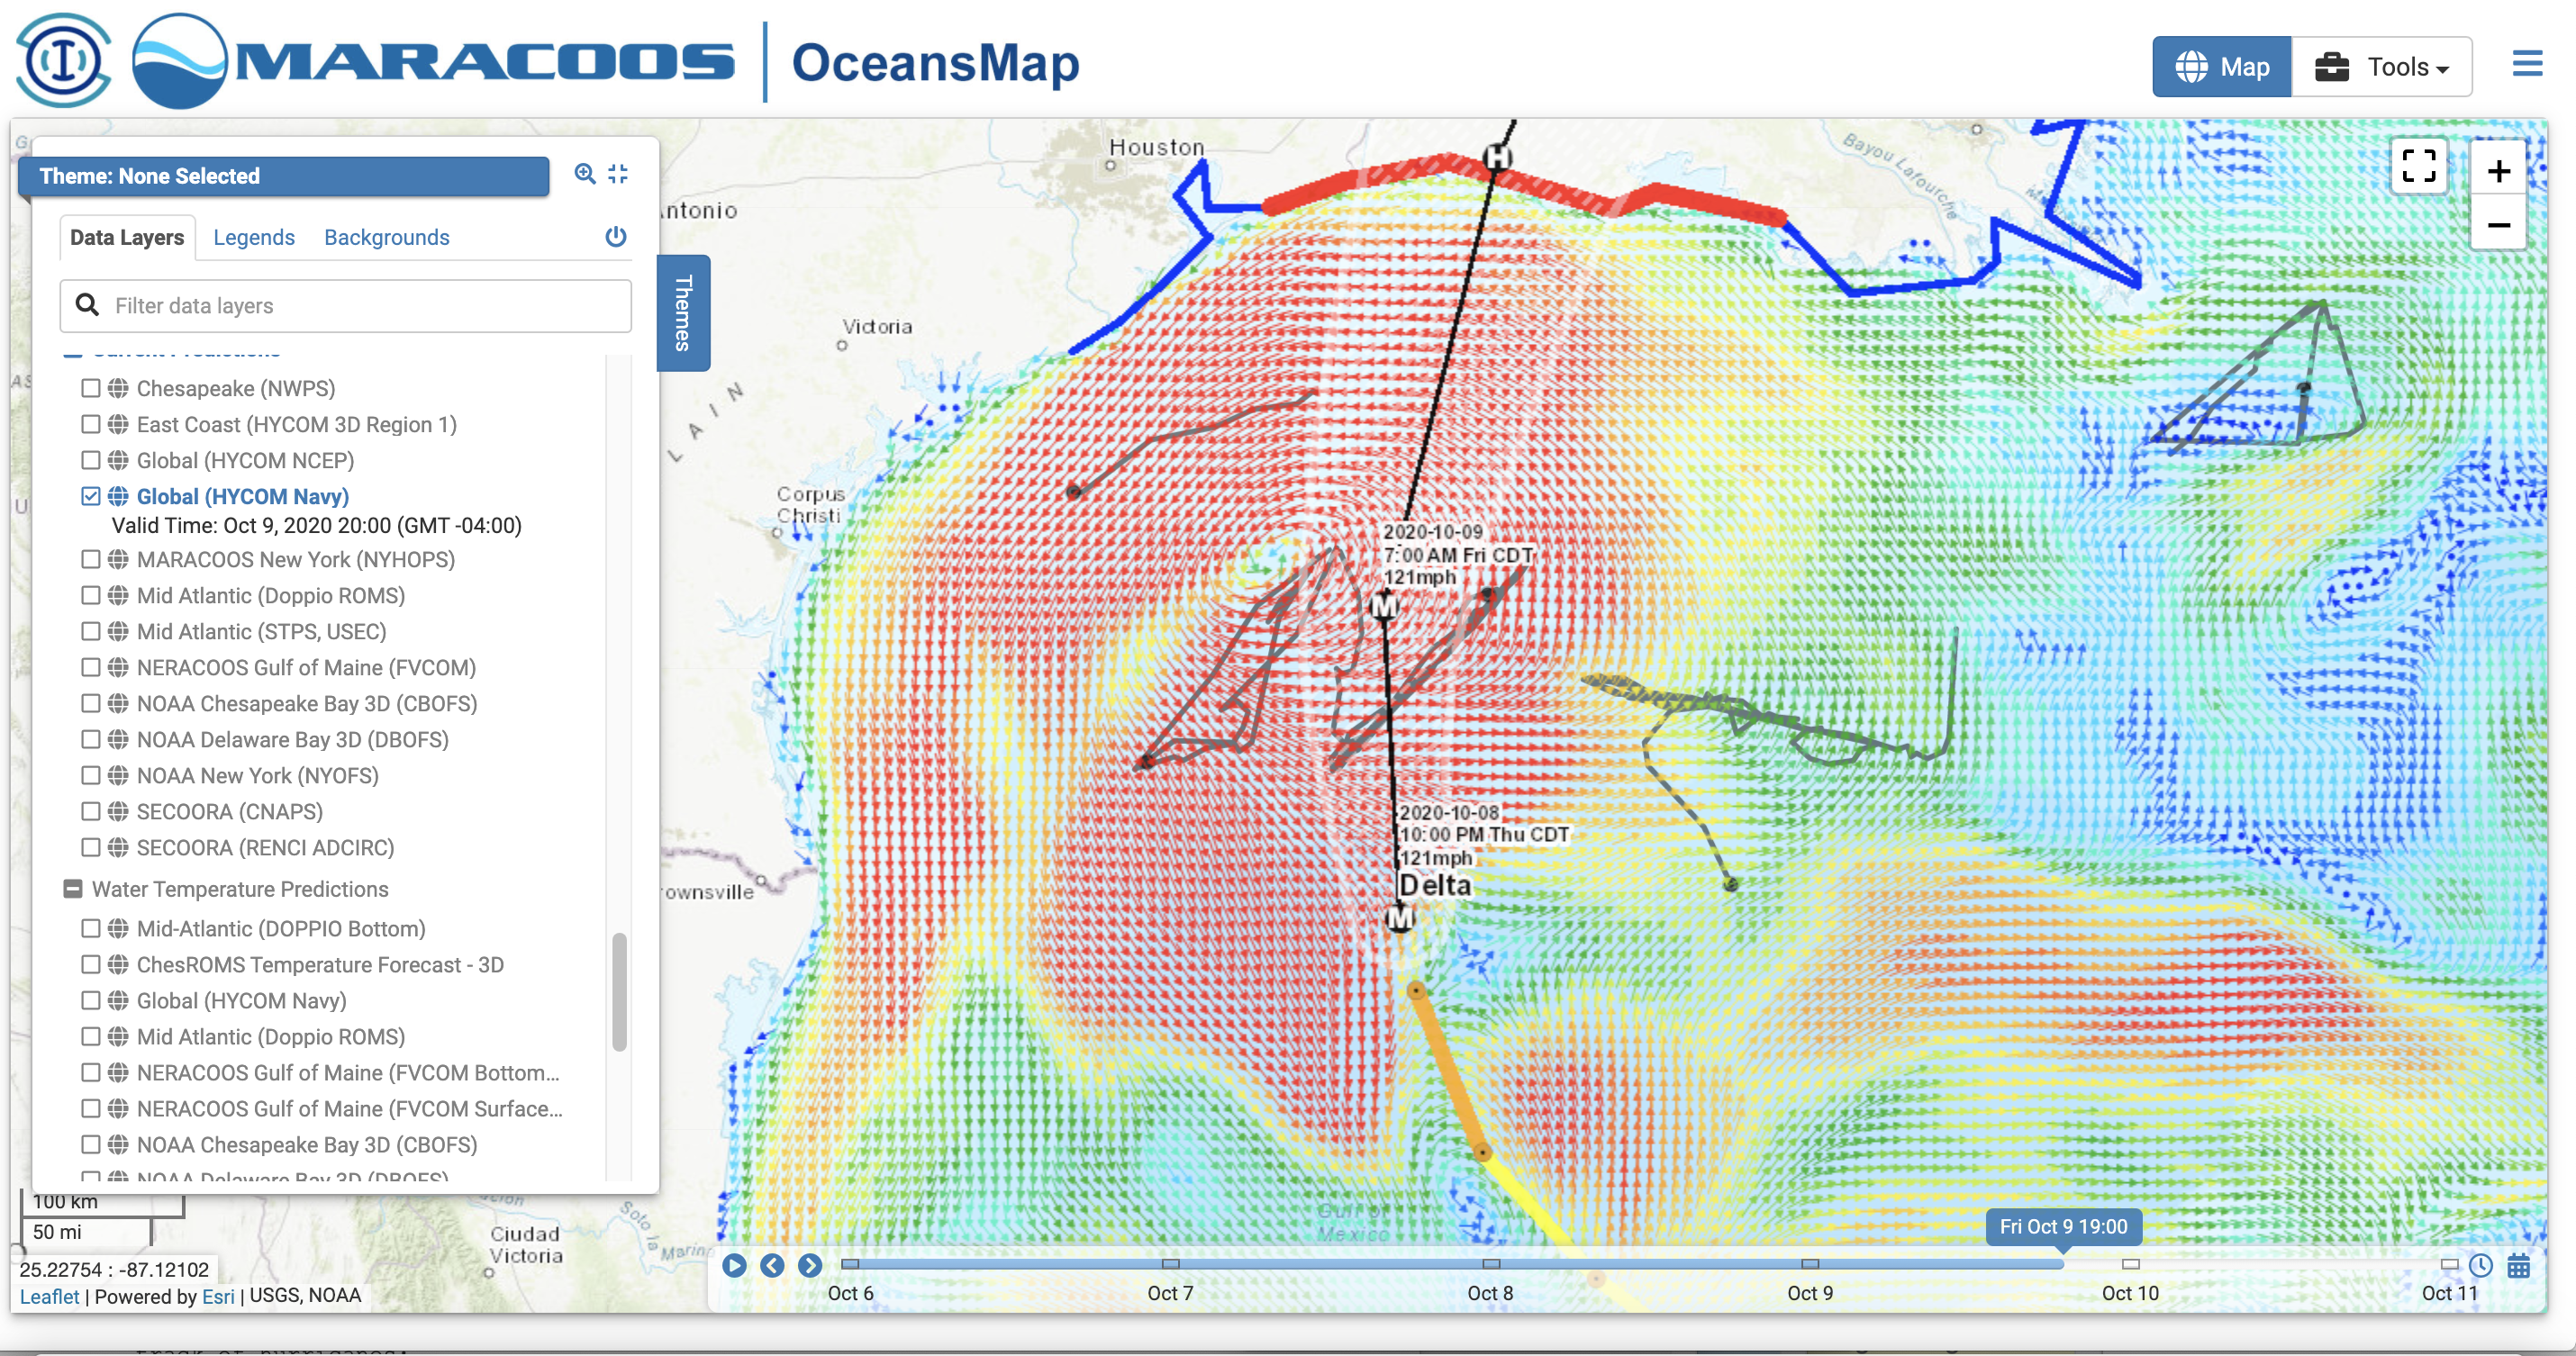
Stay safe Louisiana.
-
When Guidance and Forecasts Align
Posted on October 8th, 2020 No commentsAnother morning with remarkable agreement between the two operational regional models (HWRF and HMON) and the official NHC forecasts (red). Both models are skimming the bottom of the Cat 4 wind speed, and the official forecast is putting it in the middle of Cat 3. Not sure why the experimental HAFS model does not have the right initial condition. Something to check over the winter.
-
Hurricane Delta and the Barrier Layers
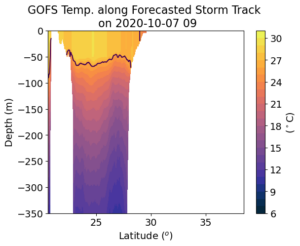
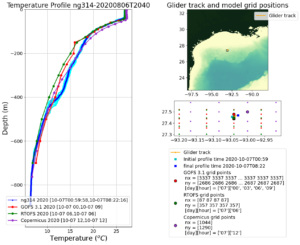
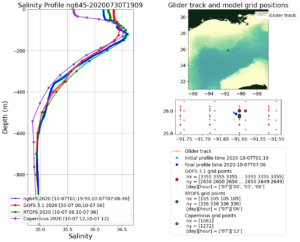
Posted on October 7th, 2020 No commentsWith multiple gliders in place, lets take a look at how the global models are doing with the data. We’ll focus on the two Navy gliders on the right hand side of the forecast track. NG645 is more south, almost central Gulf, and ng314 is further north, still in deepwater, but closer to any freshwater sources.
First the two temperature profiles. First is glider 645, near perfect agreement between the glider profiles in blue and the global ocean models – GOFS, RTOFS and Copernicus. For glider 314, we see a small difference between the temperature profiles in the 200m – 400m depth range. The data and the European Copernicus keep the warmer water deeper than the two US models. The upper ocean in all three look the same.
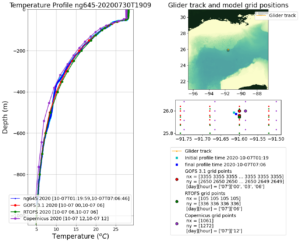
Now we check the salinity for the barrier layers. The southern glider 645 has lower surface salinity than at depth, but not a strong barrier layer like the European Copernicus. Both US models are close to the glider data at ng645. But look what happens to the salinity field closer to the freshwater at ng314. Here the Navy glider says there is a fresh barrier layer, and the Copernicus data assimilation is doing a good job of following this glider profile, both in the barrier layer and below. The US models are missing the barrier layer at 314, and are having trouble matching the salinity throughout the upper 400 m.
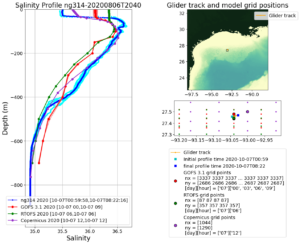
The conclusion for our winter lookback is to look more closely at the salinity structure. The previous blog posted noted the barrier layers based on the models were close to shore. Here Navy glider 314 says the barrier layer extends farther offshore than the models are showing us.
-
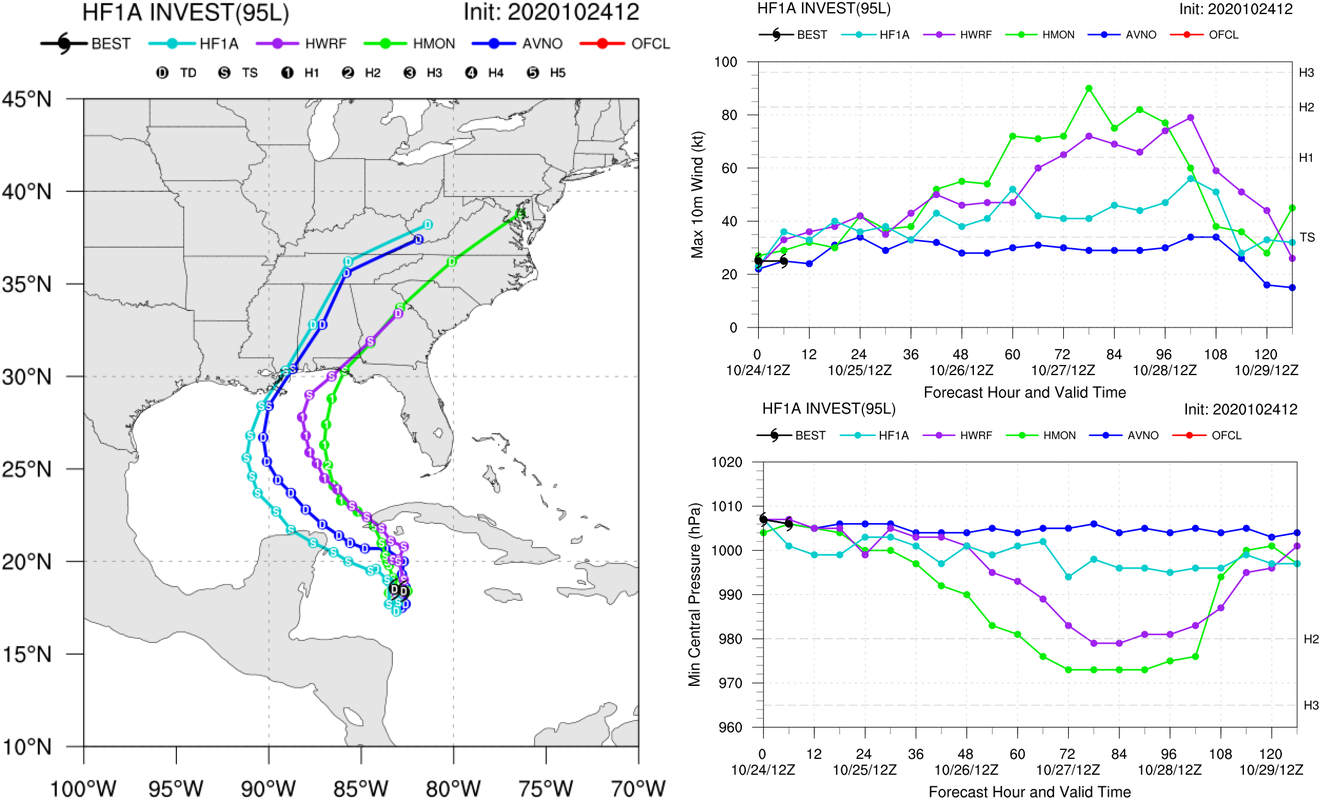
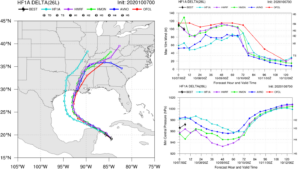
Hurricane Delta in the Regional Forecast Models
Posted on October 7th, 2020 No commentsRemarkable agreement this morning between the two operational hurricane forecast models HWRF and HMON. Both have similar tracks, something we see often, and this morning both are also agreeing on intensity plotted in the upper right in the figure below. Both HWRF and HMON (purple and green lines) have Hurricane Delta just below Category 4 as it crosses the warm waters of the Gulf. The 4 am CDT NHC Discussion notes that they are following the guidance from the stronger regional models, and we see that in the red line for the official forecast. The Discussion credits the high ocean heat content and the low upper level wind shear resulting in favorable conditions for an intense storm. Both models also rapidly drop in intensity after moving inland, but what happens just before landfall? The NHC Discussion highlights the importance of the competing ocean and upper level shear processes to decide if there will be any weakening just before landfall, noting there there is an increase in the upper level shear, and there is slightly less heat content in the ocean as the hurricane approaches the coast. The new experimental HAFS model, the light blue line below, has a more westward track and a significantly different intensity – lets mark that as a good discussion point for the winter reanalysis of this hurricane.
Below is the OceansMap view of that Sea Surface Temperature distribution. Delta if forecast to track right up through the center of the warmest surface temperatures in the western Gulf. It then crosses the slightly cooler waters approaching landfall, but even the blue shade below is above 27C. We do not see surface temperatures below 26C until right up by the coast. Also looks like we have 5 gliders nicely aligned cross track for the Hurricane Glider Picket Line, with 3 gliders spanning the track uncertainty cone, 2 gliders further off in the high wind areas to the left and right. The NHC Discussion notes that they expect Delta to grow in size as it approaches the northern Gulf.
Next we look at the Sea Surface Salinity from the Navy GOFS Model. Look for any low salinity barrier layers that inhibit mixing and contribute to intensification. We see that the surface salinity is relative uniform across the Gulf with the low salinity barrier layers confined to the areas along the northern Gulf coast. So the band of slightly cooler surface waters that could promote weakening are also covered with a low salinity barrier layer that could promote intensification. Another test case for the winter reanalysis.
Now we look at the subsurface temperatures along track in the global ocean models where the ocean data assimilation takes place. The automated processing follows the hurricane track and plots the upper 350 m of the ocean temper field along the track. White areas are when the hurricane is over land. First is the Navy GOFS model that does the actual assimilation. The NOAA RTOFS model (second plot) looks back 2 days in the Navy model and then moves forward without assimilation but with the NOAA winds layered in. The global RTOFS then provides the initial condition for the coupled regional ocean model in HWRF and HMON. The first thing we note is that there is very little difference between the two models along the storm track – a good thing. The gliders and argo floats have all been deployed well in advance, and there has been plenty of time for the data to work its way into the assimilative model as well as the downstream NOAA forecast models. The two figures below also plot the location of the 26C isotherm as the black line. The depth of this isotherm used to calculate heat content is relatively constant across the Gulf, hovering around a depth of 50m-60m. Temperatures above the 26 C vary as you move north along the track but are relatively constant in the vertical in this upper layer down to this 26C isotherm. So SST is going to be a good proxy for the heat content variations pre-storm. We also see that only as the storm is crossing the shallow continental shelf waters nearshore does the temperature drop below 26C. Watching how this water reacts as the storm approaches is one thing we will be watching. As Delta approaches the coast from the south, these coastal waters will experience strong winds to the west. Alongshore winds to the west are downwelling favorable. Downwelling can move this cooler nearshore water off the shelf along the bottom, and replace it with warmer water transported in from offshore. Thus the hope that this band of cooler water may offer some protection assumes that the water is stationary, that it does not move. With strong nearly Cat 4 alongshore downwelling favorable winds from the leading edge of Delta, that water is going to move. Depending on the forward speed of Delta at the time, that water may have plenty of time to move well ahead of the eye passage. Just like we saw with the glider in Hurricane Sandy.