


-
Hurricane Delta and the Barrier Layers
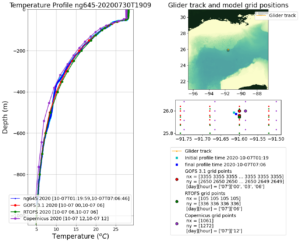
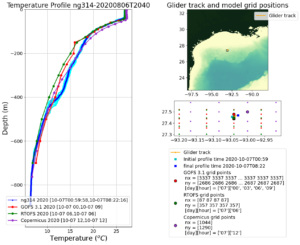
Posted on October 7th, 2020 No commentsWith multiple gliders in place, lets take a look at how the global models are doing with the data. We’ll focus on the two Navy gliders on the right hand side of the forecast track. NG645 is more south, almost central Gulf, and ng314 is further north, still in deepwater, but closer to any freshwater sources.
First the two temperature profiles. First is glider 645, near perfect agreement between the glider profiles in blue and the global ocean models – GOFS, RTOFS and Copernicus. For glider 314, we see a small difference between the temperature profiles in the 200m – 400m depth range. The data and the European Copernicus keep the warmer water deeper than the two US models. The upper ocean in all three look the same.
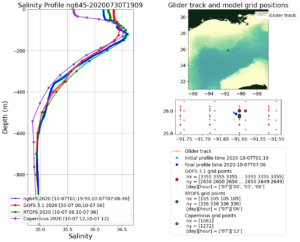
Now we check the salinity for the barrier layers. The southern glider 645 has lower surface salinity than at depth, but not a strong barrier layer like the European Copernicus. Both US models are close to the glider data at ng645. But look what happens to the salinity field closer to the freshwater at ng314. Here the Navy glider says there is a fresh barrier layer, and the Copernicus data assimilation is doing a good job of following this glider profile, both in the barrier layer and below. The US models are missing the barrier layer at 314, and are having trouble matching the salinity throughout the upper 400 m.
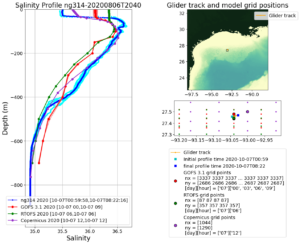
The conclusion for our winter lookback is to look more closely at the salinity structure. The previous blog posted noted the barrier layers based on the models were close to shore. Here Navy glider 314 says the barrier layer extends farther offshore than the models are showing us.
Last 5 posts by Scott Glenn
- Early Season in the Mid Atlantic - June 17th, 2021
- Disturbance in the Gulf - June 16th, 2021
- Hurricane Gliders 2021 - May 3rd, 2021
- Hurricane Iota - November 16th, 2020
- Hurricane Eta - Low Wind Shear, High SST - November 2nd, 2020
