


-
Understanding penguin and whale behavior using GPS tags
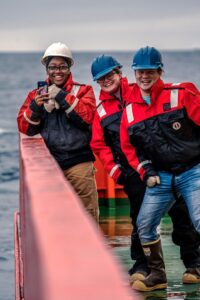
Posted on December 20th, 2021 No commentsAuthors: Megan Cimino, Ross Nichols, Megan Roberts, Darren Roberts
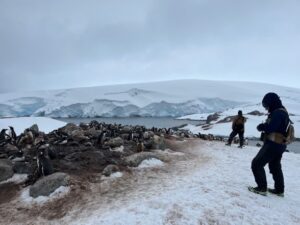
When we are not surveying from the large research vessel, we conduct our research from small boats (“zodiacs”) to either find whales or take us to islands with penguin breeding colonies. One of our main goals is to understand the foraging behavior of whales and penguin – where they go to find food, how deep they have to dive and how much time and effort they spend foraging. To do this, we use high-tech tags to measure time, depth and location, and some tags can even record video or measure ocean conditions like temperature.
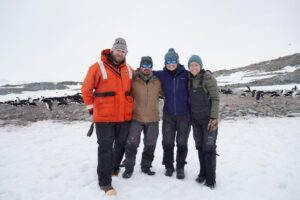
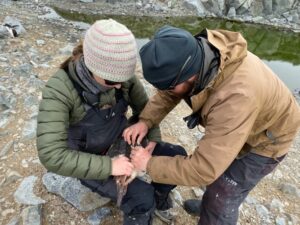
From left to right: Ross Nichols, Darren Roberts, Megan Roberts, Megan Cimino
The process for tagging a whale and a penguin is very different but in both cases the tag is relatively small compared to the animal’s body size and so it causes little disturbance to the animal.
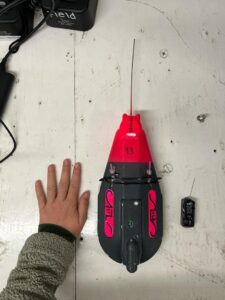
A comparison of tag sizes in relation to a human hand
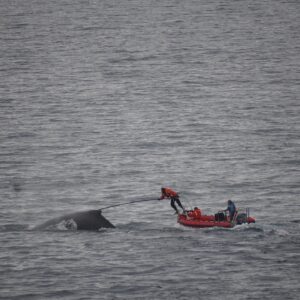
Whales, despite being a mammal, have bodies that are mostly hairless and lack small appendages where a tag could be secured. Instead, we use suction cups to attach our tags to their smooth bodies which can stay on their bodies for more than a full day. To attach the tag, we stand at the front of a small boat on a specialized platform called a “pulpit”. From the pulpit we hold a very long pole with the tag clipped into the far end. As we approach a whale in the small boat, we stick the tag onto the animal’s back, holding the tag onto the animal’s body through suction. The tag then records the movement of the animal, the dive depths, as well as recording audio and video.
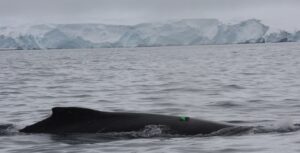
After losing suction over time while on the whale, the tag eventually loosens and releases on its own, floating to the surface. The tag then sends us a GPS ping where we can go to recover the tag and download the data! This data is very exciting because we can view the video of the animal and their environment and see how that relates to their behavior.
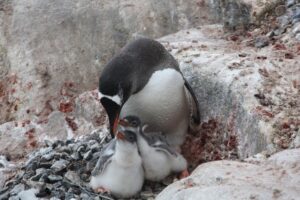
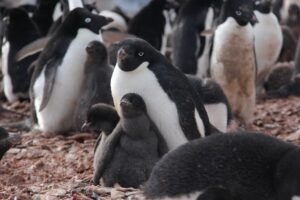
To tag a penguin, you first need to choose and capture an adult that has 1 or 2 chicks so that you can make sure the adult will return to the nest and you can get the tag back from the penguin in the same place where you found it. The tag is then attached to the penguins back with tape and zip ties. In a few days, we return to the penguin’s nest to remove the tag, and are then able to download the data! We are always excited to see where the penguin went (usually within 10 km of its colony) and how deep it dove (usually 20-50 meters).
-
Understanding seabird and whale distributions and populations from a big boat
Posted on December 15th, 2021 No commentsMegan Cimino, Ross Nichols, Megan Roberts, Darren Roberts
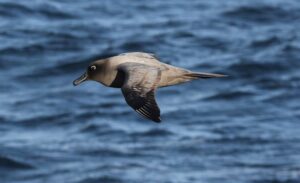
During this research cruise, the whale and seabird teams mainly spend the day on the ship’s bridge recording all seabird, seal and whale species. Because we are in Antarctica during the spring, there are very few hours of darkness, roughly midnight to 3 am. Therefore, the seabird team members – Megan and Megan – work in shifts, one person working in the early morning to midday and one member working midday to midnight. We have seen a variety of seabirds ranging from large albatross (the size of a small dog) to tiny storm petrels (the size of a hamster).

When the ship is near important penguin breeding colonies, the seabird researchers take a small boat to shore to count the number of nesting penguins to understand how their populations change over time in response to environmental conditions. A few days ago, team counted nearly 10,000 penguins in 7 hours using hand clickers, which required hiking over 6 miles in snowy and windy conditions. At this time of year, the penguins are beginning to lay and incubate their eggs that will hatch in late December.
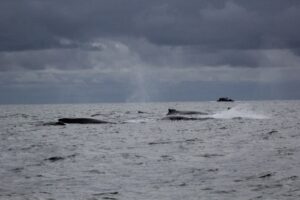
When a feeding and slow-moving group of whales are spotted from the ship, this provides an opportunity for the whale researchers – Ross and Darren – to go out in a small zodiac boat to take pictures and other biological samples. Pictures of whale flukes allow scientists to identify individual whales because their fluke is similar to a human’s fingerprint- everyone is unique! This allows us to estimate individual animal movements and population size. Small samples of the animal’s blubber can be used to determine if a whale is male or female, and can also identify if a female is pregnant. By monitoring the ratio of males to females and the rates of pregnancy, we can assess the health and growth of whale populations.
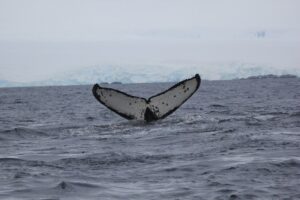
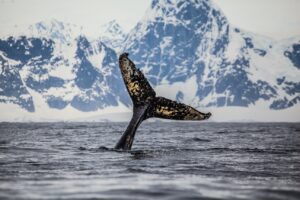
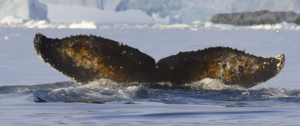
Identify a Whale! Can you tell these whale flukes apart?
These observations and samples are important because seabirds, seals, and whales are the major predators in Antarctica. These indicator species can tell us a lot about the health of the ocean’s ecosystem. It is difficult to know how many fish and krill are in the Southern Ocean but we can learn a lot by studying the health of larger animals that feed on them. Changes in the health of the animals or changes in species observed can tell us how the ecosystem is changing, especially in the context of climate change. As temperatures are warming rapidly in this polar region, it is very important to understand how these animals are responding to these changes to learn more about the overall health of our oceans.
-
RUCOOL Updates: October-November 2021
Posted on December 15th, 2021 No commentsAnd just like that, we are approaching the end of 2021. It was good to see students back in the classroom and labs, on beaches and boats, and even traveling south for summer research in Antarctica.
State
- Our 3rd cohort Masters of Operational Oceanography students have almost completed their first semester, which actually started in early August with software and glider training. This fall, in addition to classes and lab work, they have been on glider deployments and recoveries as well as HF-Radar site visits.
- The NJDEP Commissioner, Shawn LaTourette, along with Bob Schuster and Megan Brunatti visited COOL in October. Discussions focused on offshore wind development, climate resilience and improving coastal water quality. Shawn posted a video of his visit.
- The New Jersey Board of Public Utilities (NJBPU) and the New Jersey Department of Environmental Protection (NJDEP) visited RUCOOL in November. The attendees are active in the state’s development of 7.5 GW of offshore wind, as part of its goal to have 100% clean energy by 2050. Several representatives from each agency participated on a career panel with students in the Topics of Marine Sciences class, discussing their diverse career paths that led to their current positions with the state, and the myriad ways that today’s students might play a role in New Jersey’s blue economy.
- Grace Saba organized and hosted a virtual workshop on November 19th focused on Developing a New Jersey Statewide Ocean Acidification Monitoring Network.
- The R/V Rutgers engine issue was fixed by Captain Chip Haldeman. We expect the R/V Rutgers to head to Tuckerton for winter glider deployments and recovery support for Orsted and other projects.
- Our glider team continued a very busy fall in Oct/Nov supporting 11 deployments from the Gulf of Maine to the Jersey coast all the way down to the Caribbean. These gliders swam over 5400 kilometers and supported grants from NOAA, NSF, Orsted, NJDEP and the Vetelsen Foundation. It will be a busy winter of data analysis.
- The COOLroom and glider lab were once again open for visits and tours this fall, beginning in late October. Over 40 visitors from NJDEP, NJBPU, Bermuda, Chile, the NJ Wind Institute and Rutgers Open House toured COOL
- RUCOOL welcomed back Dean Robert Goodman to the COOLroom for a ceremony adding a plaque in his name to our RUCOOL Wall of Fame. The plaque states “For acting on his vision of new academic paradigms, empowering generations of ocean explorers to build and apply ocean observing networks that advance our science and support a global community embarking on a new blue economy.”
National
- Scott Glenn completed an active year co-leading the NOAA Science Advisory Board (SAB) efforts to meet its commitments to the U.S. Congress. Scott Glenn (academic oceanographer) and Brad Colman (industry meteorologist) co-chair the SAB’s Environmental Information Services Working Group (EISWG) and the SAB’s decadal Priorities for Weather Research (PWR) study. The PWR report, now approved by the full SAB and forwarded to the NOAA Administrator for submission to Congress, was a year-long study involving over 150 subject matter experts to define Federal investment priorities in weather research and forecasting. The PWR report identifies 11 priority areas, 33 high-level recommendations and 102 critical actions for investment that, taken together, will transform U.S. Earth System forecasting and promote a more Weather Ready Nation that includes historically underserved and socially vulnerable communities. The PWR report is now being used to help inform the largest increase in NOAA’s budget since its formation over 50 years ago. The EISWG’s 2021 annual Report to Congress (RtC) on NOAA progress implementing The Weather Research and Forecasting Innovation Act of 2017 (“The Weather Act”) was approved by the SAB and forwarded to the NOAA Administrator for submission to Congress. The RtC includes the EISWG review of the NOAA Hurricane Forecast Improvement Program (HFIP) led by Scott Glenn.
- The hurricane season came to a conclusion at the end of November. Through NOAA funding, our team was involved with numerous glider deployments and a US team measuring the impacts of the storms on the ocean and vice versa throughout not only the mid Atlantic, but the southeast coast, Gulf of Mexico and Caribbean as well. Our HF-Radar team tracked the eye of Ida off NJ and Long Island, showing the National Weather Service’s estimated eye track was a few miles east of the true storm center. It will be a long winter of data analysis as we work to improve hurricane forecast intensity models.
- RUCOOL Post-doc Jessica Valenti presented her research “Microplastics in the Marine Food Web: Insights from a Larval Fish Collection” at the Coastal and Estuarine Research Federation virtual meeting (oral presentation) and the American Fisheries Society meeting in Baltimore, MD (poster).
- PhD student Emily Slesinger gave an oral presentation titled “Interaction between shifting fish distributions and migration distances on reproduction: a case study with black sea bass” at the American Fisheries Society meeting in Baltimore, MD.
- The RUCOOL Education Team received $750,000 from NSF to develop online tools to help university researchers connect their research with society. Their new toolkit will support scientists, engineers and other researchers in planning and developing education and outreach projects that support and explain their work.
- Oscar Schofield reappointed to the Federal Advisory Committee overseeing the US Integrated Ocean Observing System
International
- Oscar Schofield Chaired a National Academy of Sciences and Medicine Study entitled “Mid-Course Assessment of NSF progress on 2015 Strategic Vision for Antarctic and Southern Ocean Research”.
- Rutgers has been participating in the NSF’s Long-Term Ecological Research (LTER) project at Palmer Station Antarctica for over 30 years. Graduate students Quintin Diou-Cass and Joe Gradone boarded the R/V Nathaniel Palmer to head to the West Antarctic Peninsula. We wish them all well for their summer Southern Ocean exploration.
Newly Funded Research
- University of Delaware through NOAA IOOS, “Mid Atlantic Regional Association Coastal Ocean Observing System,” Schofield & Crowley ($1,108,577, 1 year). First of two parts.
- State of NJ Department of Environmental Protection, “Glider deployments for water quality monitoring,” Kohut ($84,464, 1 year).
- CODAR Ocean Sensors, “Wind Turbine Interference Mitigation Data Backfill,” Roarty ($24,885, 1 year).
- National Science Foundation, “Implementation and Evaluation of the ARIS Broader Impacts Toolkit,” McDonnell ($749,866, 3 years).
- Rider University through the National Science Foundation, “Improving Undergraduate Scientific Explanations: Exploring the Role of Data Literacy Skills in Scientific Reasoning,” Lichtenwalner ($19,099 for 1 year).
Papers Published: (**Current or Former Graduate Student or Postdoctoral Researchers)
- Miles, T., S. Murphy, J. Kohut, S. Borsetti, and D. Munroe (2021), Offshore wind energy and the mid-atlantic cold pool: A review of potential interactions, Mar. Technol. Soc. J., 55(4), 72–87, DOI:10.4031/MTSJ.55.4.8
- Schofield, O. (Chair), Barger, A., Brunt, K., Clauer, R., Das, I., Detrich, W., Gooseff, M., Halanych, K., Halpern, M., Murray, A., Rignot, E., Shevenell, A., Takai, H., Wilson, T., Wolff, E. National Academies of Sciences, Engineering, and Medicine. 2021. Mid-Term Assessment of Progress on the 2015 Strategic Vision for Antarctic and Southern Ocean Research. Washington, DC: The National Academies Press. DOI: 10.17226/26338
- Roarty, H. (2022), Measuring Currents with High Frequency Radar, Eldridge Tide and Pilot Book, 2022
Public Media
- RUCOOL’s Travis Miles and DMCS’ Daphne Munroe were interviewed by WHYY for an article entitled “Jersey Shore’s fishing industry wonders: Can it coexist with planned massive wind farms?”
RUCOOL Meetings & Conferences
RUCOOL continues to lead/attend numerous virtual meetings. Here are some meetings which our team attended and/or presented: MARACOOS Board Meeting, Coastal and Estuarine Research Federation Meeting, American Fisheries Society Meeting, Supporting OA Action Planning and Implementation in the Mid-Atlantic Workshop, Integrated Ocean Observing System Annual Meeting, Hudson River Foundation Continuous Monitoring Practitioner Meeting, Underwater Glider International User Group Meeting, Cakefest PHP Meeting, NJ EDA Wind Institute Meeting.
-
Zoop Soup!
Posted on December 14th, 2021 No commentsRUCOOL is working with the Virginia Inst of Marine Sciences on our National Science Foundation (NSF) Long Term Ecosystem Research (LTER) project in Antarctica.
Who: The zooplankton team/members of Virginia Institute of Marine Science’s Steinberg lab
What: The zooplankton team has begun to conduct MOCNESS tows
When: December 2, 2021
Where: The more southern part of ocean next to the Western Antarctic Peninsula
Why: We perform MOCNESS tows to collect zooplankton from different depths. This lets us see how animals change as depth changes!
Finally!! We were able to put the “MOCNESS” in the water! “MOCNESS” is not a sea monster! It stands for “Multiple Opening Closing Net and Environmental Sensing System.” It’s not as complicated as it sounds. It is basically nine nets in one. We send all the nets down at once and then slowly bring the net up. As it comes up, we open one net, collect the animals that are there, and then close the net. Then we open the next net and repeat the process. This lets us see what animals live at different depths. The MOCNESS collects animals as deep as 1000m and as shallow as 50m!
Now what are these animals we are collecting? They are “zooplankton”! “Zooplankton” are any animal that cannot swim against the ocean currents. This can describe jellyfish, krill (shrimp-like animals), or larval (young) animals like crab and lobster. Zooplankton are everywhere and can come in all different shapes and sizes! In Antarctica the most common animals we catch are krill, copepods (think plankton from Spongebob!), chaetognaths (worms), and pteropods (snails). These animals are typically found shallow in the water column, so we can catch them in our simpler “Metro nets.” Metro nets are single nets that stay open all the time. We send them down to shallower depths and they collect the zooplankton they encounter.
So, now you know why the MOCNESS tows are special – we get to go deeper and we know where the animal came from! Another bonus is that we see animals that would never show up in our simpler nets because they live in deeper waters. For example, in our MOCNESS tows we may see a lot of red and black amphipods (bugs), big jellyfish, and sea spiders!
After we conduct Metro tows or a MOCNESS tow, we work as a team to identify, count, and measure the volume of every animal. We may also conduct experiments on the live animals!. One is a “fecal pellet production experiment” – essentially watching and waiting for the animals to poop! We place the animal in a bucket full of seawater, leave it for a few hours, and then collect its poop. We want to learn more about the carbon and nitrogen that goes to the bottom of the ocean when these animals poop! Our other experiment involves larval (or young) fishes. In this experiment we want to measure their “thermal tolerance,” or what is the hottest temperature they can survive at. The fishes in these experiments are typically not found in other parts of the world!
About the Authors: Maya Thomas and Tor Mowatt-Larssen are graduate students at the Virginia Institute of Marine Science and Meredith Nolan is a senior at the College of William & Mary. This is all their first time to Antarctica!
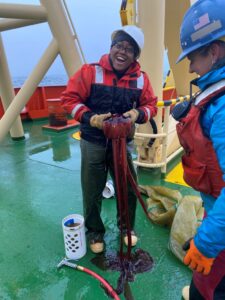
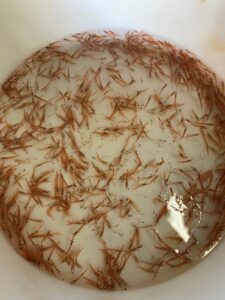
Images: a. The zooplankton team admiring the Antarctic scenery before a net tow. (Left to Right: Maya Thomas, Meredith Nolan, Tor Mowatt-Larssen). b. A Metro net coming out of the water with all the zooplankton that it has collected. c. Maya Thomas with a large jellyfish from a Metro tow. These are rare to find in our nets! d. An example of what a Metro net collects. The large, orange animals that look like shrimp are Antarctic krill!
-
Phytoplankton and water chemistry (chemistry can be and is fun!)
Posted on December 11th, 2021 No commentsWho: The most excellent Van Mooy group from the Woods Hole Oceanographic Institution – with friends and collaborators from three other institutions!
When: November 22nd to December 15th
Where: We take samples from the top of the ocean to the bottom, to look at how phytoplankton are changing the water they live in and being changed by it.
Why? While algae might seem tiny and like they are not as important as animals like whales, seals, or penguins, they are actually what cause many of the changes in the world’s oceans! Even more than that, they are the food all those bigger animals eat!
My team looks at the ways that phytoplankton, which are tiny algae (a lot like plants), grow in the ocean. They need sunlight, so they are concentrated in the surface. However, they also need food, or nutrients, which they can use up quickly when there is enough light. My lab looks at the balance between things like nutrients and light, to see how phytoplankton change when those factors change.
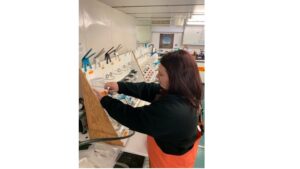
Putting bottles of seawater into the filter rigs. This is how we filter the water to find out how much phytoplankton and particulate organic carbon there is inside one to two liters of seawater.
Not only can a single algal cell change how it’s growing, but the types of cells often change as they each are fairly particular in what they like. Think of them as picky eaters – they don’t stick around when their favorite dish isn’t at the table, or there isn’t enough of it – because someone else has pushed them out! This is what we refer to as a “niche”.
My favorite thing about phytoplankton is that they are not only impacted by the water around them, but they also change that water, in a really beautiful circle. To understand how these tiny organisms function, you have to understand the chemistry of the water. And, you have to understand how they are changing that chemistry as they grow, live, and eventually die and sink, or are eaten. What happens to algae when they die is almost as important as how they live.
Together, phytoplankton and the water they live in make up an ecosystem all on their own, which is beautiful all by itself. Then, you can add in how they are food for animals like krill, which feed penguins, seals, and whales. But really, it all starts at the most microscopic levels, and my goal with this research in Antarctica is to understand how phytoplankton are changing as the chemistry of the oceans change, and then how that might make a difference to those larger animals too.
About the author: Shavonna Bent is a graduate student at Woods Hole Oceanographic Institution. This is her third research cruise.
-
Phytoplankton, Lords of The Sea!
Posted on December 8th, 2021 No commentsWednesday, December 1st
CURRENT PROGRESS: Happy Antarctica Day!
Hey everyone, Quintin here! I’m a biological oceanographer with the LTER (Long-Term Ecological Research) project here on the Nathaniel B. Palmer (NBP). It’s another day of exciting Antarctic scenery here looking through the portholes on the NBP, since a large storm is hitting the Western Antarctic Peninsula! While that gives us a lot of high winds and cool waves to look at, it also means we have to shut down science until the weather is safe enough to drop our instruments over the side. This is definitely unfortunate, but it gives us all a great chance to make plans for the rest of the expedition and process data!
So far we have made significant progress down the peninsula and have reached Adelaide Island, one of the major islands on the coast (and home to Rothera Station, an Antarctic research base owned by the British!). Now that we have come so far south and have completed nearly 60% of our expedition, we are making plans to do process studies at a couple locations along the coast. Unlike our previous sampling sights, we will stay at these process study locations for 2-3 days and sample every 12 hours or more! We do this so we can understand the differences in our respective focus areas (e.g., phytoplankton, bacteria, zooplankton, physics, etc.) over time and run experiments that require us to be in one location for an extended period. It should be an exciting time, and marks one of the final stretches of science before we start packing up and heading back to the US!
PHYTOPLANKTON: The Grass Of The Sea
For biological oceanographers, part of being out in the field on research trips like this one is to collect samples of the plants and animals that live in the ocean so we can gather data from them later. I and others in my lab are focused on collecting and studying the phytoplankton (microscopic plants) in the ocean, and that means lots of filtering water! Much like the grasses that cows graze on in farms or the grass in your front lawn, phytoplankton are essentially the grass of the sea. They are super tiny bits of plant, made up of a single cell, that are everywhere in the surface ocean. The only difference between the grass on your lawn and the algae (phytoplankton) in the ocean is that the algae are too small to see! Despite being so small, the phytoplankton are super important to the ecosystem, since they are the ones that harvest energy from the sun and make it available to all the larger critters like zooplankton that are eaten by whales, seals, and penguins. Because the phytoplankton are so important, we want to understand how much there is, how they grow over time, and what different kinds of phytoplankton exist in the water. This information can tell us a lot about the base of the food web and how we might expect it to change over time to impact all of the larger critters that thrive in the unique Antarctic areas!
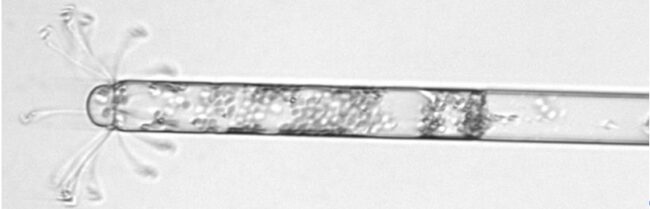
A picture of a diatom taken by a special camera called an Imaging Flow CytoBot. Diatoms are a type of phytoplankton that live all over the world, and there are many diatoms in the Southern Ocean near Antarctica.
About the author: Quintin Diou-Cass is a graduate student at Rutgers University. This is his fifth research cruise.
-
Let the science begin!!!
Posted on December 8th, 2021 No commentsWhat: Science on the research vessel Nathaniel B. Palmer has begun!
When: November 20 to November 22, 2021
Where: The ocean along the coast on the west side of the Antarctic Peninsula. The Antarctic Peninsula is the part of Antarctica that sticks up like a finger toward the southern tip of South America.
Why? We want to know what is going on with the ice, plants, and animals, and whether the conditions are changing from year to year.
Good morning from the research vessel Nathaniel B. Palmer in the waters west of the Antarctic Peninsula. I am happy to report that we have started doing science!
Our first order of business was to drop off a field camp on an island. A group of seven scientists will live there for a month. Their main job is to walk around the island every day counting and observing all the seabirds and seals. Their camp is a few small wooden buildings up on a snowy hill. To get there, they had to make many trips back and forth from the ship to the island in small inflatable motorboats called “zodiacs.” One trip would be for people, then the next trip would be for a load of gear… and repeat! To get on the boast, people had to descend from the high edge of the ship into the small boat down in the water many feet below. They climbed down a rope ladder and dropped into the small boat one by one. We are thinking of our friends at the field camp and we hope they are doing well. We will pick them up after the end of our research cruise on our way back to port in South America.
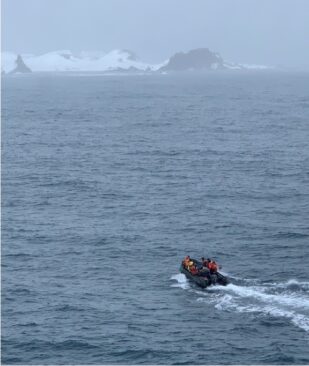
A small boat called a “zodiac” drives out to drop off seal and seabird researchers at Cape Shirreff on Livingston Island, one of the South Shetland Islands.
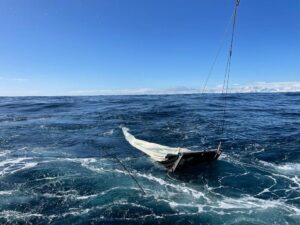
After dropping off the field camp, we started sampling the water! Now that we have started sampling, each day when we go down to the labs, we ask, “When is the next CTD?” What we mean is, “When is the next time we are sending our big frame of bottles down into the ocean to get water?” The term “CTD” stands for Conductivity, Temperature, and Depth. Conductivity is a measure of the ocean’s salinity. The CTD is a small machine at the bottom of our big white frame we send into the water. The big white frame is called a “rosette” because it is a circle of bottles, or the “CTD-rosette.” Each bottle is open at both ends when it goes down through the water. Then, on the way back up, we sit at a computer that connects to the CTD-rosette and tell it when to close the bottles at lots of different depths below the surface. When we want to close a bottle underwater, we click a button on the computer that says “Fire!”
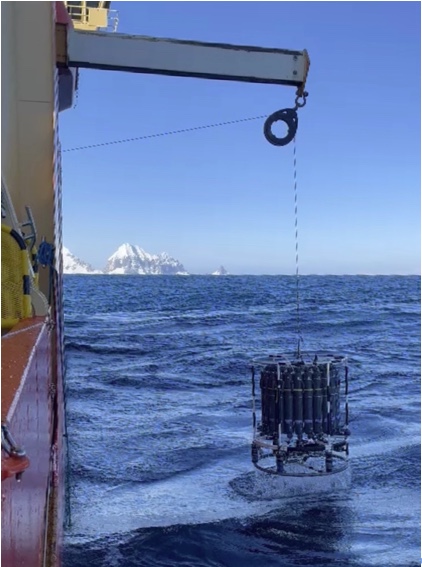
The CTD-rosette going into the water at the first place where we did our science sampling.
After our first few stations, we are steaming south. We have passed 64 degrees south latitude, which means the days are getting long. The sun comes up at about 3:00 AM and sets at about 11:00 PM, but it never fully gets dark. Instead, it looks like sunset and sunrise are one long time of day, where the sky looks like it does at dusk and dawn in the United States.
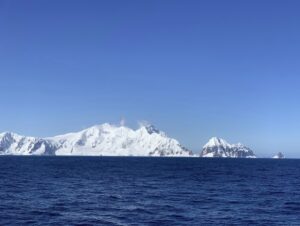
A view of the snowy mountains surrounding Bransfield Strait, the first place where we did our science sampling.
About the author: Jessie Turner is a postdoc (researcher) at the University of Connecticut. This is her fourth big research cruise.
