-
Tidal Analysis 3
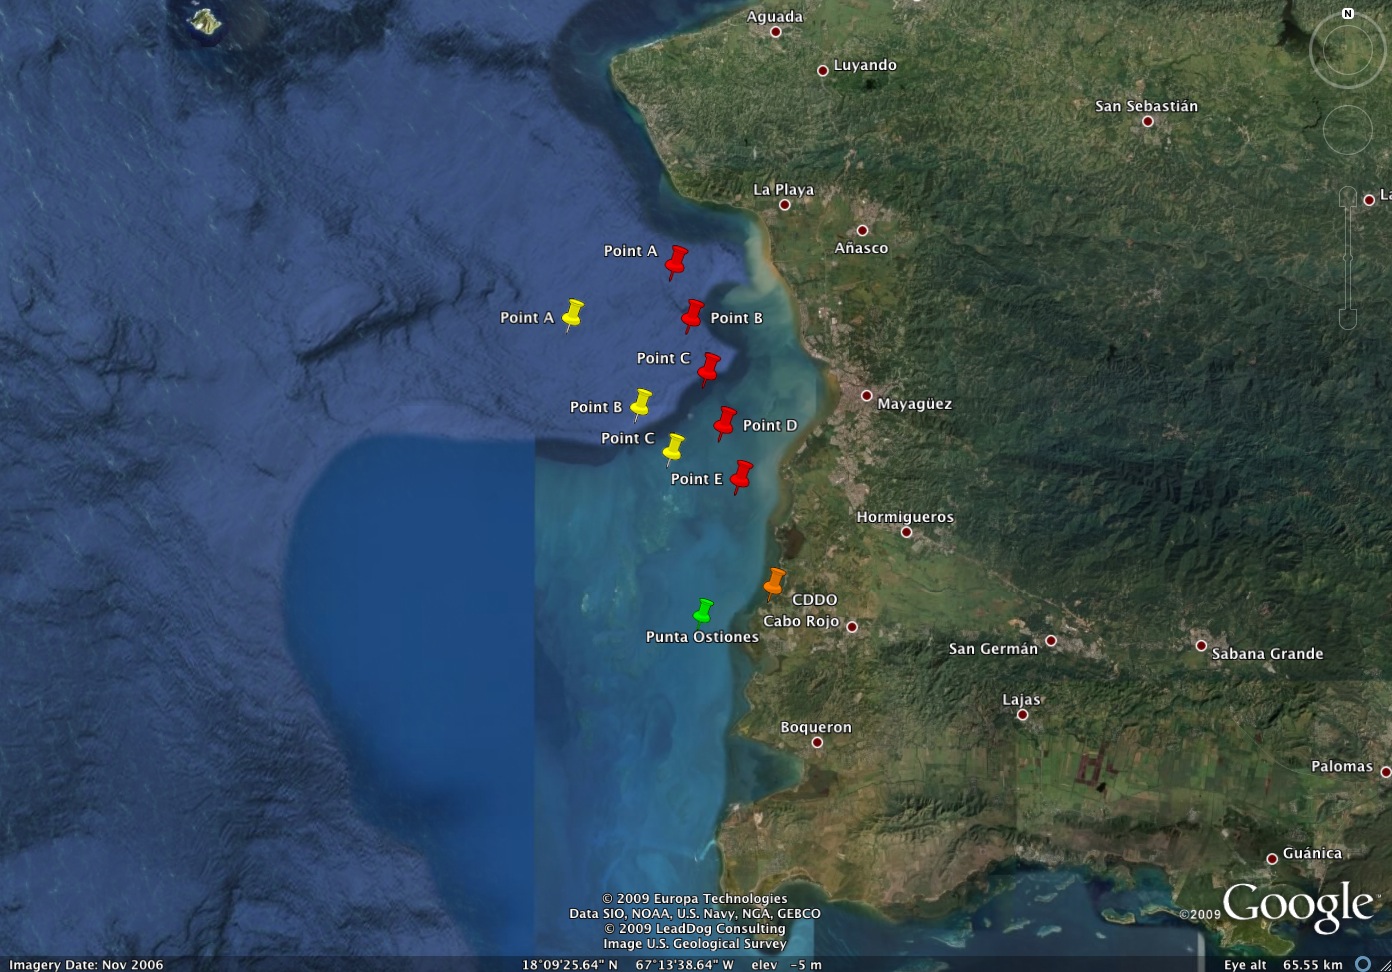
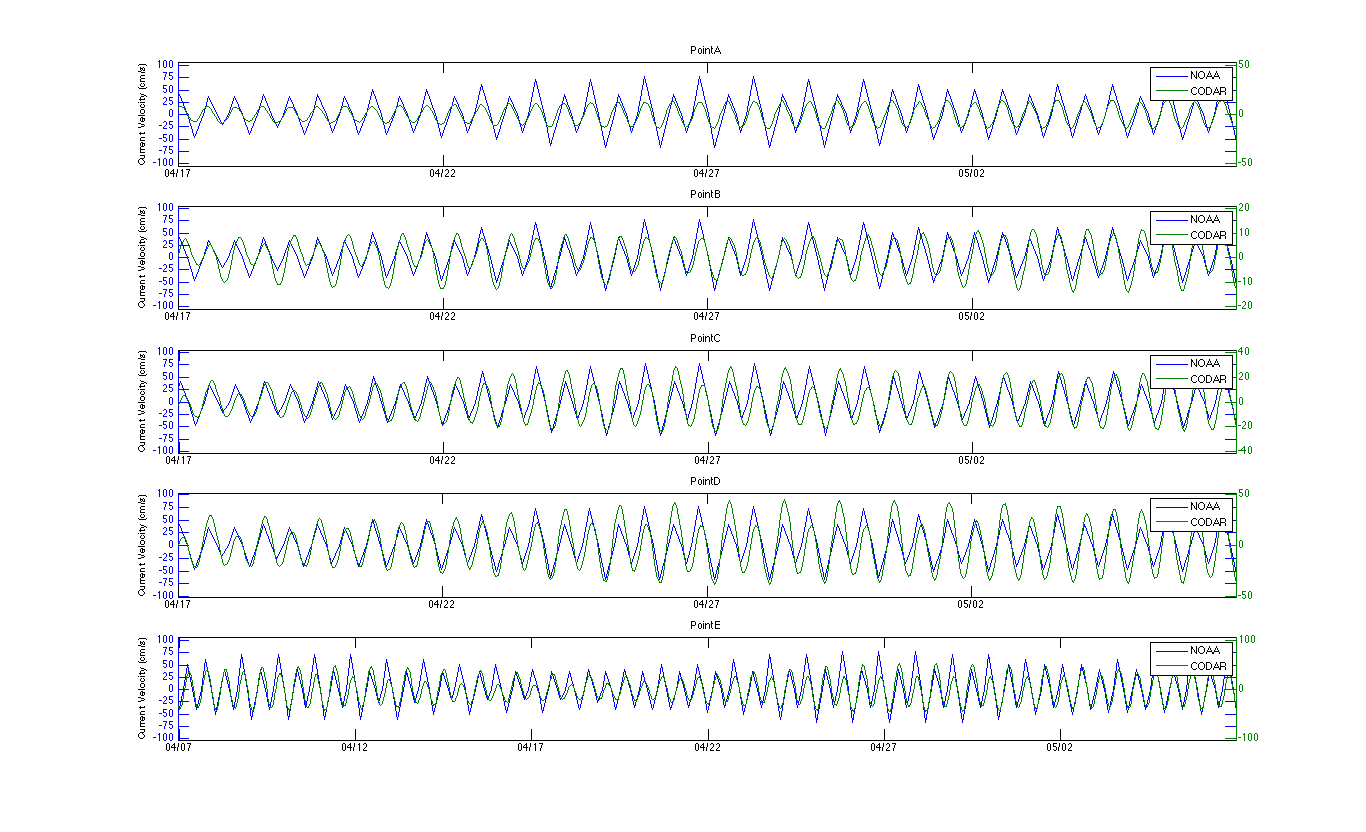
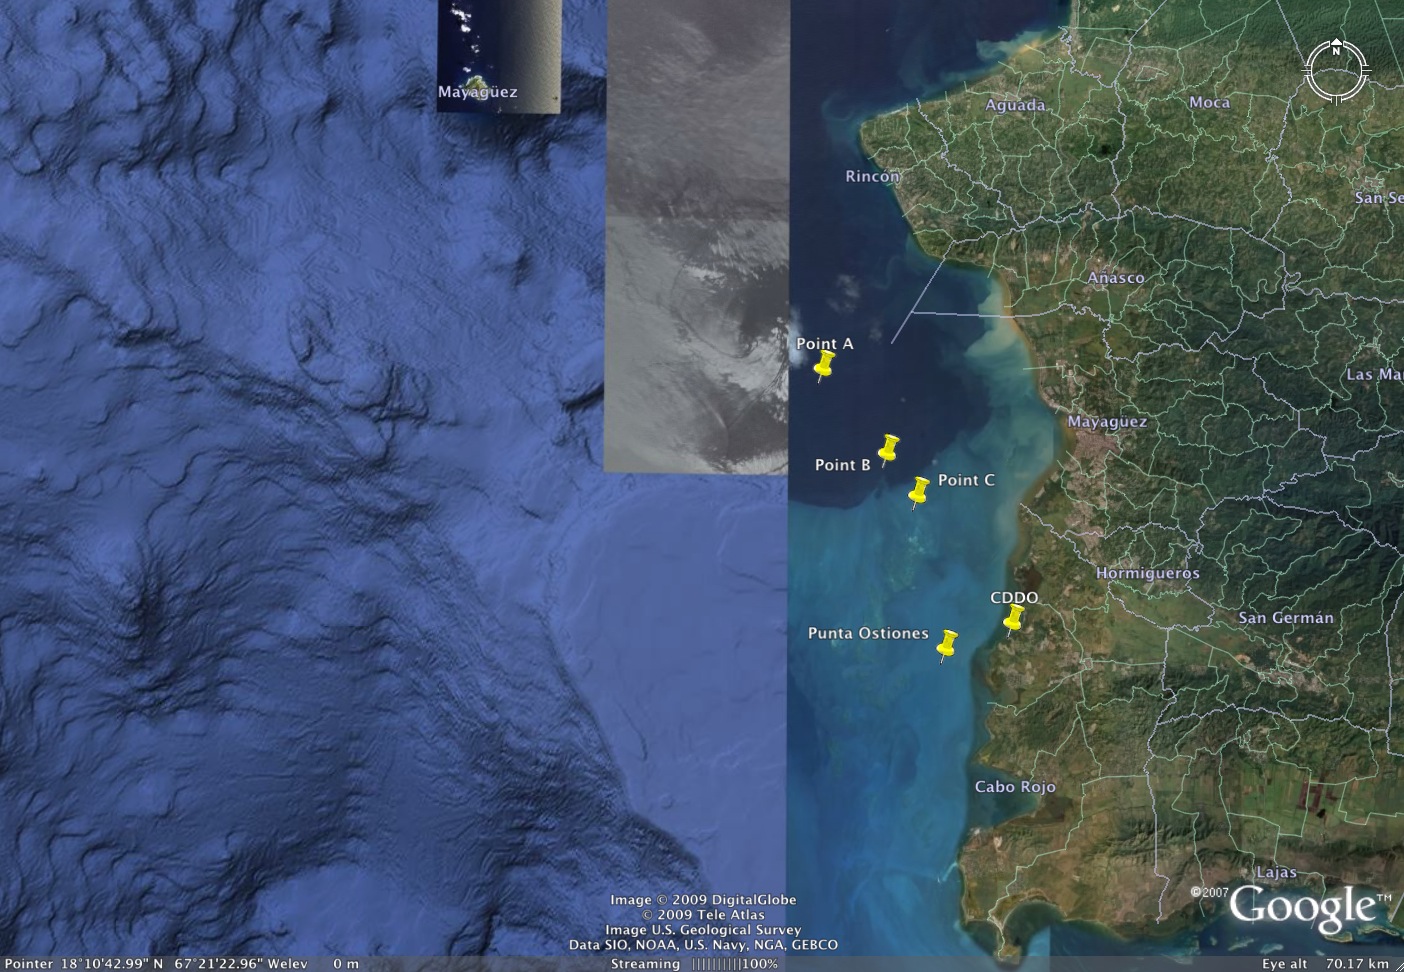
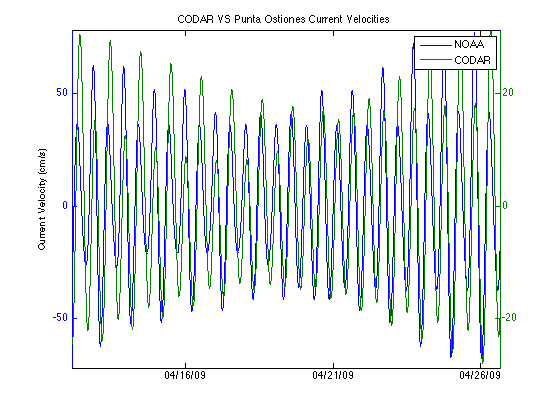
Posted on July 21st, 2009 No commentsTidal Analysis 3 compares NOAA current velocity predictions at Punta Ostiones with CODAR V component current velocity readings at 5 points oriented 343º from the station. Figure 1 shows five red placemarks labeled Point A through E, each one 3km or a range cell apart. Point A is located on range cell 6 while Point E is located on range cell 2. Yellow placemarks indicate the three points selected for Tidal Analysis 2.
Root mean square (RMS) speed differences between CODAR observations and NOAA predictions range from 28.7–8.4 cm/s. They improve significantly as we evaluate points closer to the CDDO station (e.g. At Point C an RMS speed difference of 21.1cm/s is found, at Point D the difference is 13.2 cm/s, and at Point E 8.4 cm/s). It is possible that bathymetry might be contributing substantially to this contrast. Correlation coefficients are highest at point A with a value of 0.8890. Other correlation coefficients range between 0.5385 and 0.6138.
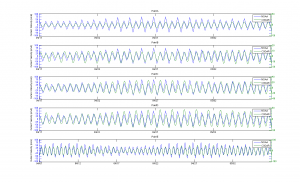
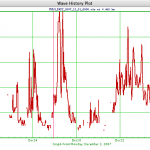
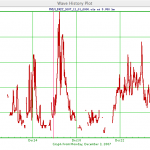
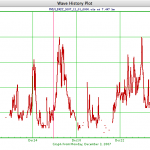
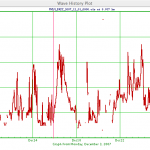
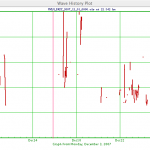
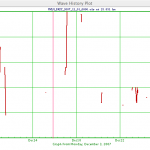
Figure 2 compares the graphical output of NOAA current velocity predictions at Punta Ostiones with CODAR observed current velocity at selected points.
Figure 1
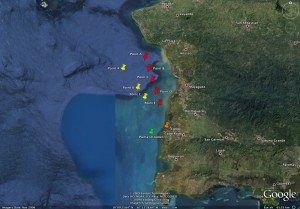
Figure 2
-
Outlines for posters
Posted on July 21st, 2009 No comments
Sam’s Outline

Andre’s Outline
-
Inland Data in the CDDO site
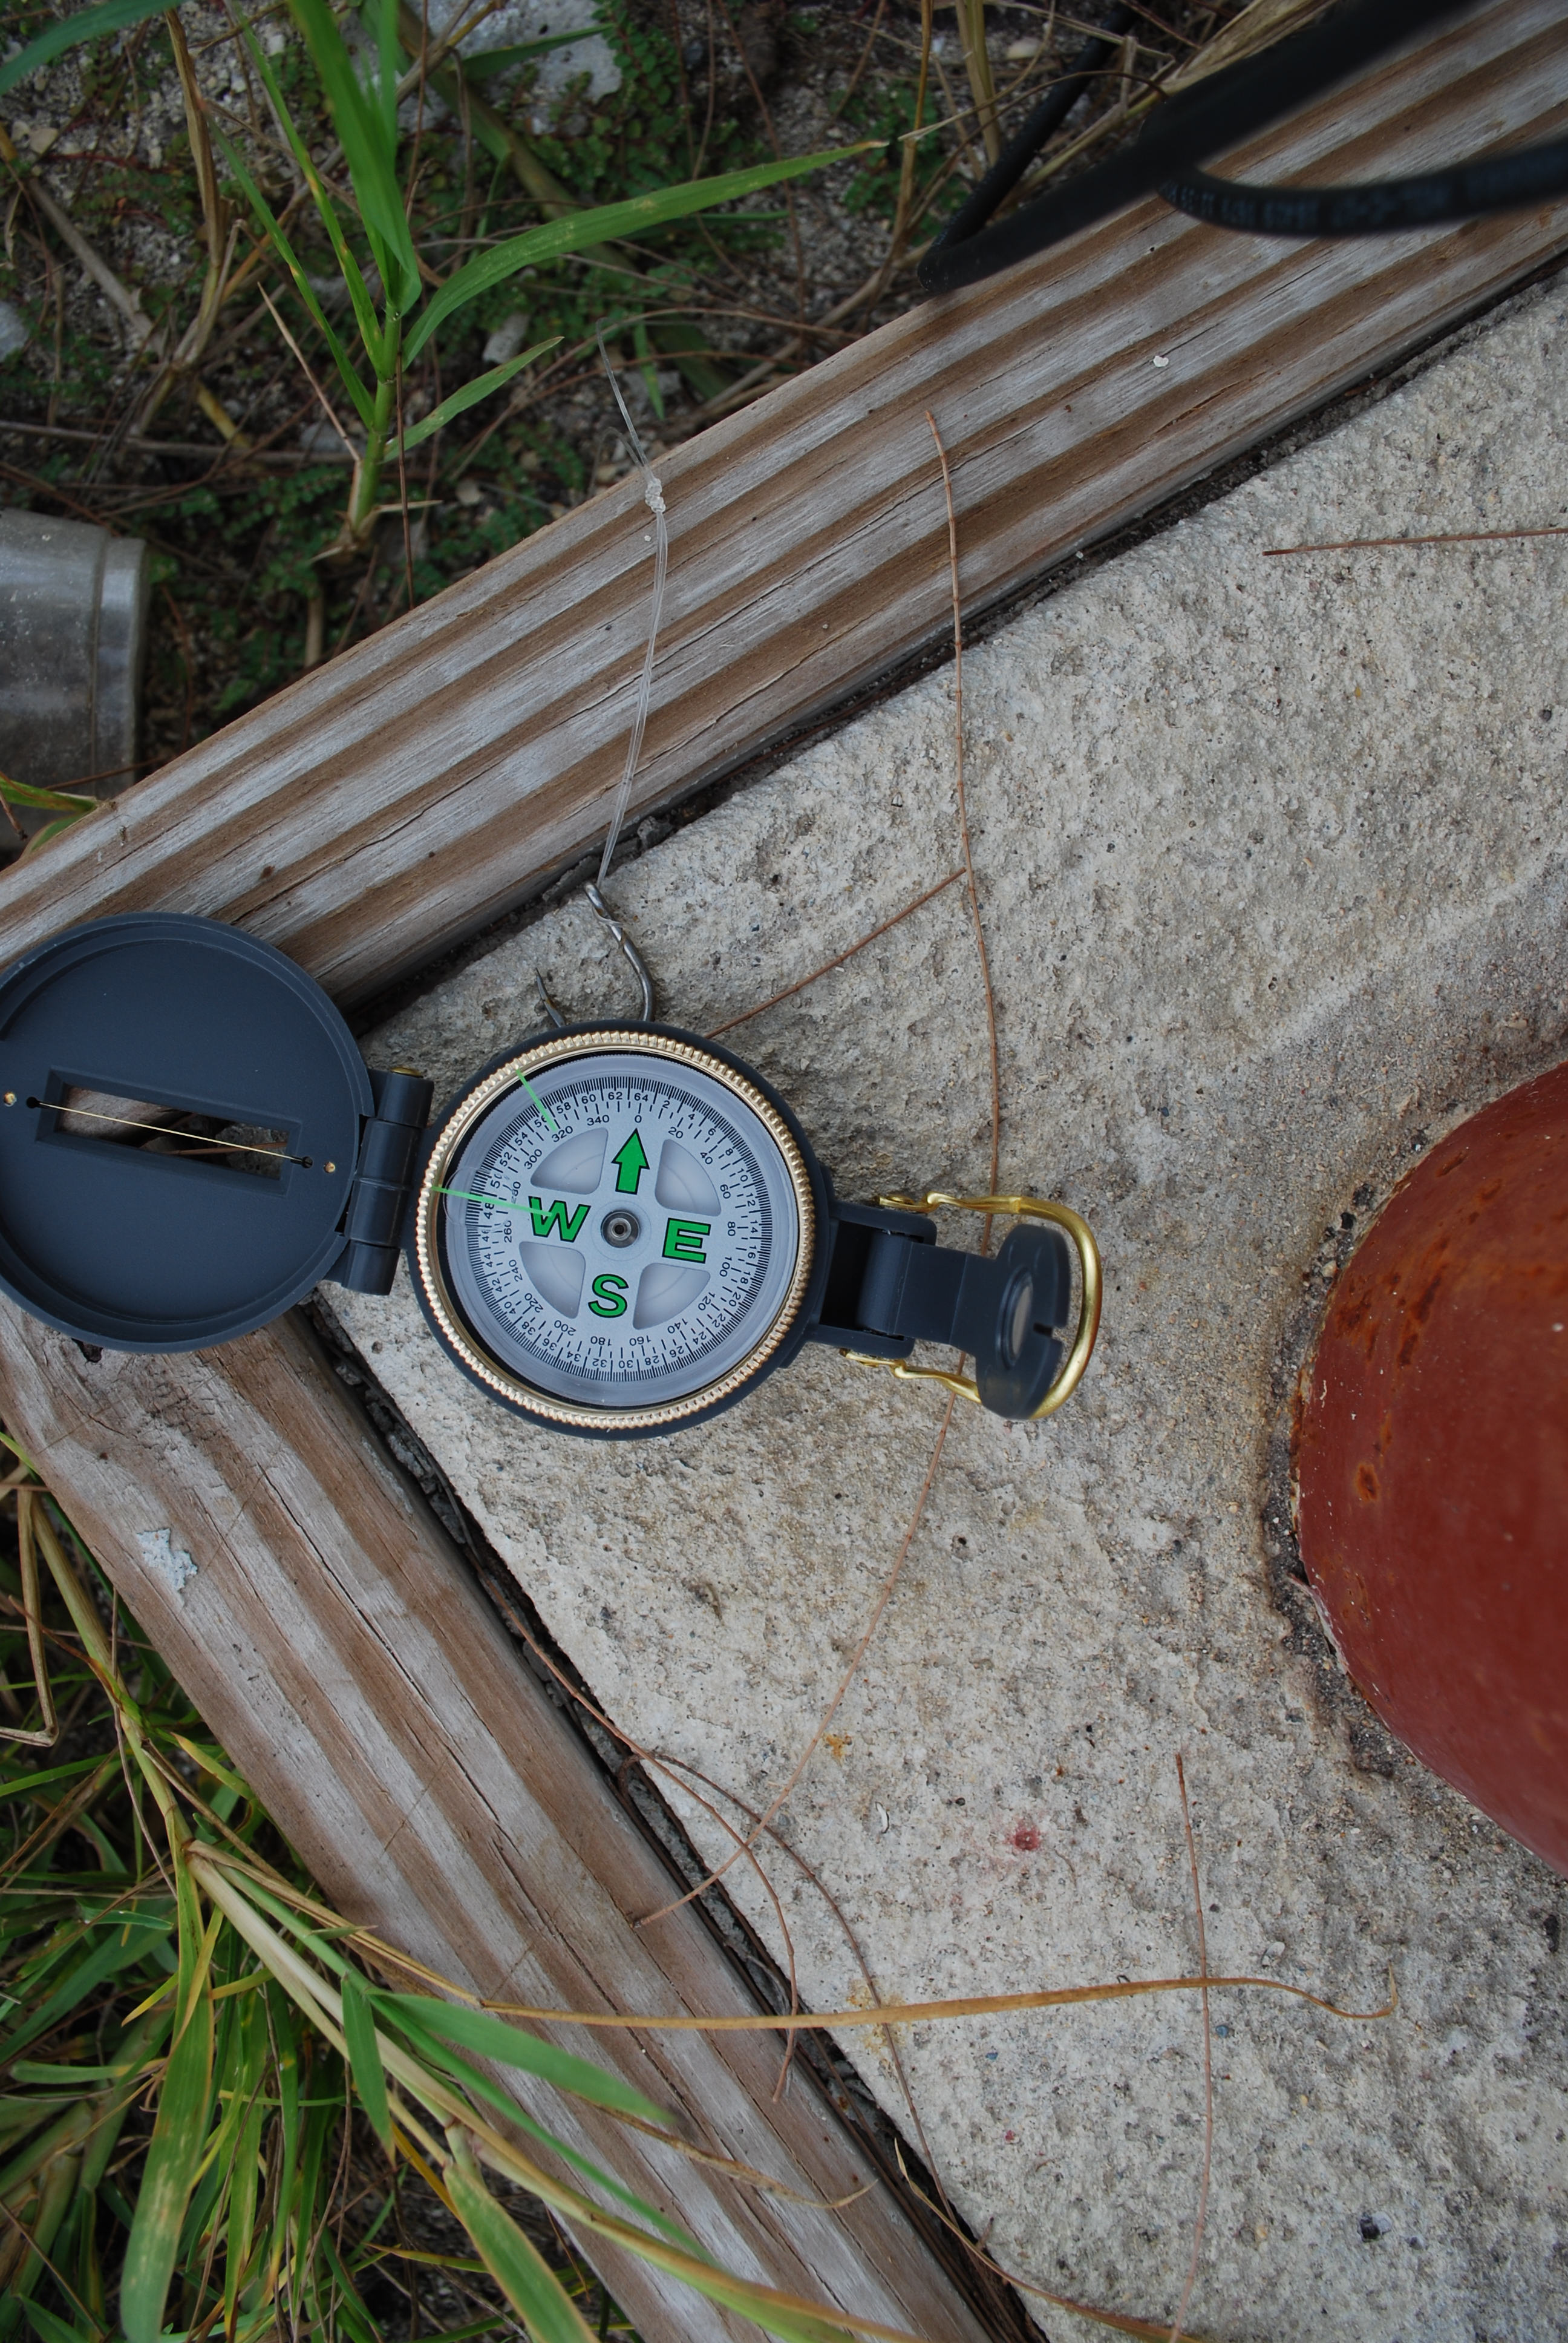
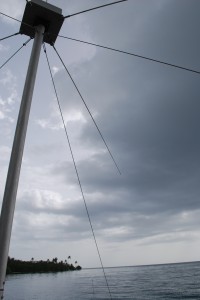
Posted on July 17th, 2009 No commentsCDDO site in Puerto Rico has been experiencing serious difficulties. As it can be seen on the picture below, the HF radar is gathering a great deal of inland data. This kind of data inhibits the effective mapping of currents, since SeaSonde software displays it as real affecting the product’s credibility and quality. This kind of problem prevents the system from being used as a rescue and emergency response tool. To try to solve this problem Damian Ruiz was contacted and asked to verify the bearing of the receiving antenna along with the connection of the cables. To our surprise everything seemed to be normal. In the photos it can be appreciated that the arrow for loop 1 is looking straight into the ocean as it’s suppose to be. Since everything appeared to be in order, our last resource is the antenna pattern measurement. This process requires experience as well as special instrumentation.
One hypothesis is that the signal is being amplified towards land by different communications devices in the marina. The other theory is that the southwestern part of the radar isn’t gathering any data because there might be something interfering with the signal such as metal towers, electrical cables, light poles, etc.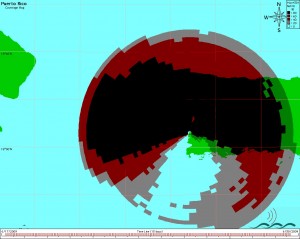

-
Correlation Between NOAA Predicted Currents and CODAR Observed Currents
Posted on July 17th, 2009 No commentsAn effective correlation can only be carried out in Matlab if both data sets have the same length (same amount of data points), therefore both time series – NOAA predicted currents at Punta Ostiones and CODAR observed currents – were subjected to the Fast Fourier Transform method and subsequently interpolated at 1-minute intervals. Then data was analyzed and plotted within the same period of time – April 1, 2009 to May 31, 2009. Correlation was performed using corrcoef function, which yielded a value of 0.69. It is worth noting that the algorithm is now set to calculate M2, S2, N2, K2, K1, O1, P1, Q1 tidal constituents as advised by Dr. Jorge Capella.
-
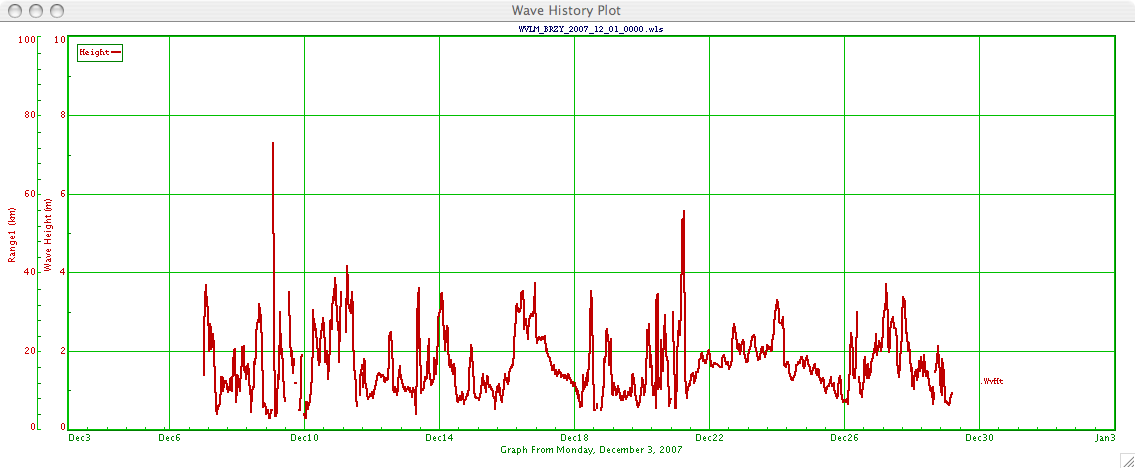
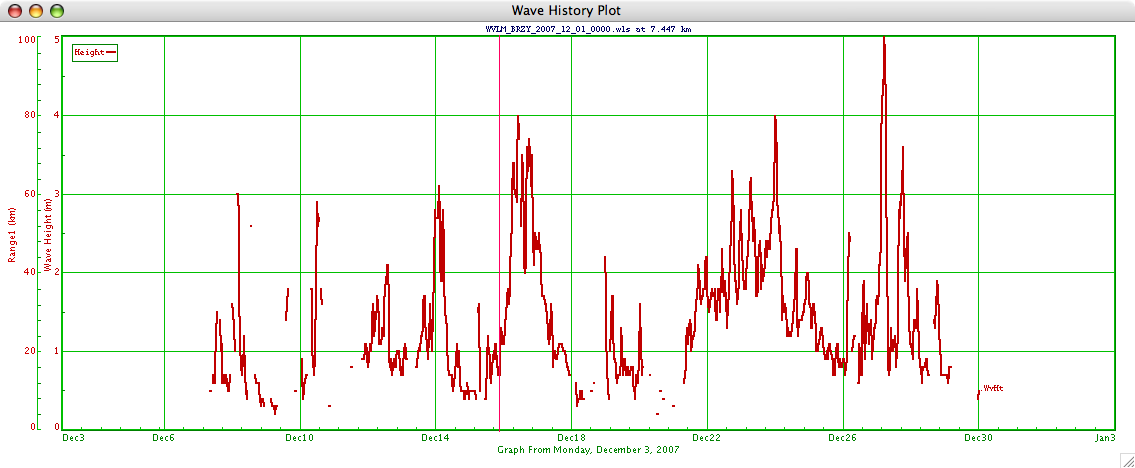
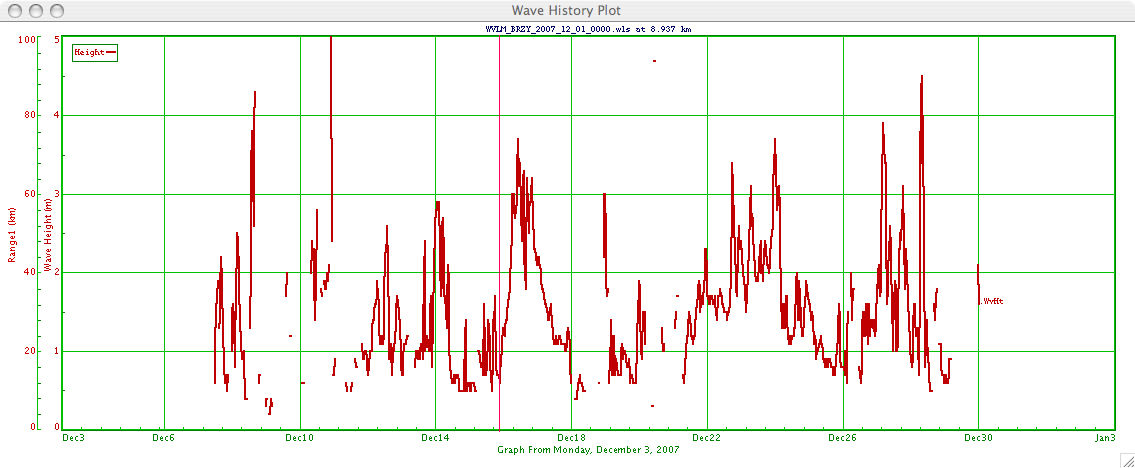
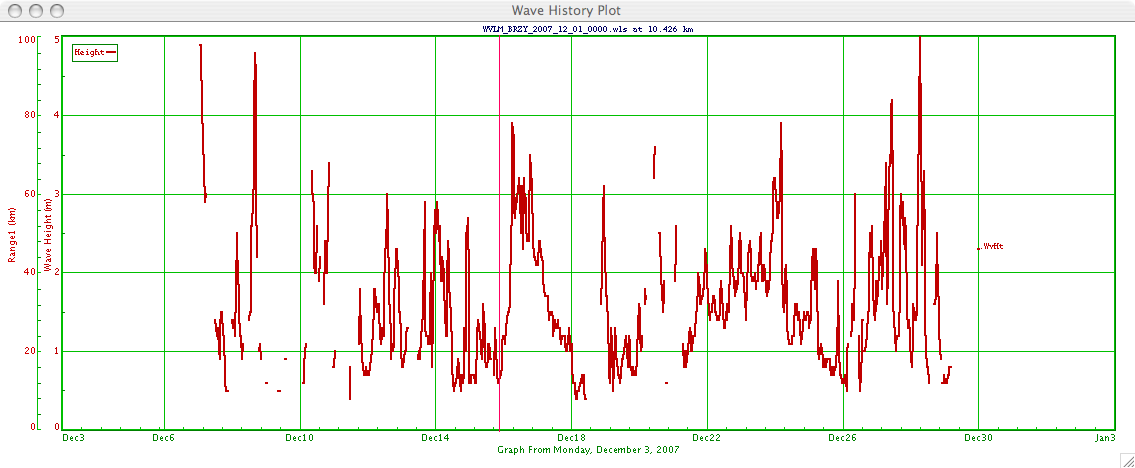
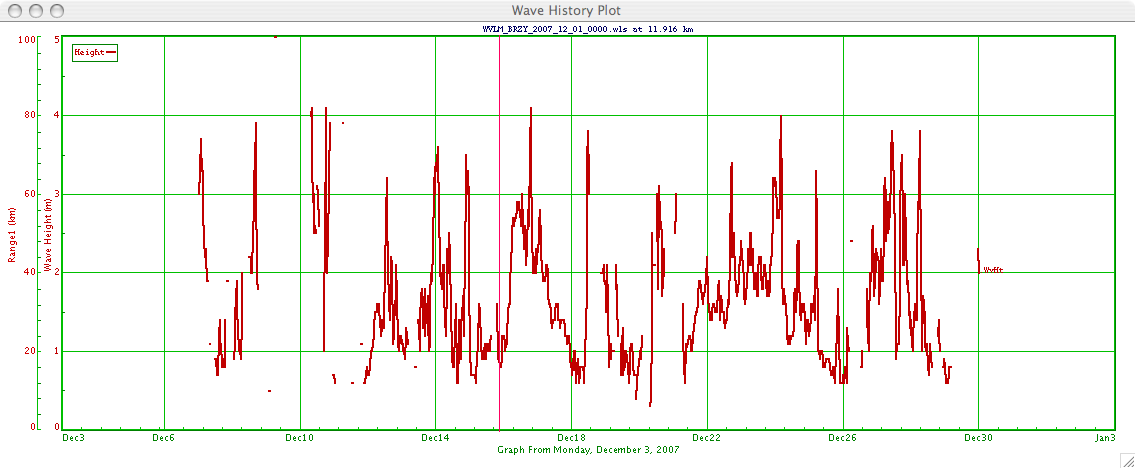
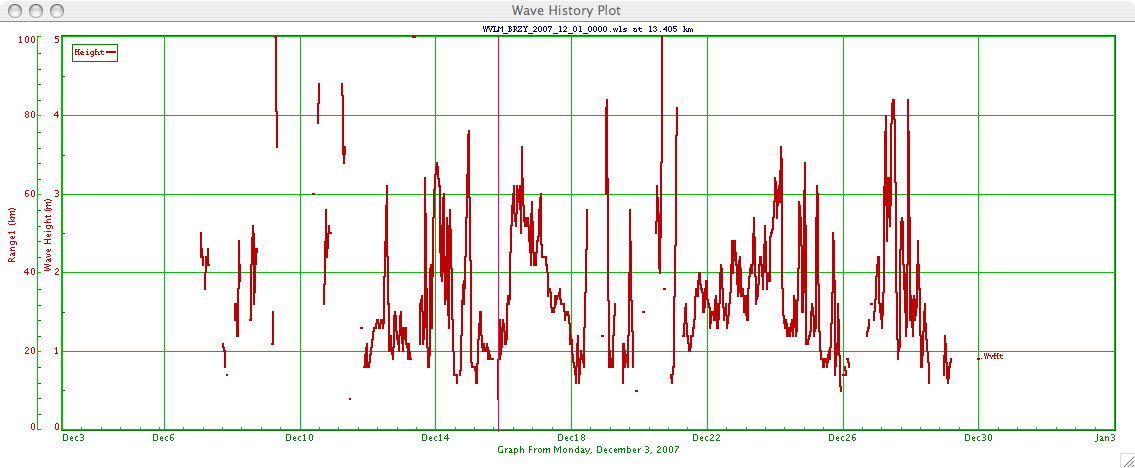
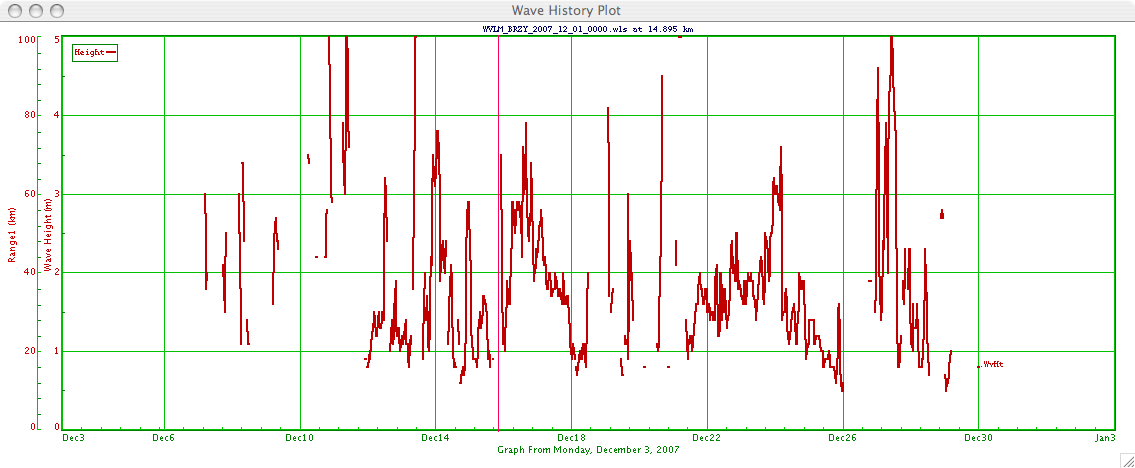
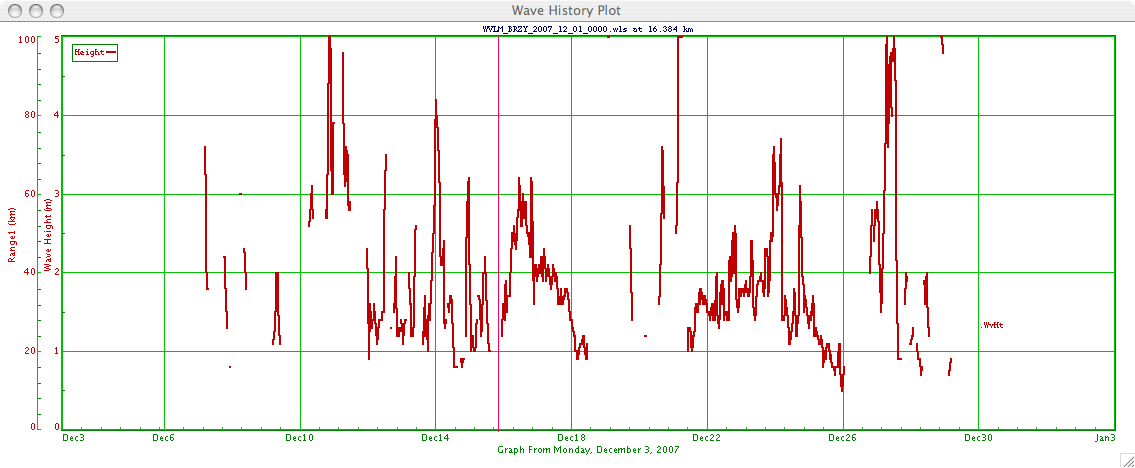
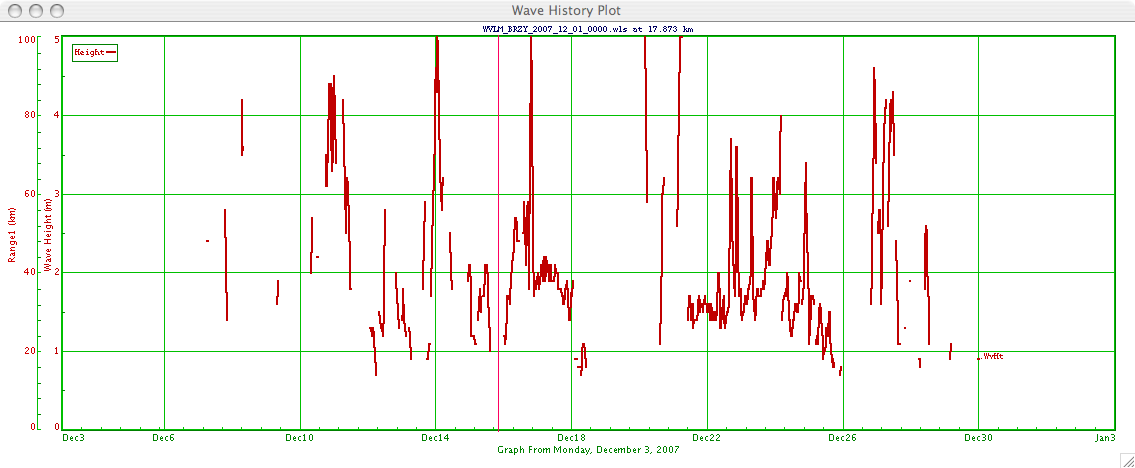
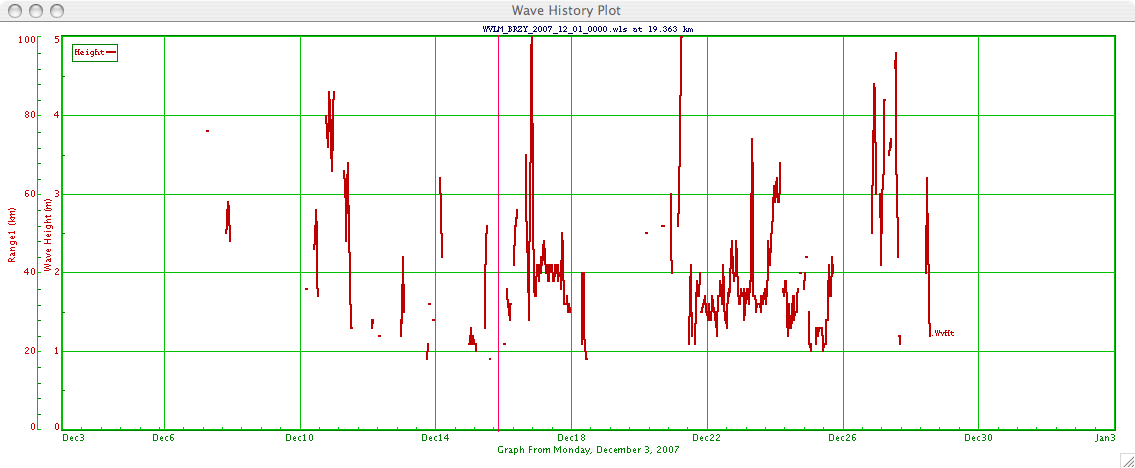
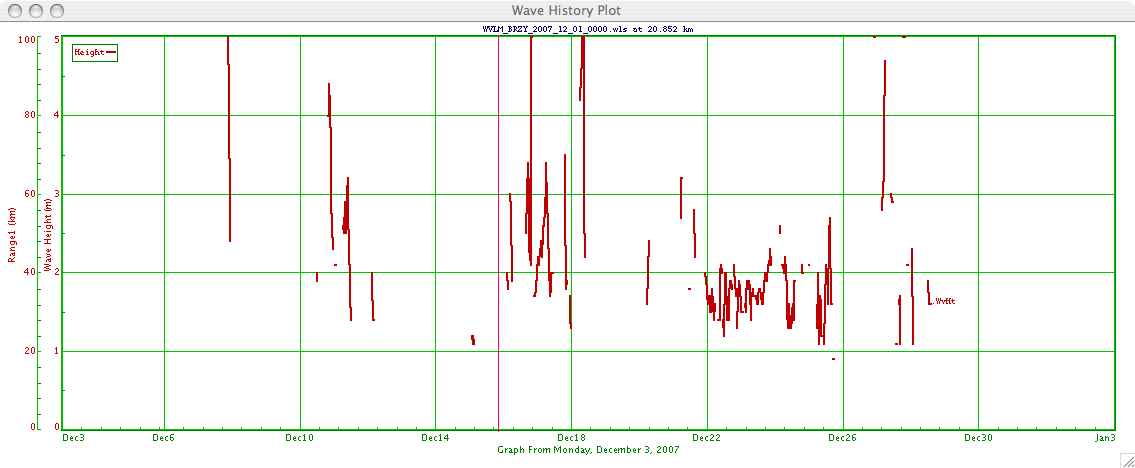
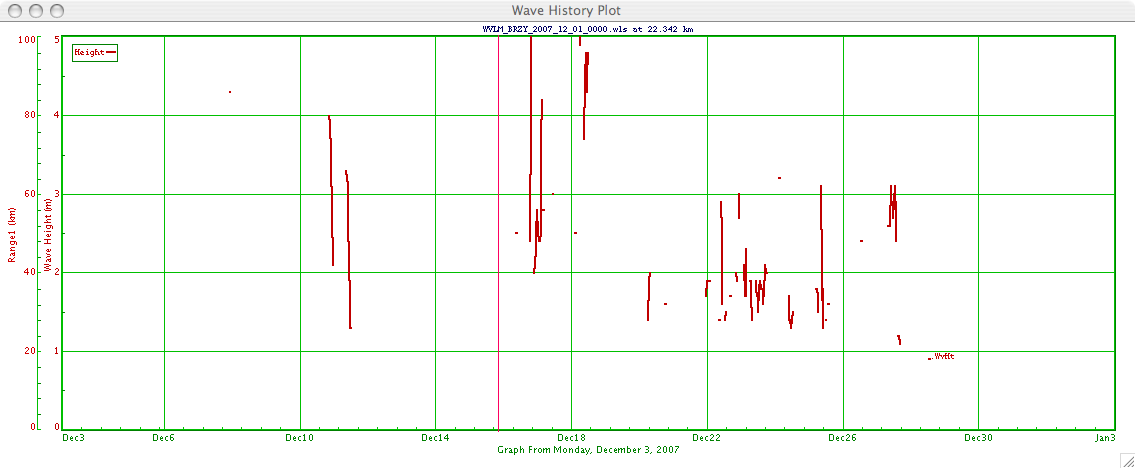
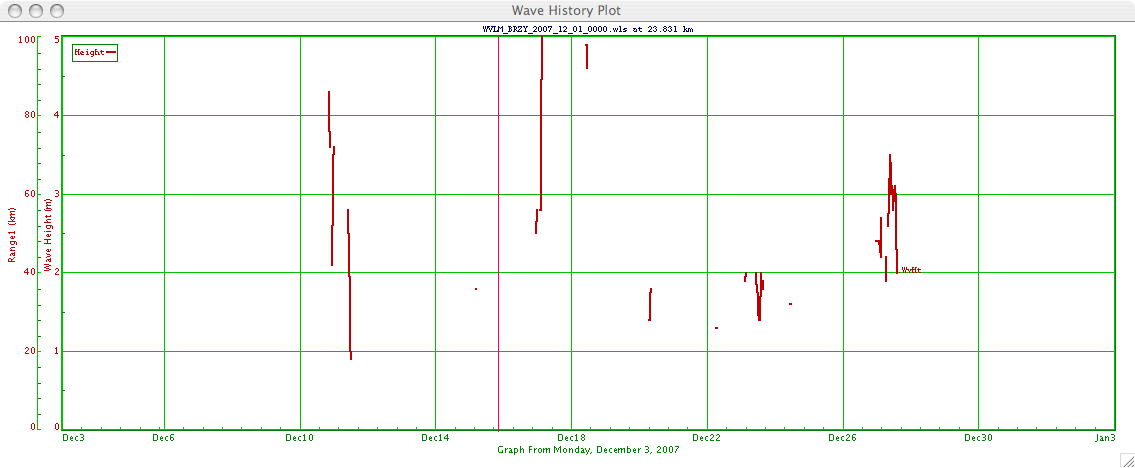
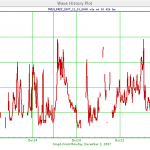
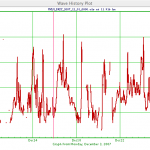
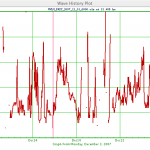
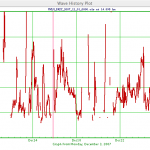
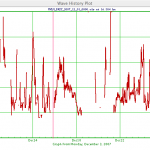
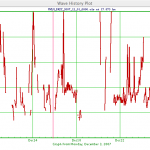
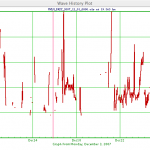
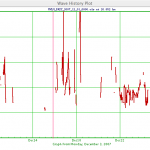
CODAR data (Wave height) for Breezy Point
Posted on July 16th, 2009 No comments-
- Average Wave Heigh For Range Cell 1-16
-
- Range Cell 1
-
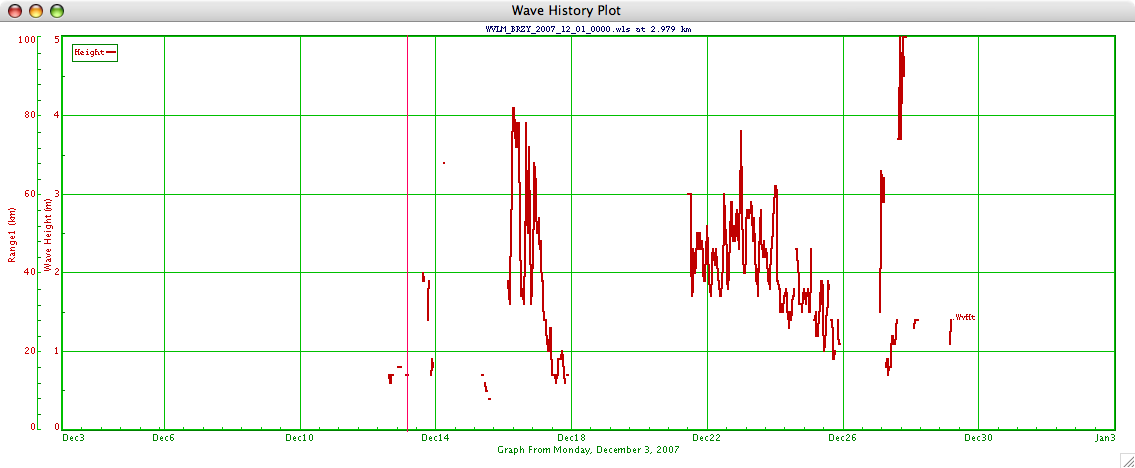
- Range Cell 2
-
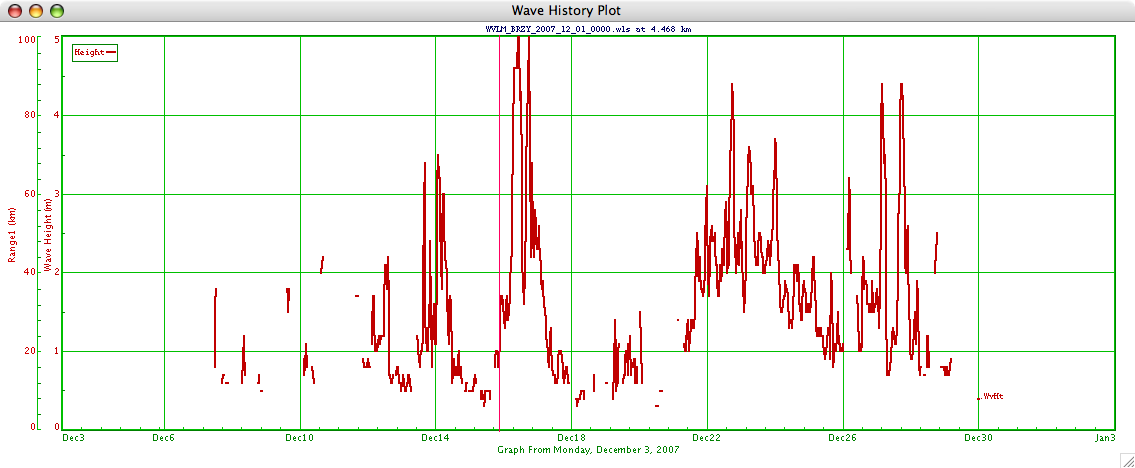
- Range Cell 3
-
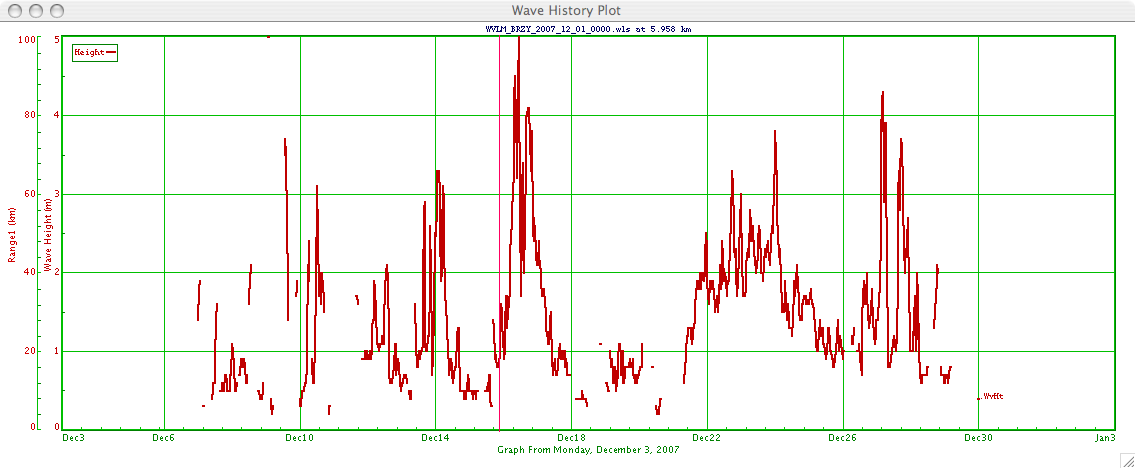
- Range Cell 4
-
- Range Cell 5
-
- Range Cell 6
-
- Range Cell 7
-
- Range Cell 8
-
- Range Cell 9
-
- Range Cell 10
-
- Range Cell 11
-
- Range Cell 12
-
- Range Cell 13
-
- Range Cell 14
-
- Range Cell 15
-
- Range Cell 16
-
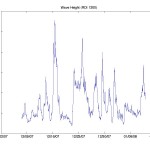
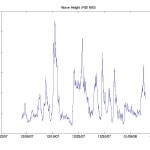
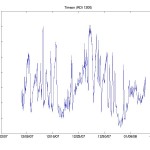
- RDI 1200 Wave Hight
-

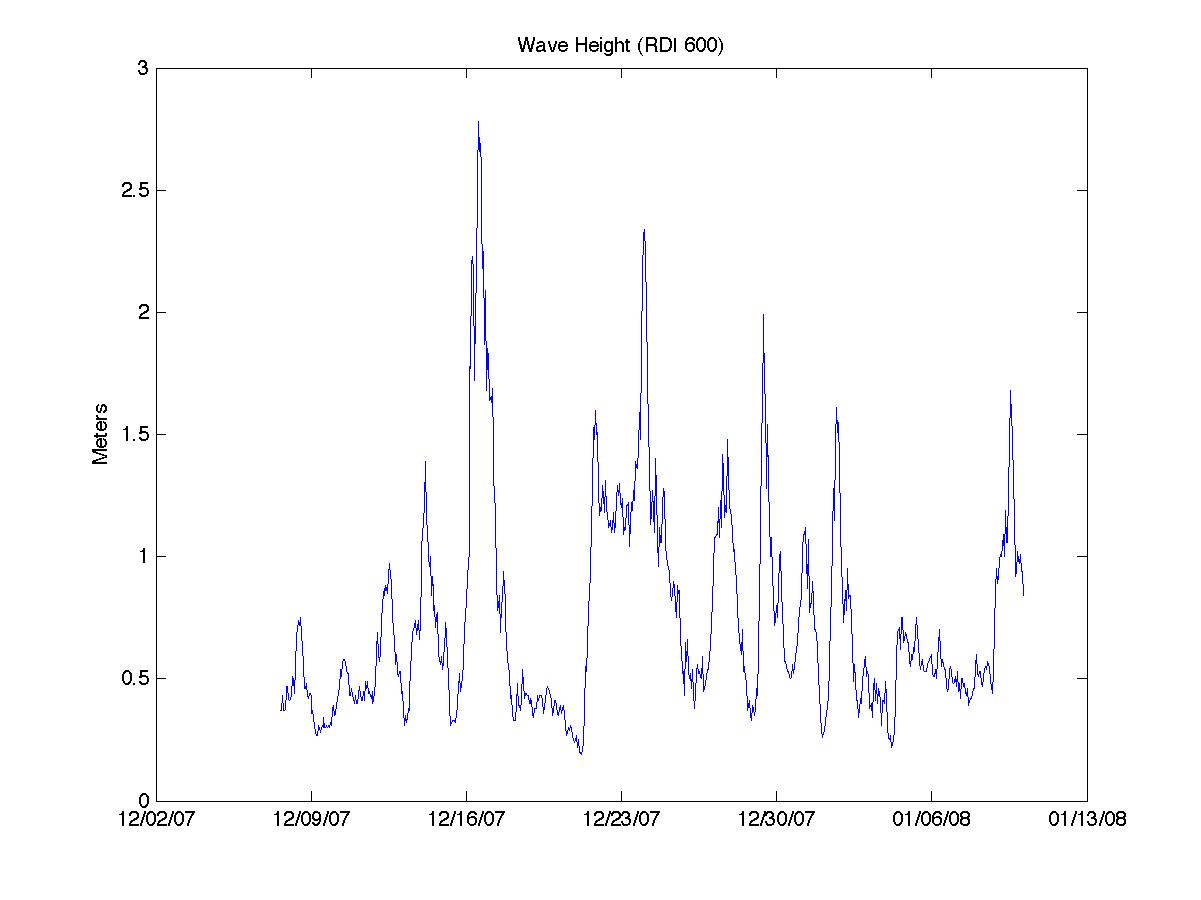
- RDI 600 Wave Height
The red plots are from the CODAR data and the blue plots are from the RDI 1200 and RDI 600.
-
-
RDI 600 Plots
Posted on July 16th, 2009 No comments-
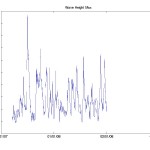
- Wave Height
-

- Peak Period
-
- Peak Direction
-
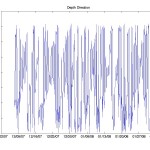
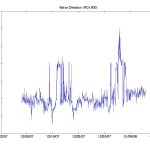
- Depth Direction
-
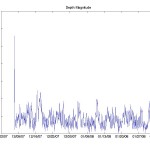
- Depth Magnitude
-
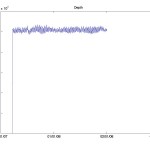
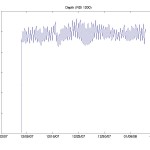
- Depth
-
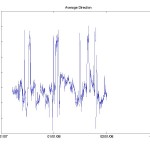
- Mean Direction
-

- Peak Period Mean
-
- Max Wave Height
-
-
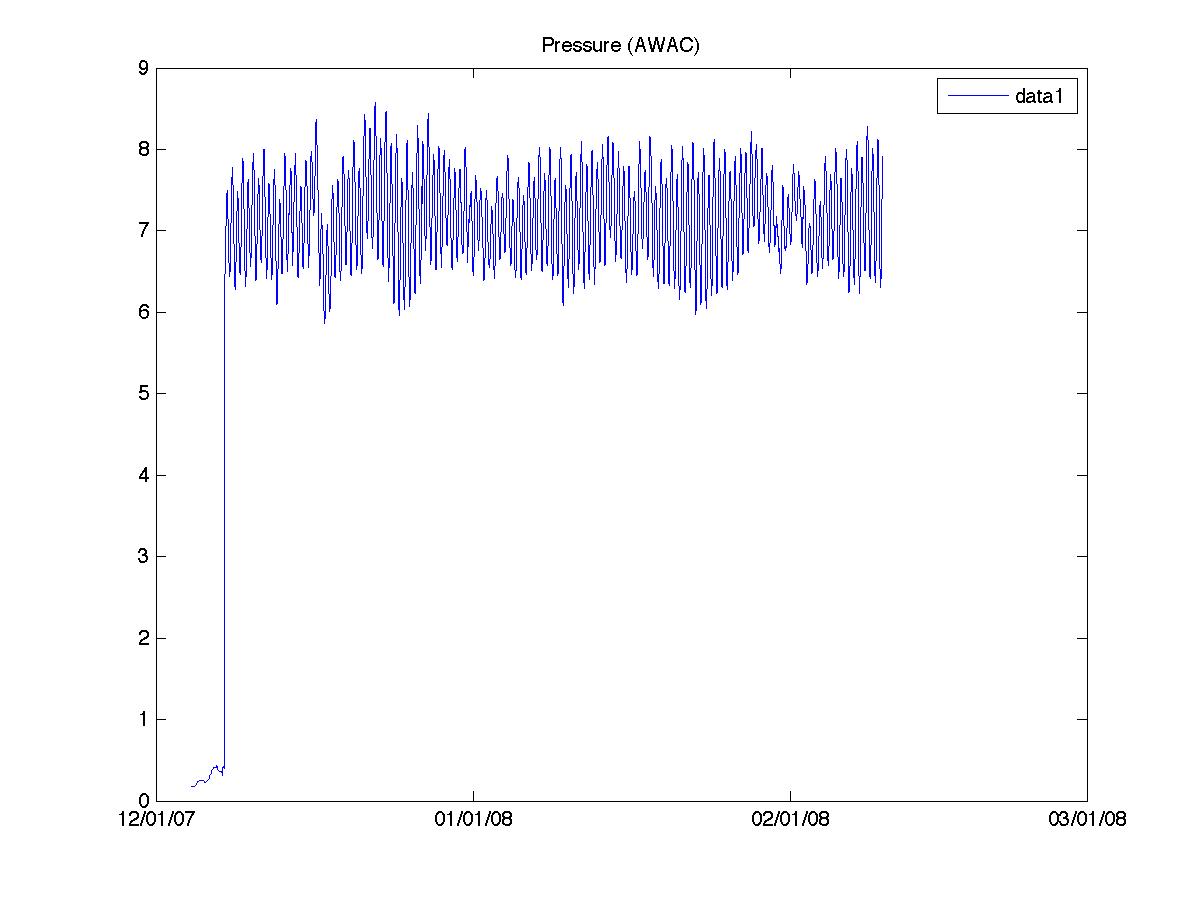
AWAC Data Plots
Posted on July 16th, 2009 No commentsPlots for the AWAC:
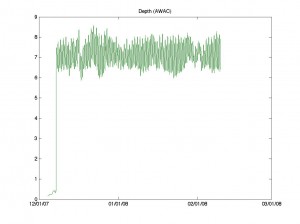
- Depth
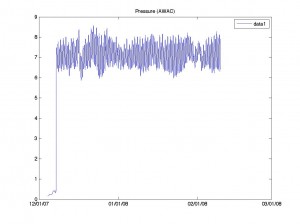
- Pressure
They were created using M
atlab vrs. 7.5
-
Plots from the RDI 1200
Posted on July 16th, 2009 No comments-
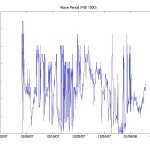
- Peak Period
-

- Peak Direction
-
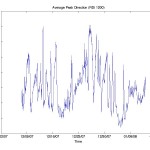
- Average Peak Direction
-

- Wave Height
-
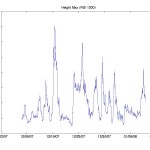
- Wave height Maximum
-
- Average Wave direction
-

- Depth Magnitude
-
- Depth
-
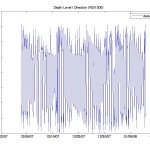
- Depth level Direction
These plots were generated using Matlab vrs. 7.5

-
-
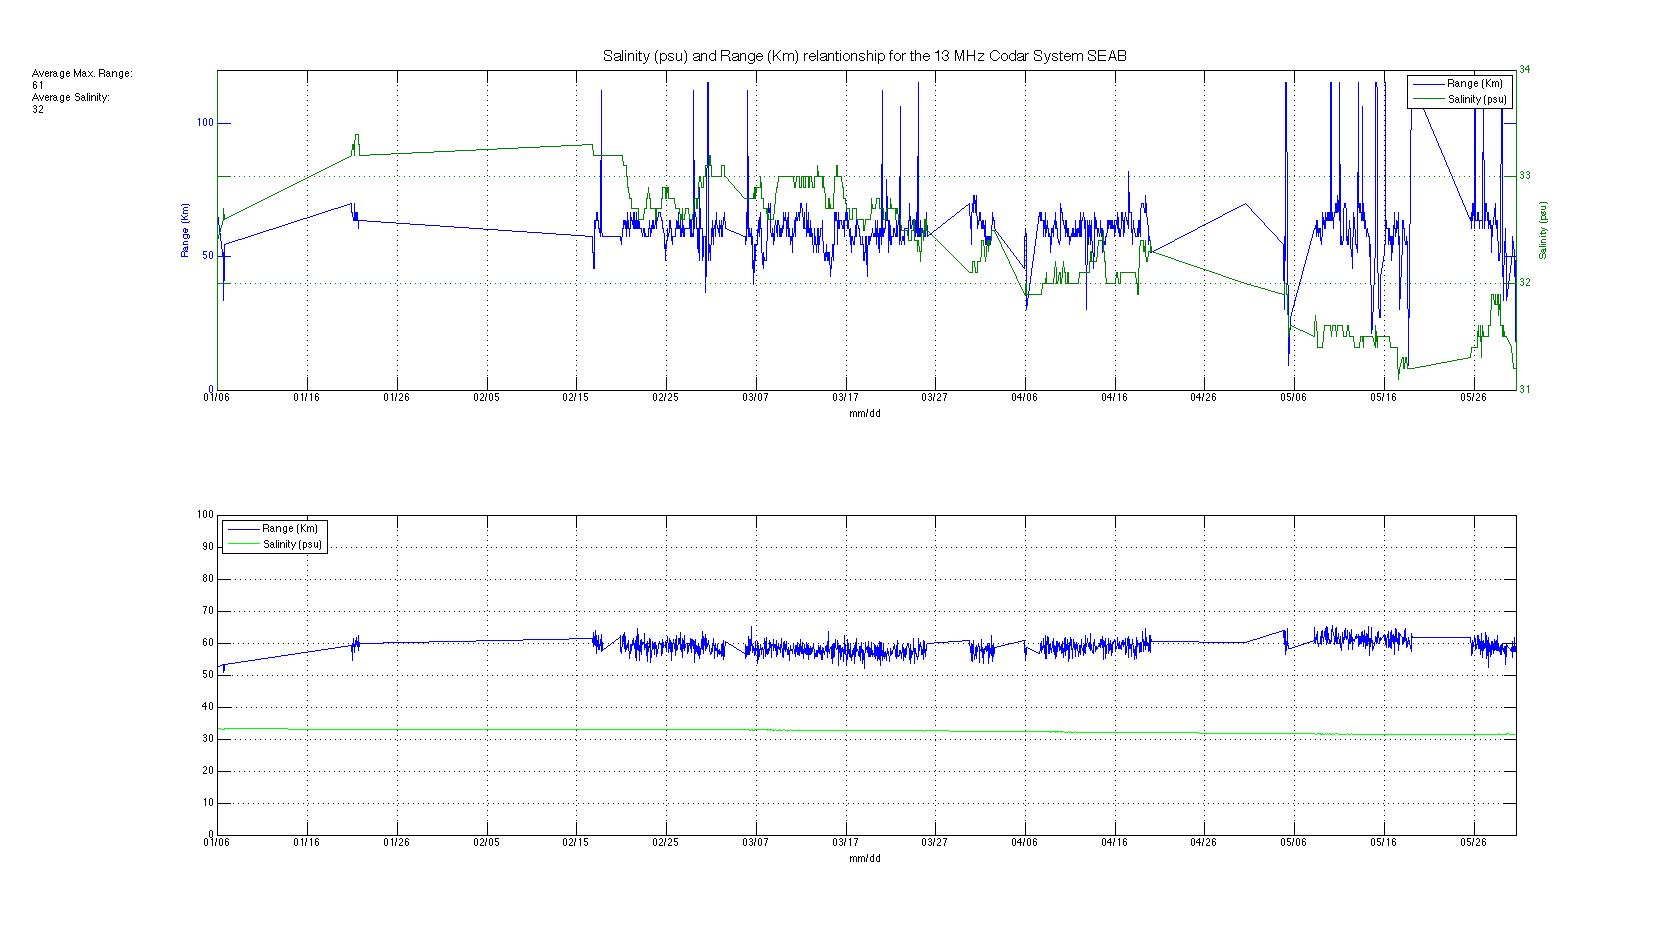
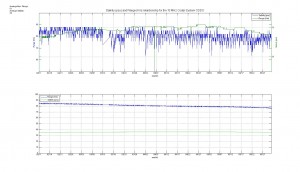
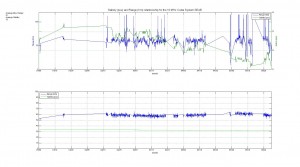
Salinity and Range Relationship for the 13 MHZ sites CDDO and SEAB
Posted on July 9th, 2009 No commentsHere are two plots of the salinity and range relationship for the two 13 MHz sites CDDO and SEAB. The first plot is the raw data and the second one is the data with a fit in it in order to appreciate better the relationship. The data for the salinity was obtained from the National Buoy Data Center. The buoy used for the CDDO site, LPRP4, is at the south-western part of the island at 23 km from the site. The buoy used for the SEAB site, 44025, is at the east part of Sea Bright at 70 km from the site. As we can see there is a little relationship between the range and the salinity. The plot for SEAB presents better this relationship. In it we can see that in some days the salinity decreases and the range follows the same behavior. But at the same time if we take a look of the whole situation there are days when this relationship is not presented. As a conclusion we can state that the CDDO site has a higher salinity in its water with a higher range ( averg. Salinity = 36 psu, averg. Range = 81 Km) than the SEAB site (averg. Salinity = 32 psu, averg. Range = 61 Km). Both sites have a very constant salinity and range. This situation still needs to be look more closely because a change in salinity of 4 psu, its unusual to produce a difference of 20 km in range. Maybe closer data to both site would give us a better understanding of the relationship there is between this two variables.
-
Puerto Rico CDDO Tidal Analysis 2
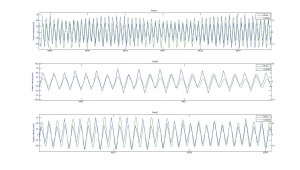
Posted on July 8th, 2009 No commentsTidal Analysis 2 follows a similar approach to the one posted previously but with a few modifications. Three points were selected for comparison: Point A corresponds to range cell #1, Point B corresponds to range cell #2 and so on. This consequently provides a reasonable improvement in terms of proximity to the NOAA station. Also, a larger time series significantly enhanced the performance of T_tides algorithm – the previous analysis was based on one month of data, while this one uses four months of data. Calculated tidal constituents (O1, K1, M2, S2) remained unchanged.
Results:
Note that Both cycles are in phase.
Considering that radial data is limited by what the radar can perceive in a radial direction, discrepancy between current velocity magnitudes is to be expected.