-
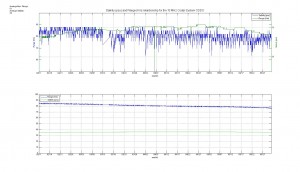
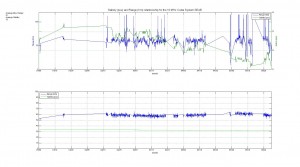
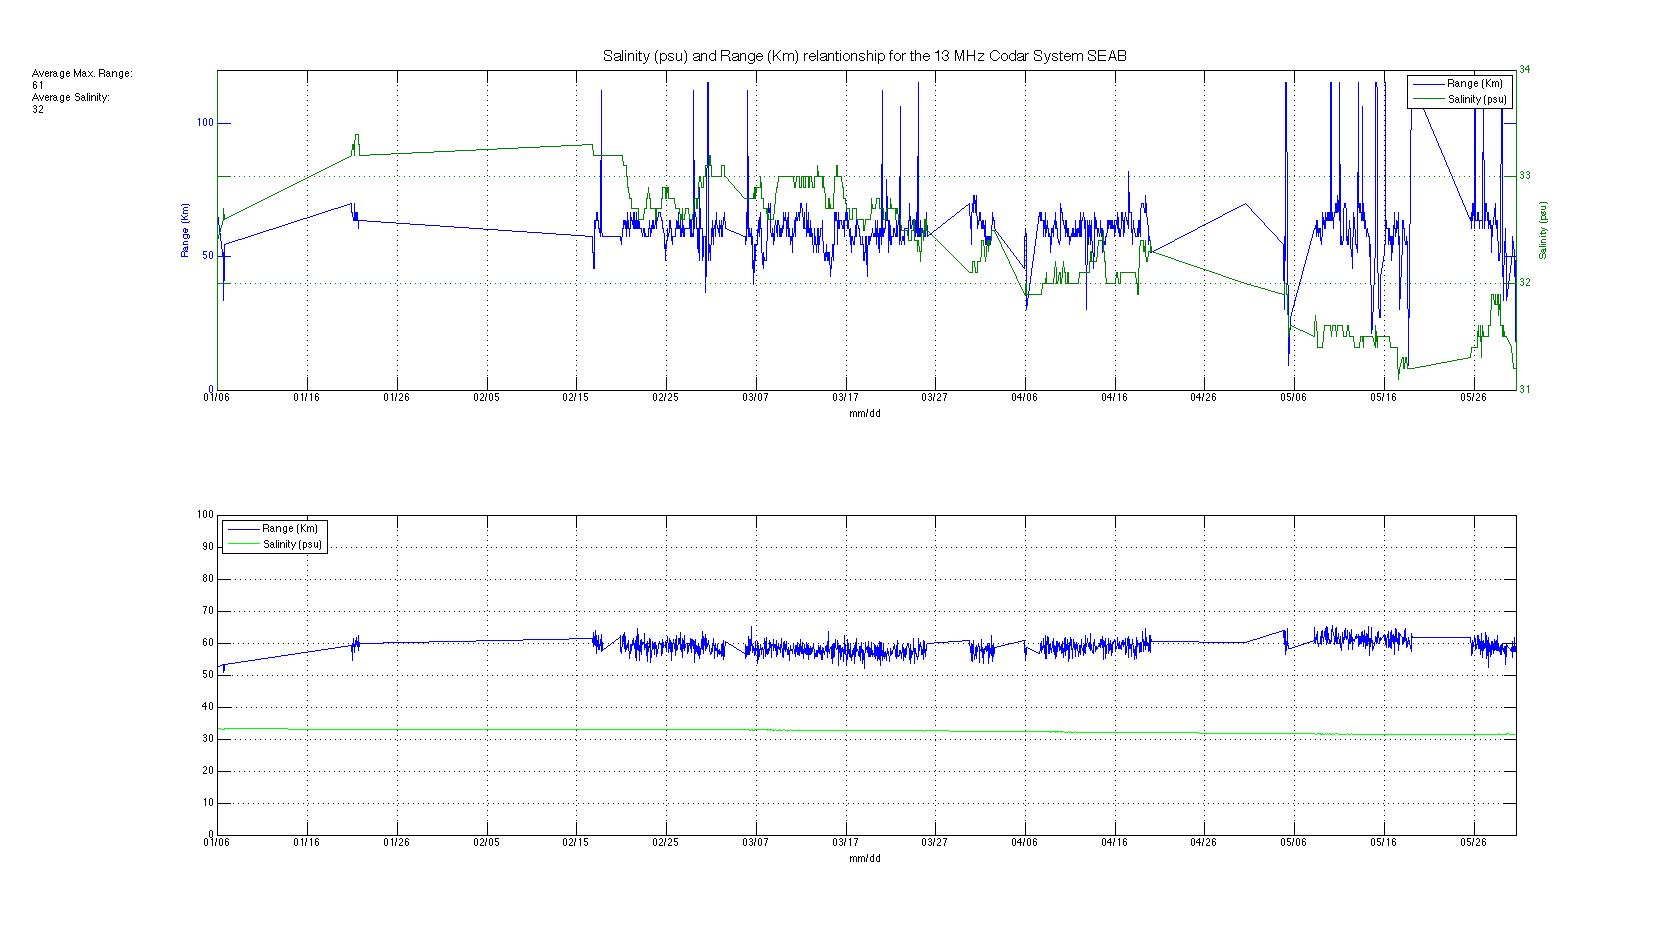
Salinity and Range Relationship for the 13 MHZ sites CDDO and SEAB
Posted on July 9th, 2009 No commentsHere are two plots of the salinity and range relationship for the two 13 MHz sites CDDO and SEAB. The first plot is the raw data and the second one is the data with a fit in it in order to appreciate better the relationship. The data for the salinity was obtained from the National Buoy Data Center. The buoy used for the CDDO site, LPRP4, is at the south-western part of the island at 23 km from the site. The buoy used for the SEAB site, 44025, is at the east part of Sea Bright at 70 km from the site. As we can see there is a little relationship between the range and the salinity. The plot for SEAB presents better this relationship. In it we can see that in some days the salinity decreases and the range follows the same behavior. But at the same time if we take a look of the whole situation there are days when this relationship is not presented. As a conclusion we can state that the CDDO site has a higher salinity in its water with a higher range ( averg. Salinity = 36 psu, averg. Range = 81 Km) than the SEAB site (averg. Salinity = 32 psu, averg. Range = 61 Km). Both sites have a very constant salinity and range. This situation still needs to be look more closely because a change in salinity of 4 psu, its unusual to produce a difference of 20 km in range. Maybe closer data to both site would give us a better understanding of the relationship there is between this two variables.