-
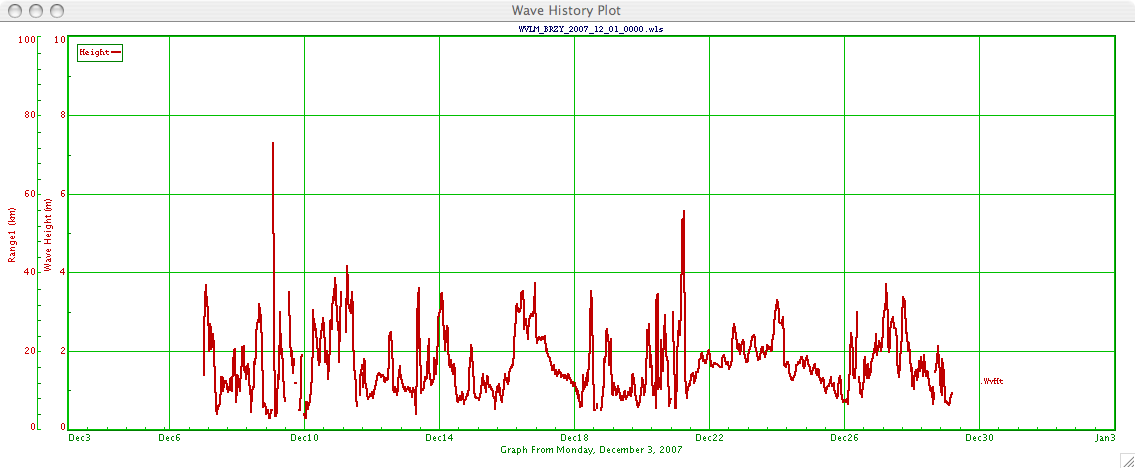
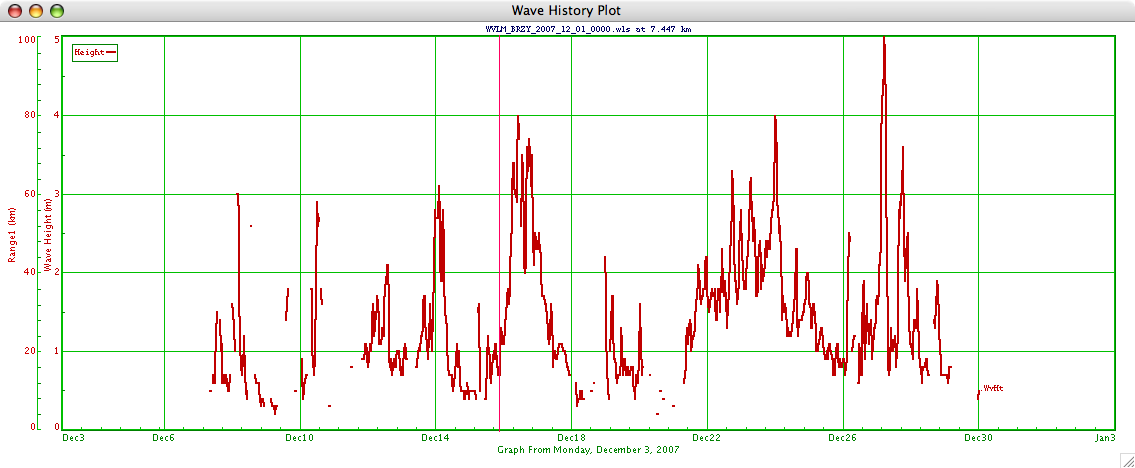
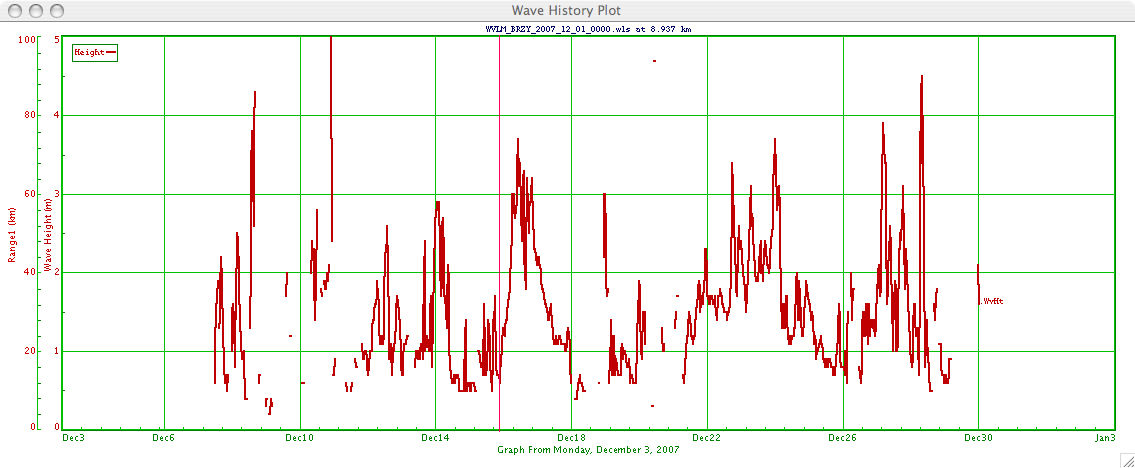
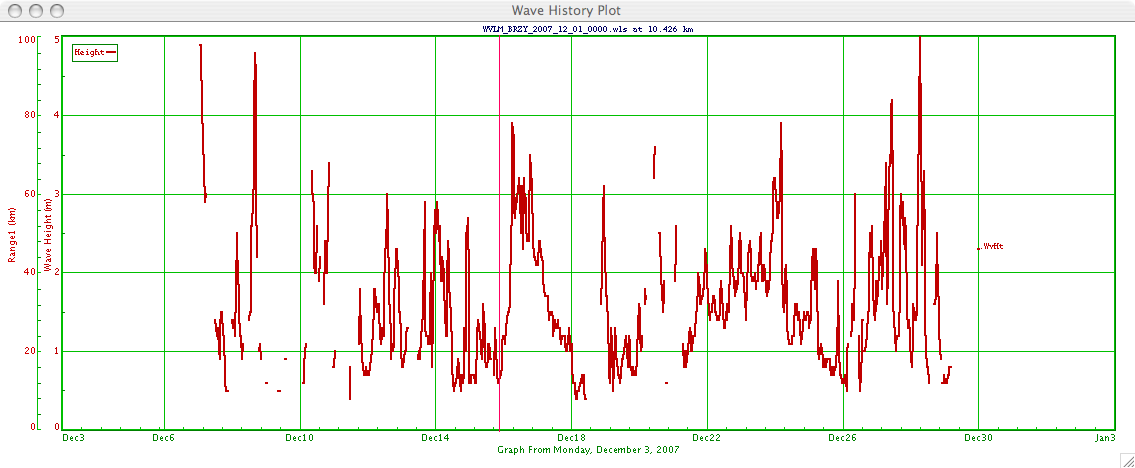
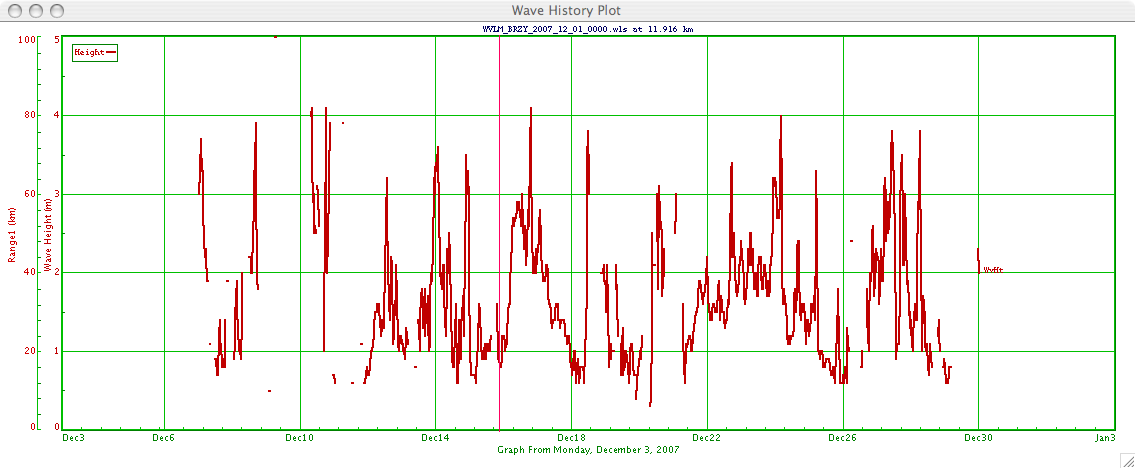
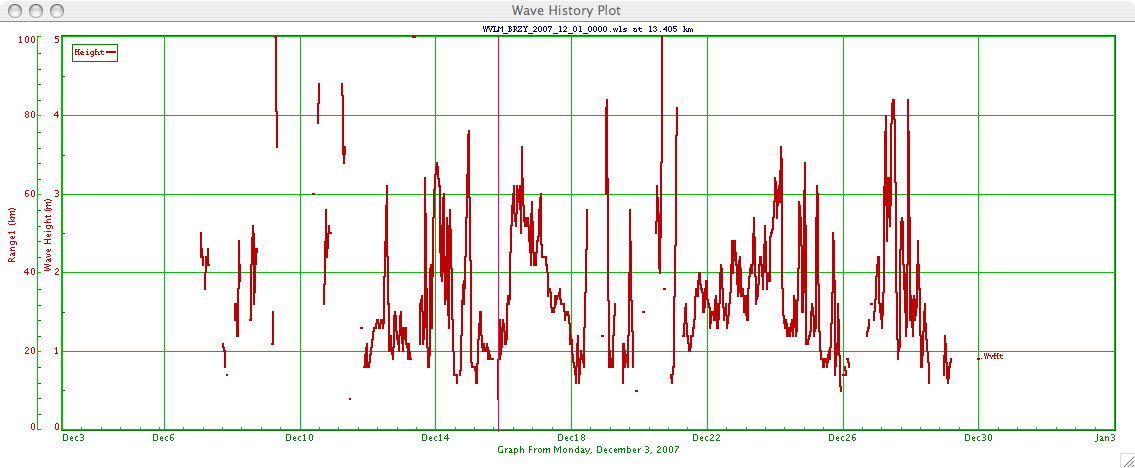
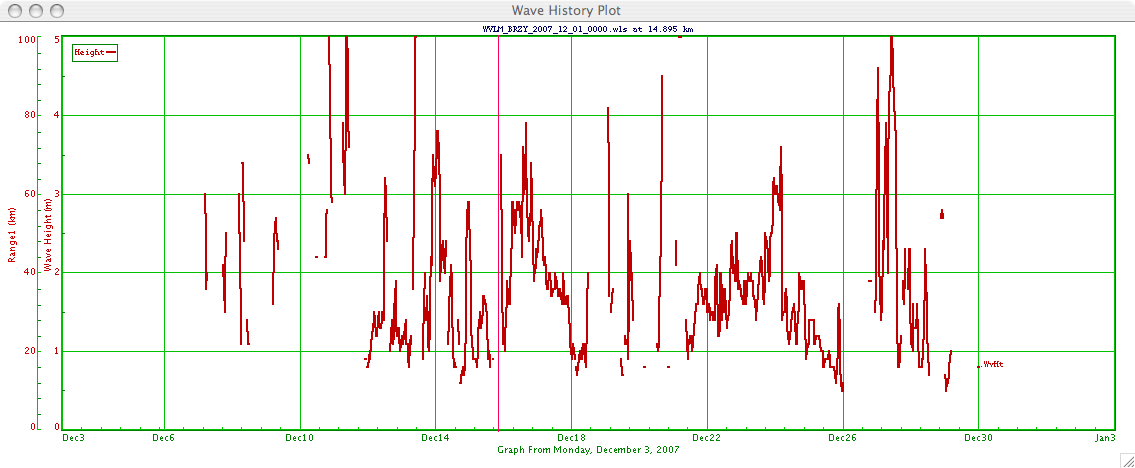
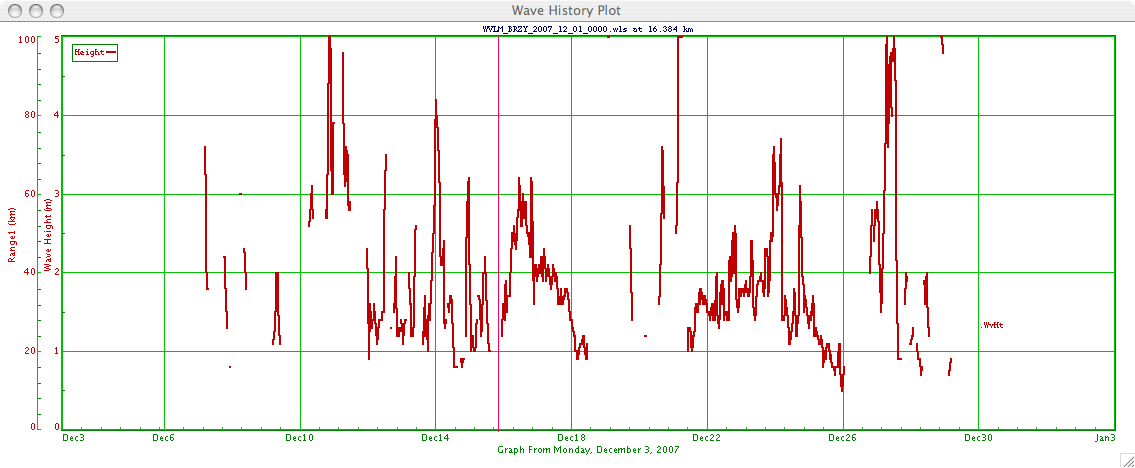
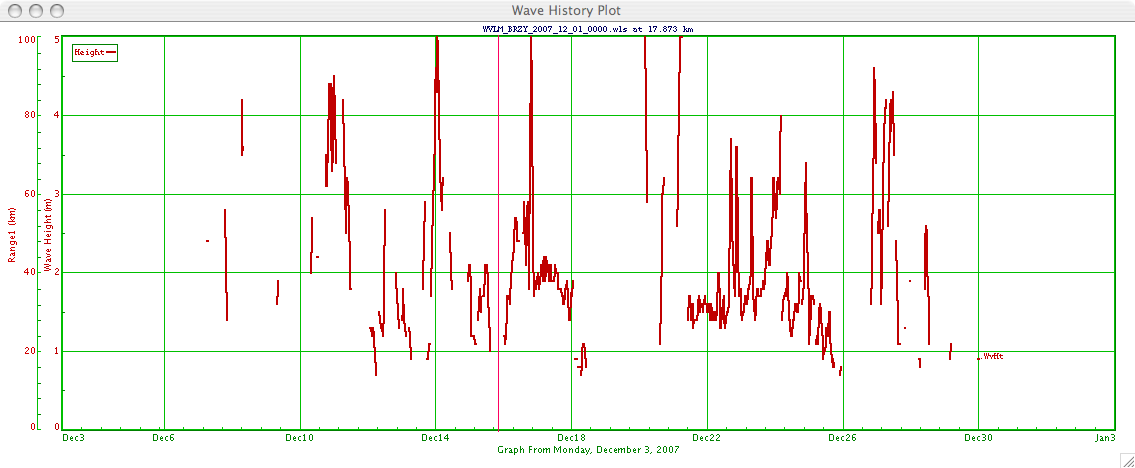
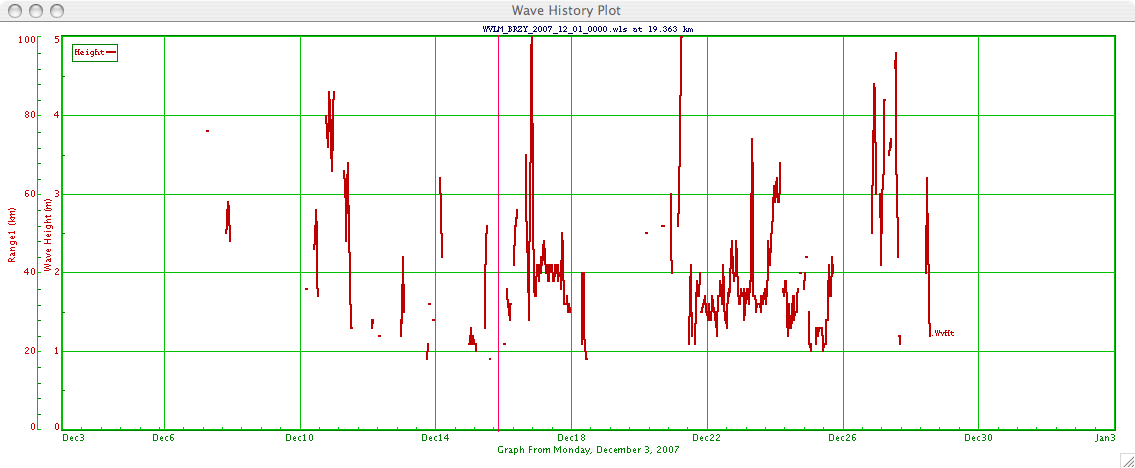
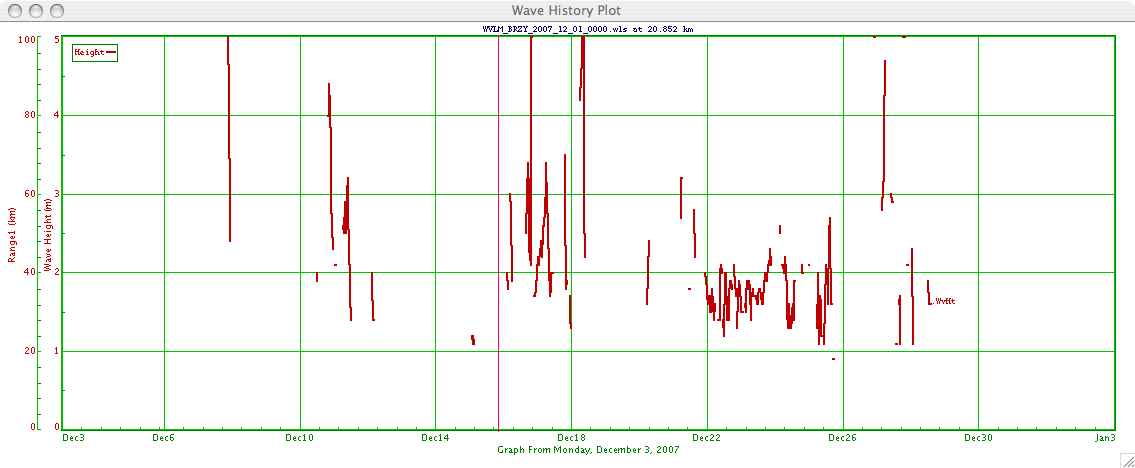
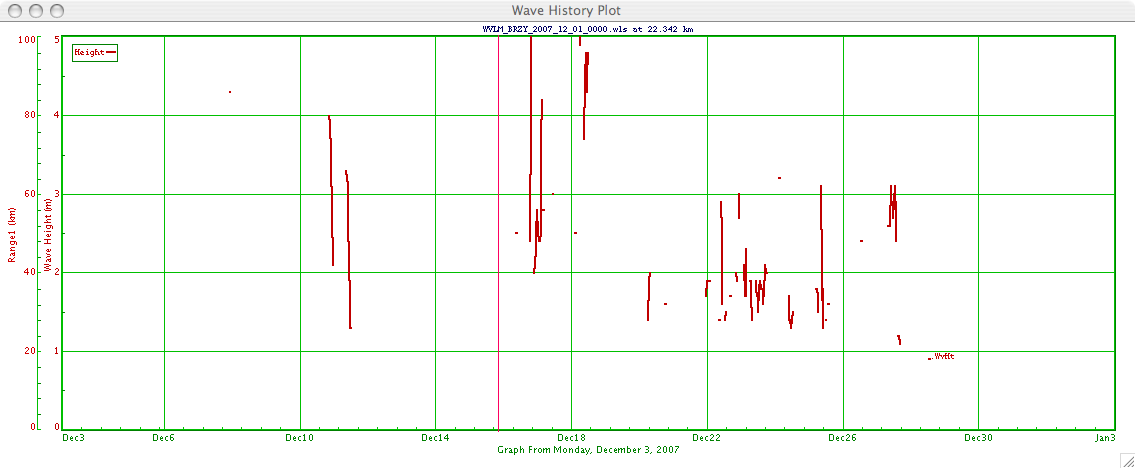
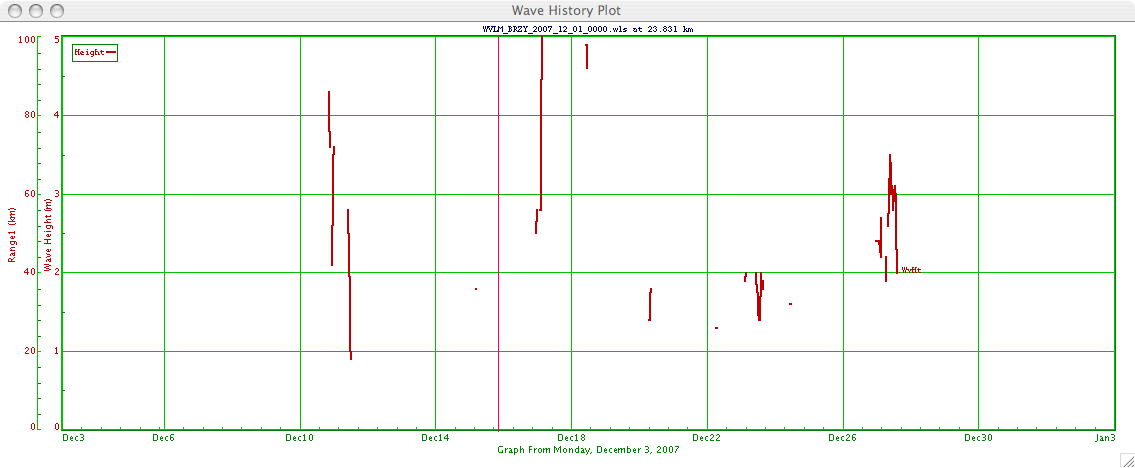
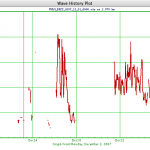
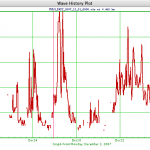
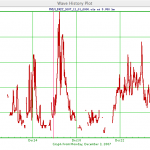
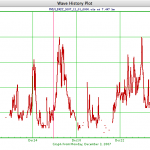
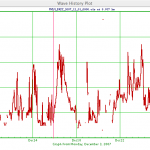
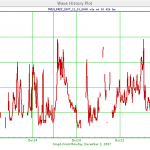
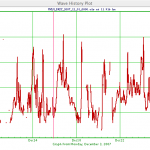
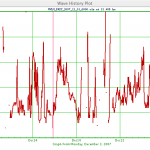
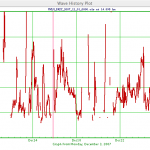
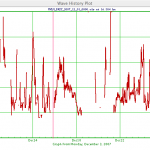
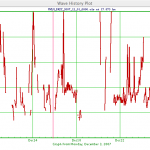
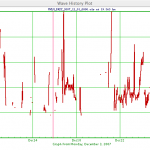
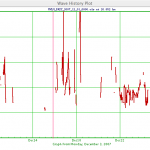
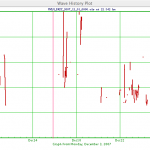
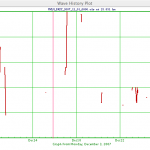
CODAR data (Wave height) for Breezy Point
Posted on July 16th, 2009 No comments-
- Average Wave Heigh For Range Cell 1-16
-
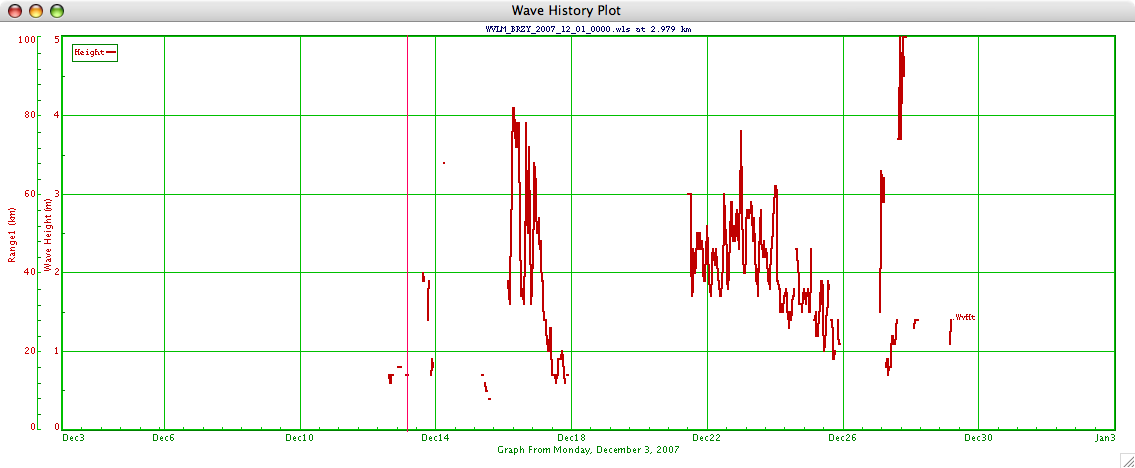
- Range Cell 1
-
- Range Cell 2
-
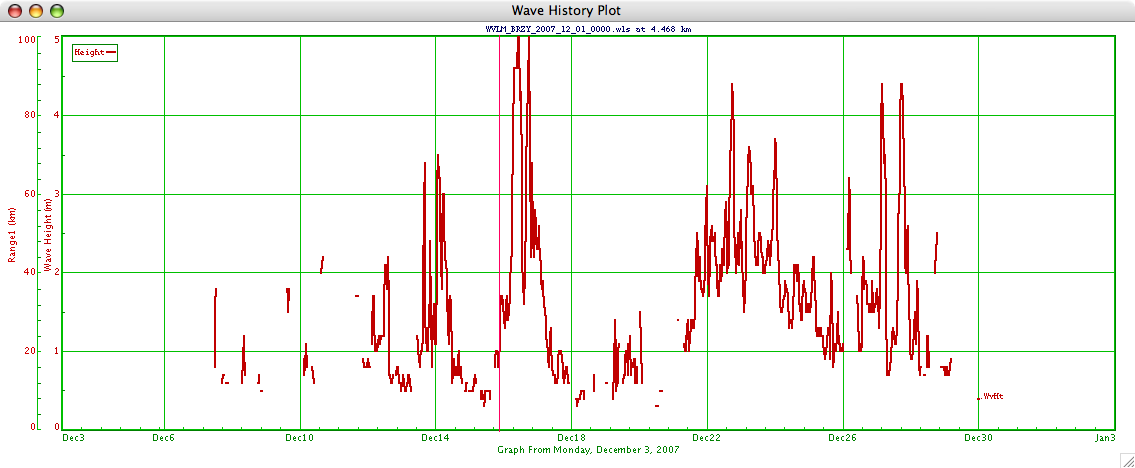
- Range Cell 3
-
- Range Cell 4
-
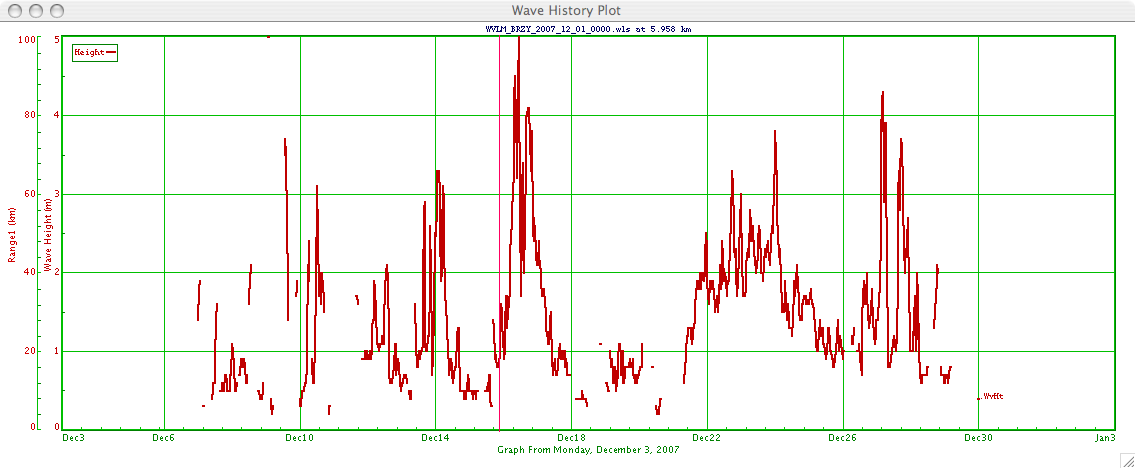
- Range Cell 5
-
- Range Cell 6
-
- Range Cell 7
-
- Range Cell 8
-
- Range Cell 9
-
- Range Cell 10
-
- Range Cell 11
-
- Range Cell 12
-
- Range Cell 13
-
- Range Cell 14
-
- Range Cell 15
-
- Range Cell 16
-
- RDI 1200 Wave Hight
-

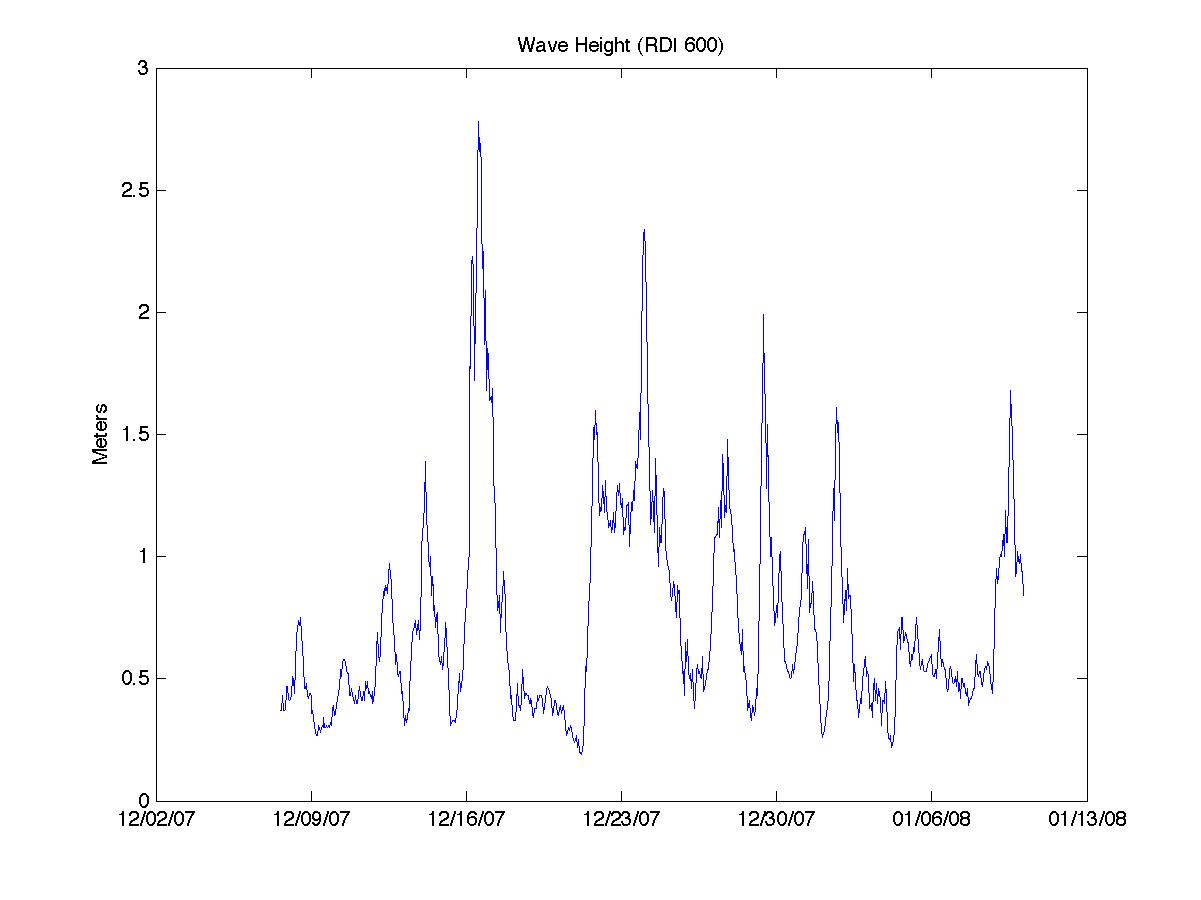
- RDI 600 Wave Height
The red plots are from the CODAR data and the blue plots are from the RDI 1200 and RDI 600.
-
-
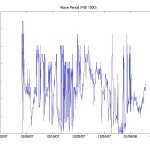
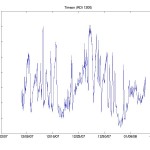
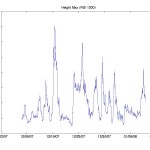
RDI 600 Plots
Posted on July 16th, 2009 No comments-
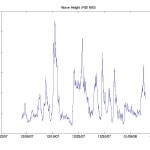
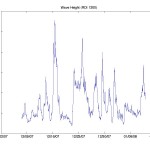
- Wave Height
-

- Peak Period
-
- Peak Direction
-
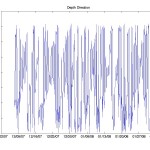
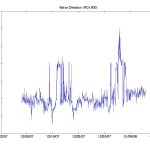
- Depth Direction
-
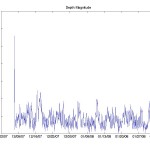
- Depth Magnitude
-
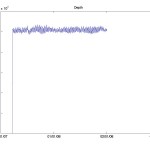
- Depth
-
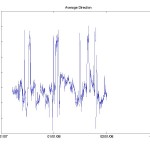
- Mean Direction
-

- Peak Period Mean
-
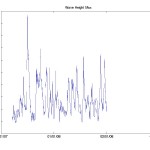
- Max Wave Height
-
-
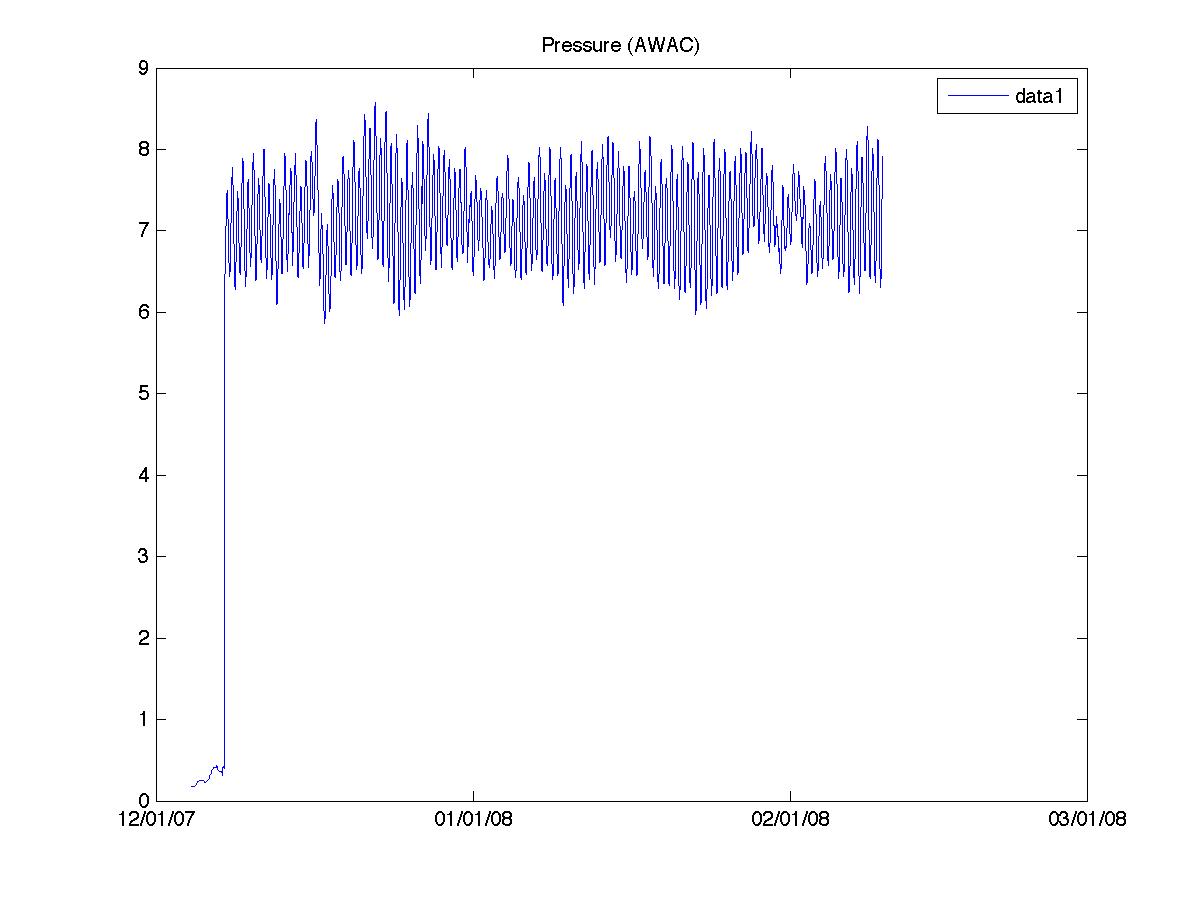
AWAC Data Plots
Posted on July 16th, 2009 No commentsPlots for the AWAC:
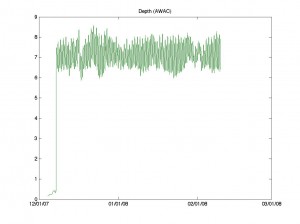
- Depth
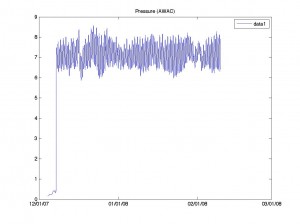
- Pressure
They were created using M
atlab vrs. 7.5
-
Plots from the RDI 1200
Posted on July 16th, 2009 No comments-
- Peak Period
-

- Peak Direction
-
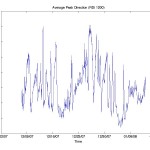
- Average Peak Direction
-

- Wave Height
-
- Wave height Maximum
-
- Average Wave direction
-

- Depth Magnitude
-
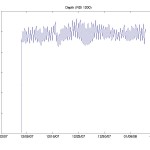
- Depth
-
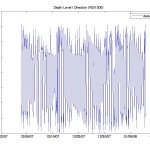
- Depth level Direction
These plots were generated using Matlab vrs. 7.5

-