


-
Sally tracks northwest, SG601 flies south
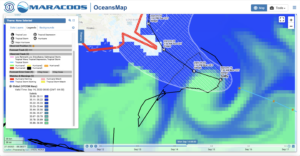
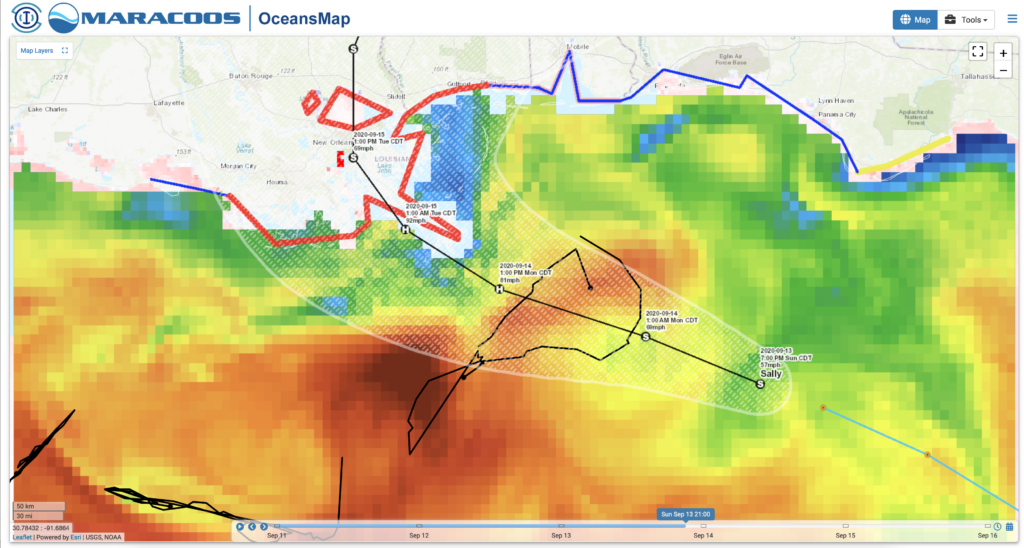
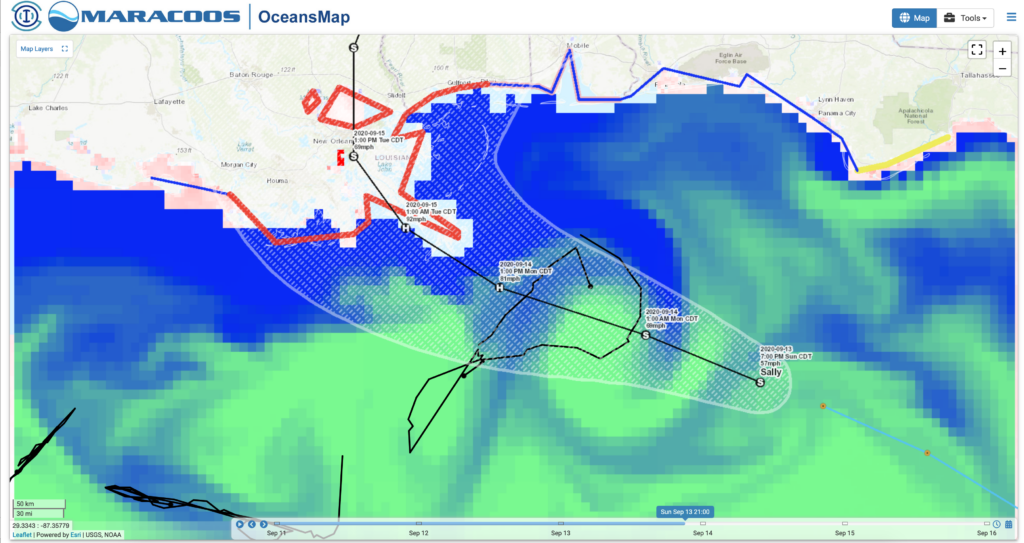
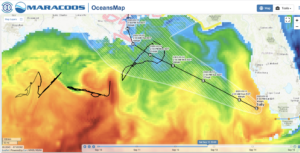
Posted on September 14th, 2020 No commentsThe image below is of the Navy GOFS sea surface salinity field. Enhancing this to focus the color bar on the salinities between 35 & 36 clearly shows the clockwise circulation of the warm eddy just southeast of the Mississippi delta. Sally is right over this warm eddy now, still as a tropical storm in this image. NHC forecast says it moving slowly and they say that it still has time to intensify. Glider SG601 is on the northern side of this ahead, just ahead of Sally. Kevin at USM is piloting it to the south to get into the eddy and even closer to the forecast track of Sally.
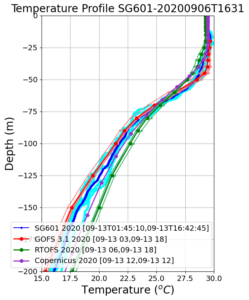
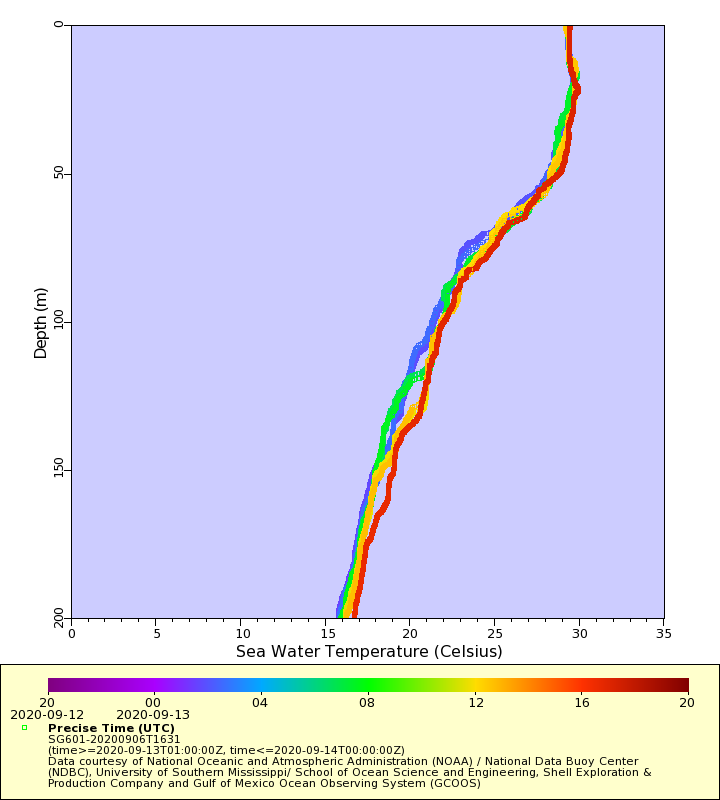
Lets take a look at the temperature profiles from SG601 and compare to the models moves more into the eddy and continues to experience the winds from Sally. Below the temperature profile is zoomed into the upper 200 m to get a look at the surface mixed layer in the upper 50 m where temperatures are in the 29C range. Below 50 m, we move into the thermocline, cross the 26C isotherm about 65 m depth. All models and data in good agreement down to about 75 m, then they diverge. GOFS (red) tends to stick with the Glider data (blue), while RTOFS (green) tends to be about 2C warmer between depths of 150 m to 200 m.
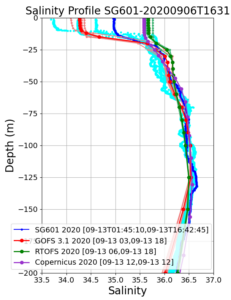
Salinity behavior is the opposite. Data and model are all in pretty good agreement below the mixed layer, but the salinity of the barrier layer varies widely. Note that the temperature mixed layer is 50 m deep, but the low salinity barrier layer is only 15 m deep. The salinity of the barrier layer is uncorrelated with temperature, so T-S relations don’t work, and you need to go out and measure the salinity. Light blue shows the spread in the salinity data from individual profiles. GOFS in red looks to be in with the mix of salinity profiles, which is expected, since only 1 salinity profile is chosen for assimilation each day. RTOFS has much less of a low salinity barrier layer.
-
Sally Approaching SG601
Posted on September 13th, 2020 No commentsSally is currently approaching the Gulf Coast and is still expected to intensify over the next day https://www.nhc.noaa.gov/text/refresh/MIATCDAT4+shtml/132040.shtml? Currently glider SG601, a NOAA NDBC glider piloted by Kevin Martin at USM is heading southeastward toward the eye of the storm. SG601 is on track to enter a warm and salty eddy that is within Sally’s projected path over the next 24 hours
Sea Surface Temeperature from the Navy Global Ocean Forecasting System (GOFS) 3.1
Sea Surface Salinity from the Navy GOFS model
Eddies like these can contain additional ocean heat that, if conditions are right, could be used as an energy source for the storm. We’ll be looking closely at SG601 data as it simultaneously enters the eddy, and starts to be influenced by the eye of the storm. Currently, profiles of temperature from SG601, show a warm surface layer over the upper 50 meters, that has not yet started to mix with underlying cooler waters.
-
“Rapid Intensification is a possibility…”
Posted on September 13th, 2020 No commentsHere is a screen shot of the 5 am National Hurricane Center discussion.
Last sentence in the screen shot tells us to watch the core of Sally on Monday. That rapid intensification is a possibility, ands stronger solutions like HWRF can’t be dismissed.
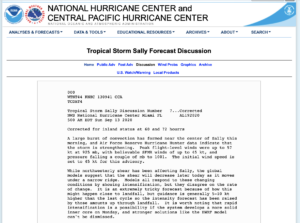
Lesson learned from Laura. Full text of the discussion here.
https://www.nhc.noaa.gov/text/refresh/MIATCDAT4+shtml/130941.shtml?
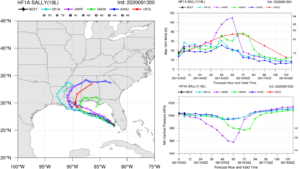
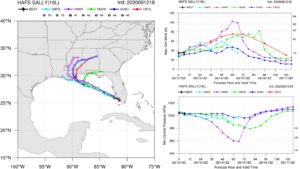
Latest forecasts are below. HMON rapidly intensifies nearly to Cat 4. HMON is in the middle, intensifying to nearly to Cat 2. Experimental HAFS stays a Tropical Storm. 50 knot spread in the intensity guidance. Plenty of room for new science.
-
Hurricane Sally, a warm eddy, and glider SG601
Posted on September 12th, 2020 No commentsSally is leaving the wester coast of Florida, crossing the Gulf north of the Loop Current, and is forecast to intensify to a hurricane just before landfall in Louisiana. Looking at the regional hurricane models, seems we are repeating the Laura experience. On the left we see the tracks are pretty much straight to the northwest for all the models nearly until landfall. Operational HMON is the first pull away to the north while still over water, operational HWRF pulls away to the north after landfall, and experimental HAFS stays straight on the northwest course. Now look on the right at intensity. HWRF (purple) intensifies to the middle of Cat 3 just before landfall then quickly drops back to a tropical storm as it moves overland. HMON (green) intensifies to Cat 1 in about the same location, nearly touching the Cat 2 line, and stays in the Cat 1 region for quite some time as it lingers offshore. That lingering offshore always brings up questions of rainfall and freshwater flooding combined with salt water storm surge. HAFS (light blue) just continues straight through this HWRF/HMON decision point as a tropical storm the entire way, never reaching hurricane strength, and weakening to the lower limit of Tropical Storm as the two operational models are intensifying. The velocity spread between HWRF, HMON and HAFS is approaching 70 knots. The official NHC intensity forecast (red) favors HWRF up to 48 hours and HMON after 60 hours.
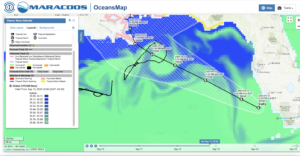
Lets see what the ocean is doing along this track. First a map of Sea Surface Temperature from the Navy GOFS model. Here the temperature image is enhanced to show the temperature above 26C, with darker blue being 26C and darker red being 32C. Sally leaves the warm West Florida Shelf, is forecast to track north of the Loop Current, staying over water in the 29.5C-30.0C range (green) until landfall. Looks like the NDBC Glider SG601 is on the right of the forecast track and the Navy Glider NG357 is on the left. Well positioned.
Now lets look subsurface in GOFS. Here is a vertical section of the upper 350 m of the water column along the forecast track from Maria’s daily collection. The x axis is latitude, and as the storm moves northwest, the latitude increases, so the West Florida Shelf is on the left hand side of this figure. The warmest water, warm top to bottom, above 30C. As the track moves north, it crosses an area where the 26C isotherm depth (black line) is relatively constant, near 40 m. Just north of 28N latitude, the 26C isotherm deepens to about 70 m. You see the warm core though the entire 350 m of the water column shown here. Sally then makes landfall in Louisiana.

So what is the warm core feature in the above section, and where is it located? As usual, it is hard to see the circulation patterns in the SST above, especially in the Gulf near summer. So lets try salinity, the freshwater from the Mississippi. Remember how in the Caribbean, we used salinity, specifically the freshwater from the Amazon and the Orinoco, as a tracer to highlight the mesoscale in the GOFS model. Below is the salinity map where we have enhanced the image to highlight the range of salinity from 35 or below (darkest blue) to 36 and above (brightest green). A perfectly circular anticyclonic warm eddy pops right out.
The track of Sally is forecast to go right over this warm eddy highlighted in the salinity field. The official forecast has Sally heading into the eddy as a Tropical Storm and heading out of the eddy as a hurricane. It looks like NDBC glider SG601 is heading south, towards the hurricane track and the center of the eddy.
