


-
Hurricane Sally, a warm eddy, and glider SG601
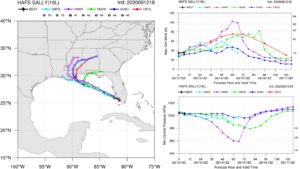
Posted on September 12th, 2020 No commentsSally is leaving the wester coast of Florida, crossing the Gulf north of the Loop Current, and is forecast to intensify to a hurricane just before landfall in Louisiana. Looking at the regional hurricane models, seems we are repeating the Laura experience. On the left we see the tracks are pretty much straight to the northwest for all the models nearly until landfall. Operational HMON is the first pull away to the north while still over water, operational HWRF pulls away to the north after landfall, and experimental HAFS stays straight on the northwest course. Now look on the right at intensity. HWRF (purple) intensifies to the middle of Cat 3 just before landfall then quickly drops back to a tropical storm as it moves overland. HMON (green) intensifies to Cat 1 in about the same location, nearly touching the Cat 2 line, and stays in the Cat 1 region for quite some time as it lingers offshore. That lingering offshore always brings up questions of rainfall and freshwater flooding combined with salt water storm surge. HAFS (light blue) just continues straight through this HWRF/HMON decision point as a tropical storm the entire way, never reaching hurricane strength, and weakening to the lower limit of Tropical Storm as the two operational models are intensifying. The velocity spread between HWRF, HMON and HAFS is approaching 70 knots. The official NHC intensity forecast (red) favors HWRF up to 48 hours and HMON after 60 hours.
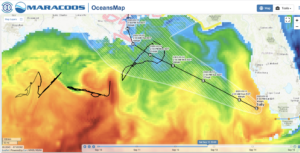
Lets see what the ocean is doing along this track. First a map of Sea Surface Temperature from the Navy GOFS model. Here the temperature image is enhanced to show the temperature above 26C, with darker blue being 26C and darker red being 32C. Sally leaves the warm West Florida Shelf, is forecast to track north of the Loop Current, staying over water in the 29.5C-30.0C range (green) until landfall. Looks like the NDBC Glider SG601 is on the right of the forecast track and the Navy Glider NG357 is on the left. Well positioned.
Now lets look subsurface in GOFS. Here is a vertical section of the upper 350 m of the water column along the forecast track from Maria’s daily collection. The x axis is latitude, and as the storm moves northwest, the latitude increases, so the West Florida Shelf is on the left hand side of this figure. The warmest water, warm top to bottom, above 30C. As the track moves north, it crosses an area where the 26C isotherm depth (black line) is relatively constant, near 40 m. Just north of 28N latitude, the 26C isotherm deepens to about 70 m. You see the warm core though the entire 350 m of the water column shown here. Sally then makes landfall in Louisiana.

So what is the warm core feature in the above section, and where is it located? As usual, it is hard to see the circulation patterns in the SST above, especially in the Gulf near summer. So lets try salinity, the freshwater from the Mississippi. Remember how in the Caribbean, we used salinity, specifically the freshwater from the Amazon and the Orinoco, as a tracer to highlight the mesoscale in the GOFS model. Below is the salinity map where we have enhanced the image to highlight the range of salinity from 35 or below (darkest blue) to 36 and above (brightest green). A perfectly circular anticyclonic warm eddy pops right out.
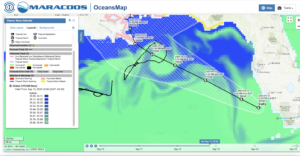
The track of Sally is forecast to go right over this warm eddy highlighted in the salinity field. The official forecast has Sally heading into the eddy as a Tropical Storm and heading out of the eddy as a hurricane. It looks like NDBC glider SG601 is heading south, towards the hurricane track and the center of the eddy.
