-
Tidal Analysis 3
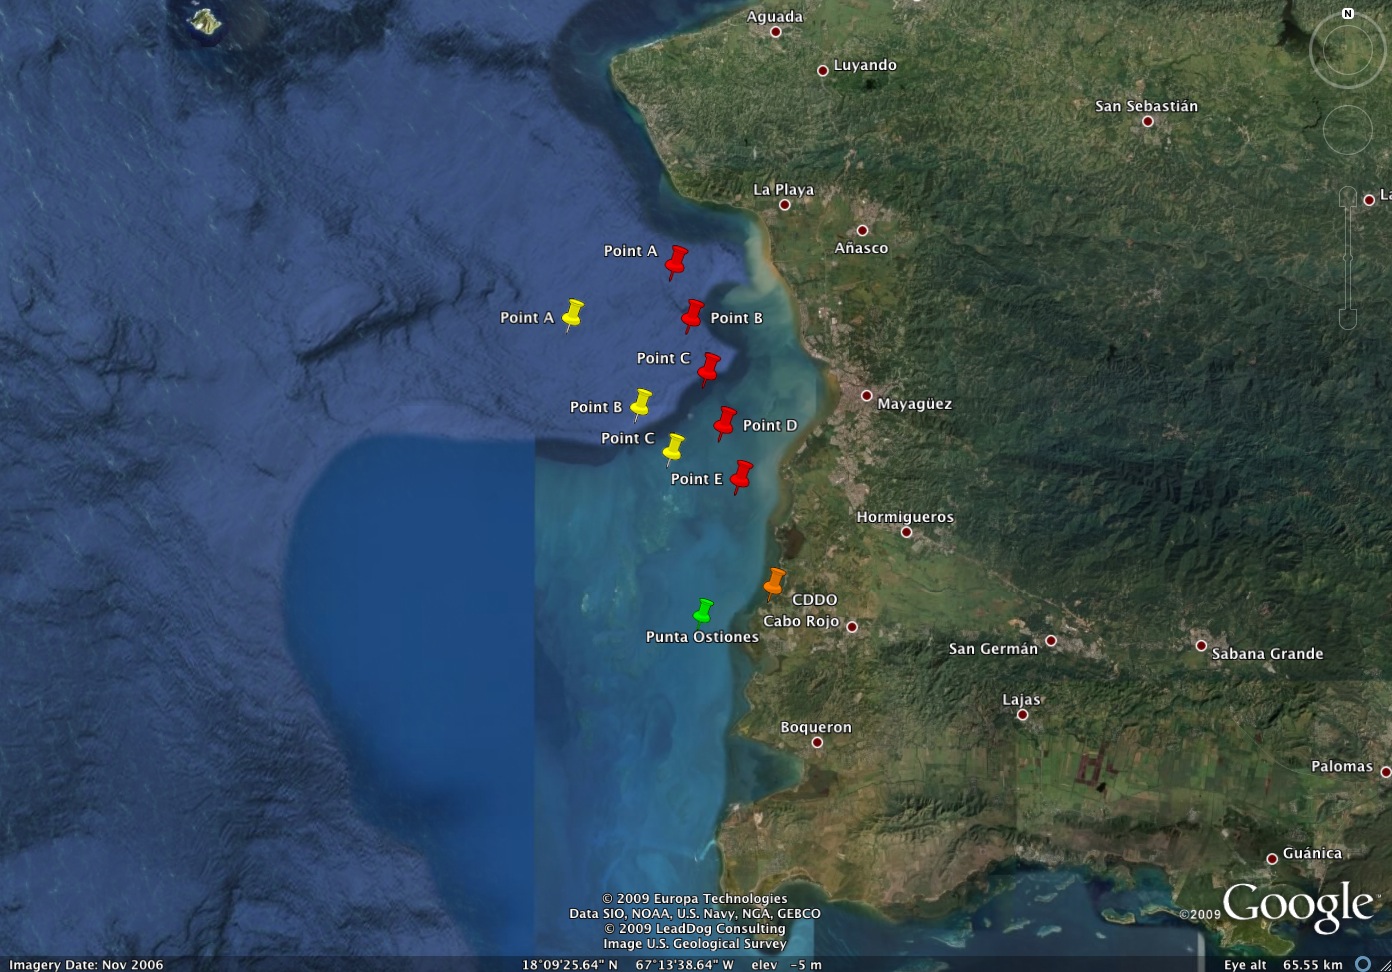
Posted on July 21st, 2009 No commentsTidal Analysis 3 compares NOAA current velocity predictions at Punta Ostiones with CODAR V component current velocity readings at 5 points oriented 343º from the station. Figure 1 shows five red placemarks labeled Point A through E, each one 3km or a range cell apart. Point A is located on range cell 6 while Point E is located on range cell 2. Yellow placemarks indicate the three points selected for Tidal Analysis 2.
Root mean square (RMS) speed differences between CODAR observations and NOAA predictions range from 28.7–8.4 cm/s. They improve significantly as we evaluate points closer to the CDDO station (e.g. At Point C an RMS speed difference of 21.1cm/s is found, at Point D the difference is 13.2 cm/s, and at Point E 8.4 cm/s). It is possible that bathymetry might be contributing substantially to this contrast. Correlation coefficients are highest at point A with a value of 0.8890. Other correlation coefficients range between 0.5385 and 0.6138.
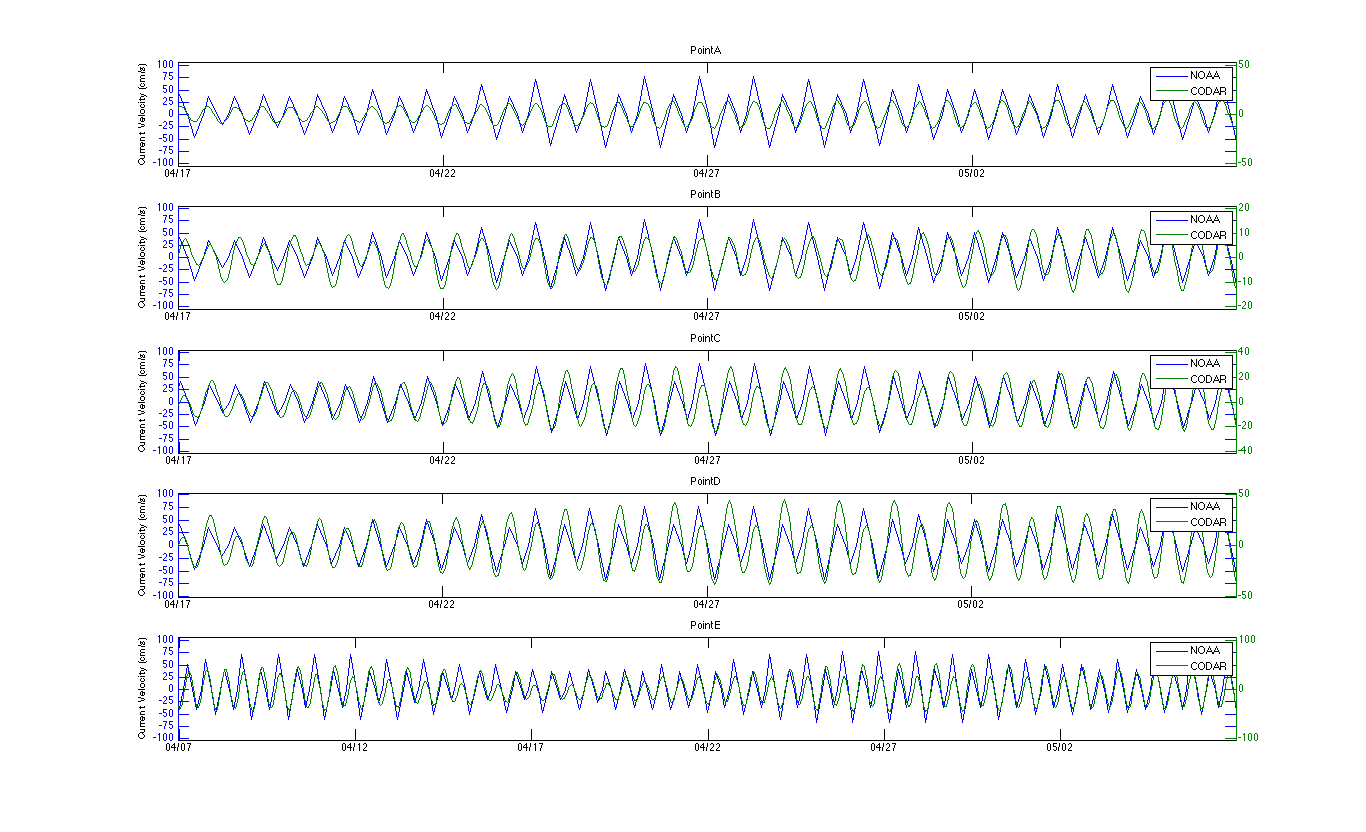
Figure 2 compares the graphical output of NOAA current velocity predictions at Punta Ostiones with CODAR observed current velocity at selected points.
Figure 1
Figure 2
Last 5 posts by admin
- Quality Control of Bistatic Signals - June 7th, 2012
- Radial Coverage for March 2012 - April 23rd, 2012
- ru23 as a drifter, Travis Analysis - February 14th, 2012
- Fisher Island - Ideal Pattern Results - February 2nd, 2012
- Yorktown Express - January 31st, 2012