


-
Hurricane Delta in the Regional Forecast Models
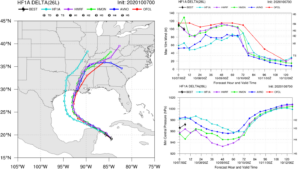
Posted on October 7th, 2020 No commentsRemarkable agreement this morning between the two operational hurricane forecast models HWRF and HMON. Both have similar tracks, something we see often, and this morning both are also agreeing on intensity plotted in the upper right in the figure below. Both HWRF and HMON (purple and green lines) have Hurricane Delta just below Category 4 as it crosses the warm waters of the Gulf. The 4 am CDT NHC Discussion notes that they are following the guidance from the stronger regional models, and we see that in the red line for the official forecast. The Discussion credits the high ocean heat content and the low upper level wind shear resulting in favorable conditions for an intense storm. Both models also rapidly drop in intensity after moving inland, but what happens just before landfall? The NHC Discussion highlights the importance of the competing ocean and upper level shear processes to decide if there will be any weakening just before landfall, noting there there is an increase in the upper level shear, and there is slightly less heat content in the ocean as the hurricane approaches the coast. The new experimental HAFS model, the light blue line below, has a more westward track and a significantly different intensity – lets mark that as a good discussion point for the winter reanalysis of this hurricane.
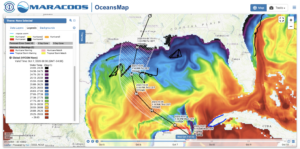
Below is the OceansMap view of that Sea Surface Temperature distribution. Delta if forecast to track right up through the center of the warmest surface temperatures in the western Gulf. It then crosses the slightly cooler waters approaching landfall, but even the blue shade below is above 27C. We do not see surface temperatures below 26C until right up by the coast. Also looks like we have 5 gliders nicely aligned cross track for the Hurricane Glider Picket Line, with 3 gliders spanning the track uncertainty cone, 2 gliders further off in the high wind areas to the left and right. The NHC Discussion notes that they expect Delta to grow in size as it approaches the northern Gulf.
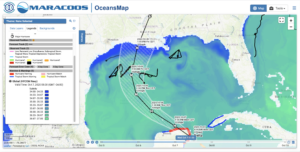
Next we look at the Sea Surface Salinity from the Navy GOFS Model. Look for any low salinity barrier layers that inhibit mixing and contribute to intensification. We see that the surface salinity is relative uniform across the Gulf with the low salinity barrier layers confined to the areas along the northern Gulf coast. So the band of slightly cooler surface waters that could promote weakening are also covered with a low salinity barrier layer that could promote intensification. Another test case for the winter reanalysis.
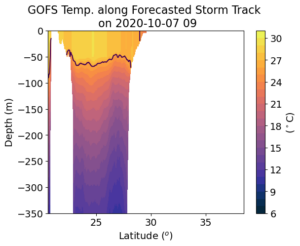
Now we look at the subsurface temperatures along track in the global ocean models where the ocean data assimilation takes place. The automated processing follows the hurricane track and plots the upper 350 m of the ocean temper field along the track. White areas are when the hurricane is over land. First is the Navy GOFS model that does the actual assimilation. The NOAA RTOFS model (second plot) looks back 2 days in the Navy model and then moves forward without assimilation but with the NOAA winds layered in. The global RTOFS then provides the initial condition for the coupled regional ocean model in HWRF and HMON. The first thing we note is that there is very little difference between the two models along the storm track – a good thing. The gliders and argo floats have all been deployed well in advance, and there has been plenty of time for the data to work its way into the assimilative model as well as the downstream NOAA forecast models. The two figures below also plot the location of the 26C isotherm as the black line. The depth of this isotherm used to calculate heat content is relatively constant across the Gulf, hovering around a depth of 50m-60m. Temperatures above the 26 C vary as you move north along the track but are relatively constant in the vertical in this upper layer down to this 26C isotherm. So SST is going to be a good proxy for the heat content variations pre-storm. We also see that only as the storm is crossing the shallow continental shelf waters nearshore does the temperature drop below 26C. Watching how this water reacts as the storm approaches is one thing we will be watching. As Delta approaches the coast from the south, these coastal waters will experience strong winds to the west. Alongshore winds to the west are downwelling favorable. Downwelling can move this cooler nearshore water off the shelf along the bottom, and replace it with warmer water transported in from offshore. Thus the hope that this band of cooler water may offer some protection assumes that the water is stationary, that it does not move. With strong nearly Cat 4 alongshore downwelling favorable winds from the leading edge of Delta, that water is going to move. Depending on the forward speed of Delta at the time, that water may have plenty of time to move well ahead of the eye passage. Just like we saw with the glider in Hurricane Sandy.

Last 5 posts by Scott Glenn
- Early Season in the Mid Atlantic - June 17th, 2021
- Disturbance in the Gulf - June 16th, 2021
- Hurricane Gliders 2021 - May 3rd, 2021
- Hurricane Iota - November 16th, 2020
- Hurricane Eta - Low Wind Shear, High SST - November 2nd, 2020
