-
The effect of the buildings
Posted on June 29th, 2010 No comments
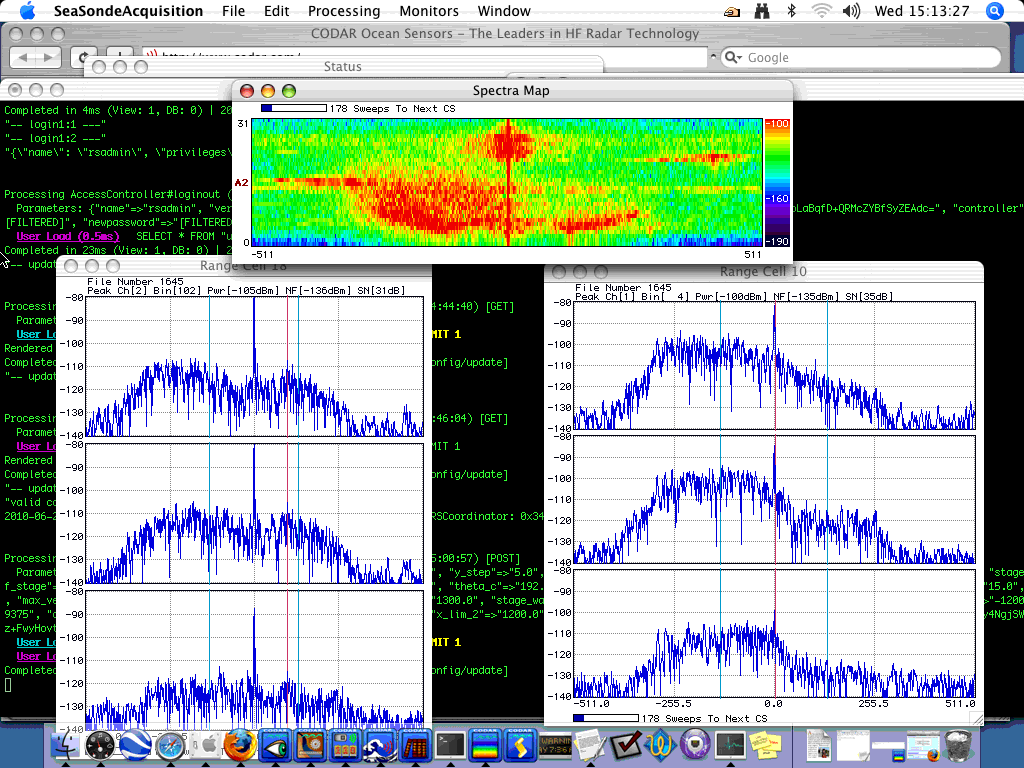
The above image shows the range of our riversonde. The system not only covers the entire width of the river but some range cells spread across the land on the other side(NYC). We know that the stationary buildings contribute to zero doppler shift. This is the reason y we see good smear in the range cells from about 25 to 32 at 0 hz. The fact becomes clear from the spectrogram below.
-
Aliasing
Posted on June 29th, 2010 No comments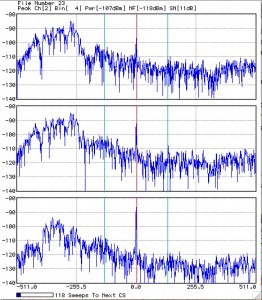
With 16 Hz and 512 Doppler Bins, the above image formed. Even though this graph indicates that a boat is traveling away from the Riversonde, it was actually traveling towards it. This is an example of aliasing, which is when the velocity of a boat is beyond the limits of the graph.