-
RiverSonde Geometry
Posted on June 21st, 2010 No commentsHere is an image that shows the geometry of the RiverSonde. The blue lines indicate the range rings, every 10 meters. The red lines indicate the angular bins, every 5 degrees.
I set the maximum range to 600 meters or 60 range cells. This only gets us half way across the river.

-
RiverSonde Computer Info
Posted on June 21st, 2010 No commentsThe ports on the back of the mac mini are from left to right:
- power
- ethernet
- fire wire http://en.wikipedia.org/wiki/IEEE_1394_interface
- DVI port for monitor
- 4 USB ports

The connector for the monitor that is there is for VGA

I can bring an adapter on wednesday or if someone can find one on stevens so much the better.
-
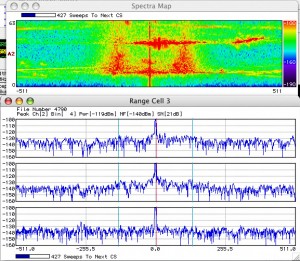
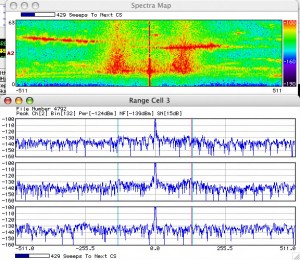
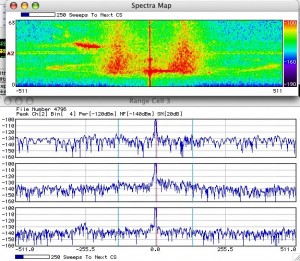
Corresponding Pictures of the Spectra
Posted on June 19th, 2010 No comments
-
-
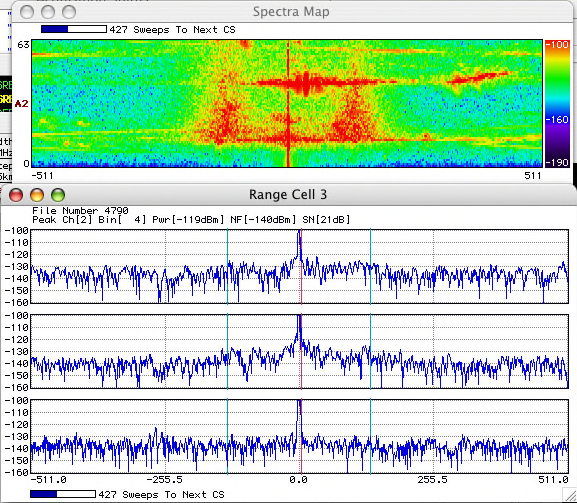
Ships are on the spectra map!
Posted on June 18th, 2010 No commentsThese are pictures of the spectra readings from this afternoon as ships passed by each other at the same time. We have video and additional pictures of this happening but you can clearly see the boats cross past each other in the spectra. One was at about 400 m and the other at 500 m
-
River Sonde Update: Friday, June 18
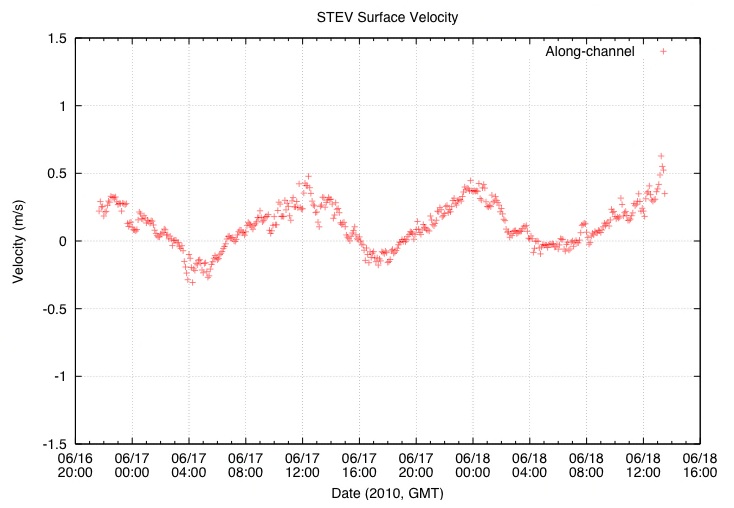
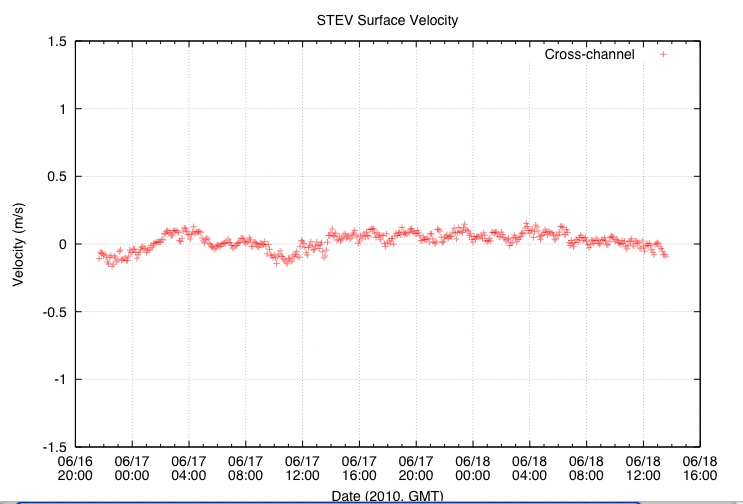
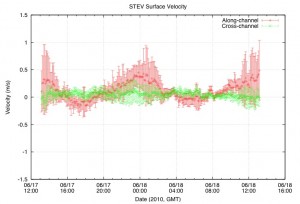
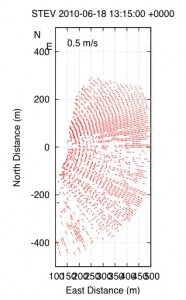
Posted on June 18th, 2010 No commentsBelow are general time series and radial plots over the last 24 hours. Positive along-shore velocities reflect water moving south towards the Hudson Estuary; positive cross-shore velocities reflect water traveling across towards NYC:
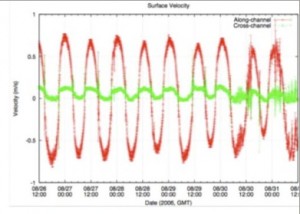
Even though we are pleased with the radial profile, we are skeptical about the along-shore and cross-shore measurements taken by the River Sonde. We were hoping for more clarity in our data (less standard deviation), but knowing how rapidly the physical properties of the Hudson change, the River Sonde might be giving accurate measures. According to the River Sonde manuel, a typical time series plot looks like:
The above plot is over five days, so we manipulated parameters on our own time series plot to (hopefully) look more like the above. Over 48 hours, the average along-shore and cross-shore velocities look as such:
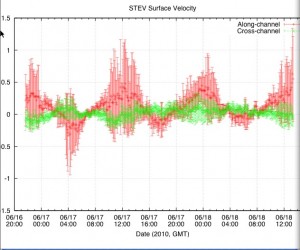
Time series over 48 hours
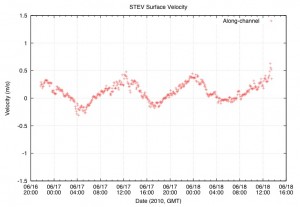
Along-shore average velocities over the last 48 hours
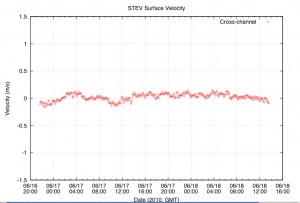
Cross-Shore average surface velocities over the last 48 hours
There are similarities between our measurements and ideal measurements, but there is still ambiguity in the data.
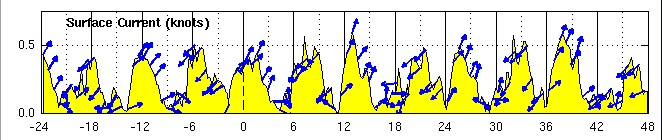
For more comparison, we are including the NYHOPS river model from the last 12 hours, and a prediction for the next 48 hours:

Assuming that the NYHOPS model are showing magnitudes of the velocity measurements, the River Sonde and NYHOPS model are comparable, and there are few discrepancies between them. Thus, we feel more confident in the River Sonde and its accuracy.
-The Radar Team
-
RiverSonde was not Transmitting
Posted on June 17th, 2010 No commentsI spoke with Hector at Codar yesterday and we got the RiverSonde working. I had turned off the transmitter when we were setting up the system because it is not good to transmit while the antenna is not connected to the amplifier. This is what the spectra should look like.

I learned yesterday that positive currents are to the right when behind the antenna. The antenna that transmits the signal is antenna 2. while behind the antenna, from left to right it is antenna 1, 2 then 3.
Here are the correct setting for Receiver controller. This application transmits the radio signal.

This is a simplified version of SeaSonde Controller.

-
Screen Shots from RiverSonde
Posted on June 16th, 2010 No commentsHere is the screen shot of the time series plot

Here is the screen shot of the profile plot

here is the screen shot of the latest radial map

-
THINGS TO DO FOR THE SUMMER
Posted on June 16th, 2010 No comments1. Install River Sonde
2. Verify if River Sonde is running properly
3. Determine if Riversonde can detect small vessels
4. Try to make river sonde work on top of the buiding HOWE.
5. try riversonde on the beach
6.coordinate an exercise with other teams.
-
SECTIONS FOR PAPER
Posted on June 16th, 2010 No commentsSECTION PEOPLE
1. ABSTARCT – EVERYONE
2. INTRODUCTION – ANGELICA
3. BACKGROUND – LENNY
4. HYPOTHESIS – DANIELLE
5. METHODOLOGY – OMAR
6. RESULTS – SHANKAR
7. DISCUSSION – DAKOTA -
RiverSonde Config Parameters
Posted on June 14th, 2010 No commentsHere are screen captures of the setup we did on friday June 11, 2010.