What is that, a cloud?
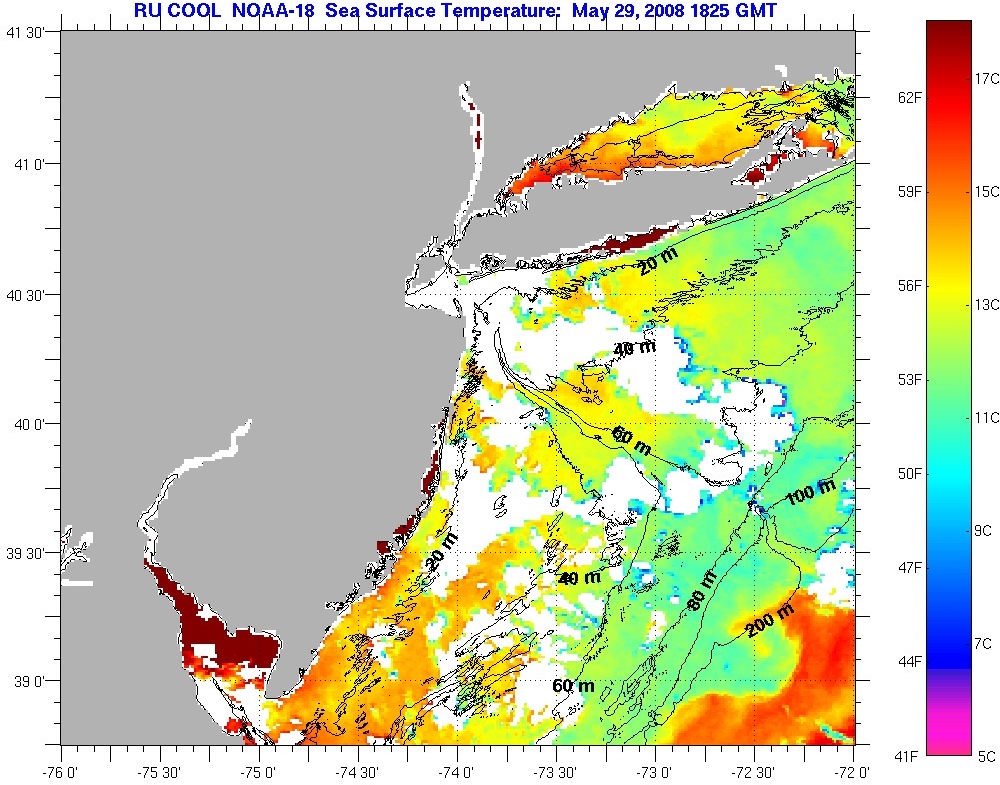
The satellites that send us data are travelling 500 to 23,000 miles above Earth. These satellites cannot see through clouds, so when there is a cloud above the earth, the satellite senses the temperature of the cloud and not the earth below it. Clouds are high up in the sky and are almost always cooler than the earth below. The farther you go up in altitude, the cooler it gets. Just ask a mountain climber. So, knowing that clouds are cool, look at the image below. The white areas are definitely clouds. They are so cold that they are off the temperature scale. Meanwhile, the ocean around them is green and yellow and orange. You can also see that the edges of the clouds let a little warmth through, but are still cold.
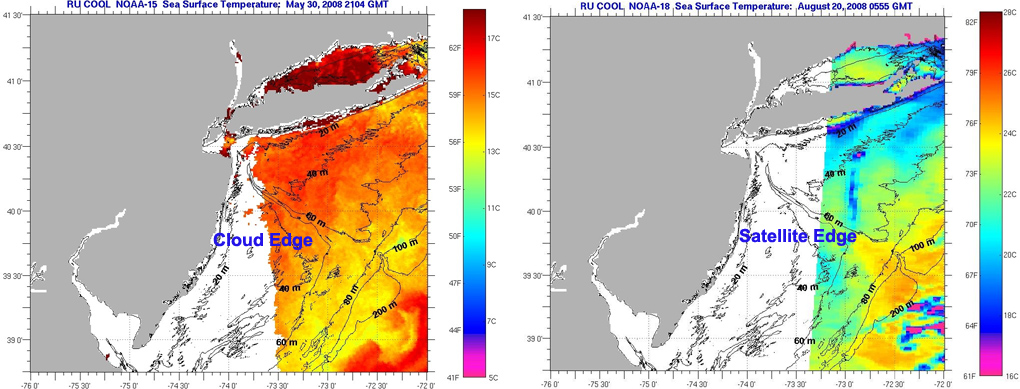
If you see an image with a straight line that divides the sea surface temperatures from a white area, this is the edge of the area that the satellite was capturing information. Most of our satellite data prior to 2022 has these occasional edges in the images. In the images below, compare the left-side image to the one on the right-side. Clouds aren’t usually super straight!
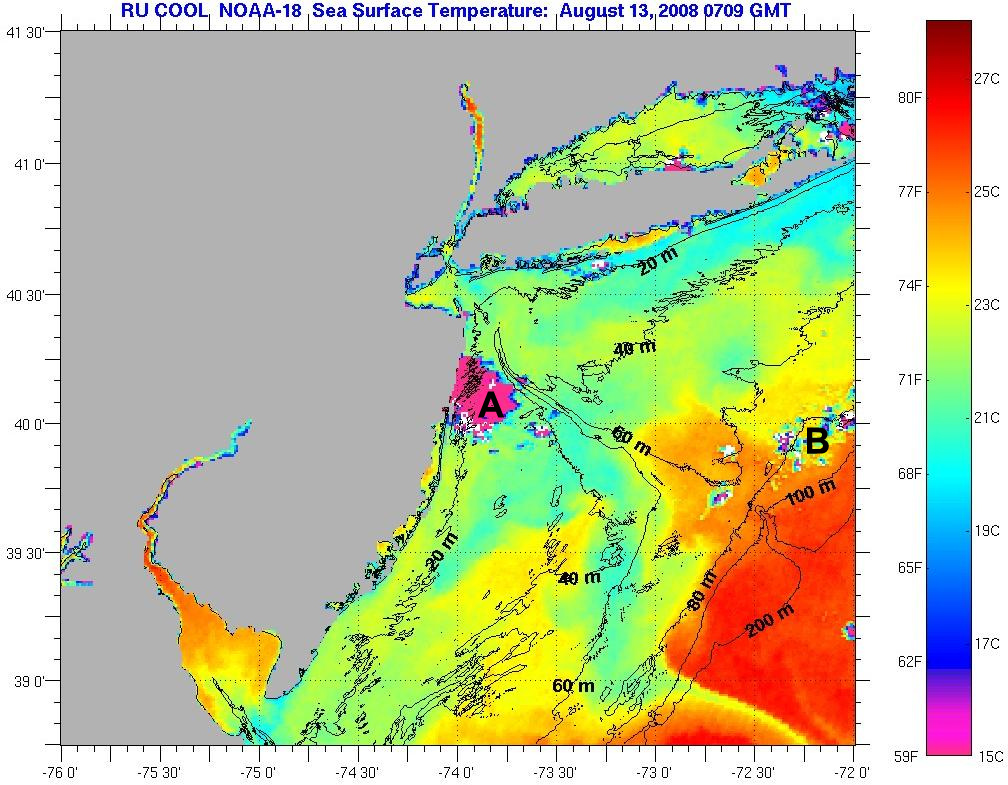
The August 13, 2008 image below has a couple more examples of what we might see. In many of the images you will notice dark pink areas (marked A here). These are cloudy areas that were not cold enough to be eliminated by the computer. The location, shape, and surrounding temperatures can help you tell them apart from very cold water. Sometimes the cloud cover doesn’t completely hide the sea temperatures below them, it just makes some areas look a bit cooler, like the area marked B. In these cases you might see some things don’t make sense as sea
surface temperatures.
There is another way to help identify clouds if you’re still not sure. Clouds move rapidly over the earth at speeds between 15 to 50 mph. Water currents move at less than 3 mph. So, the temperature patterns in the ocean should not change quickly. If you can compare two images that area few hours apart, you will know if a pattern is a cloud because it will not be in one of the two images.
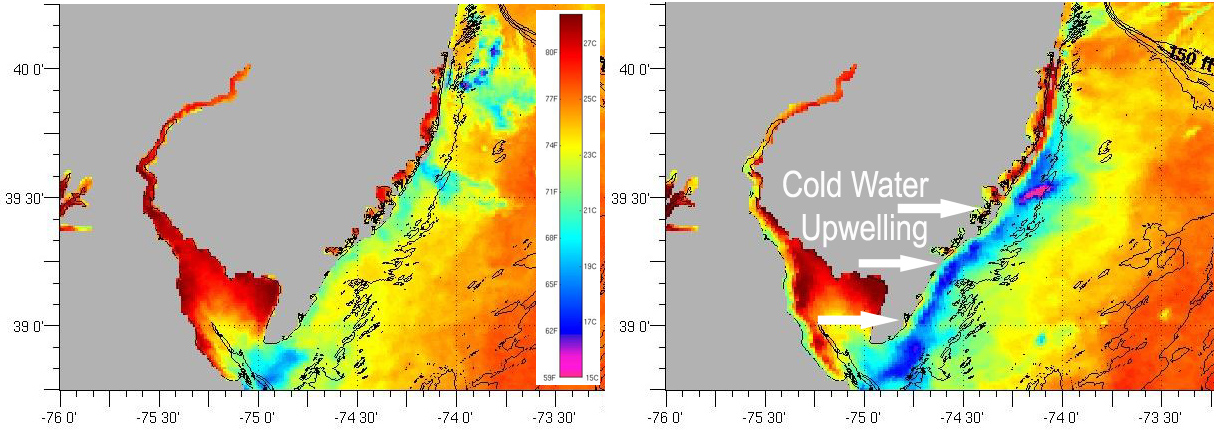
THE TEMPERATURE EXCEPTION- Upwelling – Sometimes during the summer, water from the ocean floor rises quickly from the bottom and can cool water temperatures 15 degrees in one day. The two images below show one such upwelling event. They are only 22 hours apart, but the coastal water temperature dropped 10 degrees! In our area, these upwellings only occur along the coast from June to early September.
Where are the fish?
Many of the people who have used our web site over the years are fishermen and fishing boat captains. Everything we are about to tell you, is based on what we have learned from them. Thank you to the sea-goers who use our site!
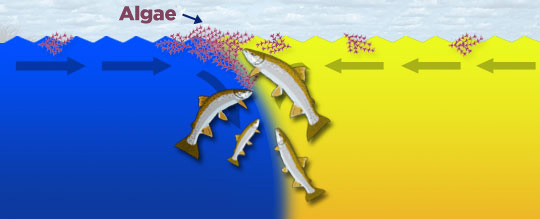
On any day of the year, plenty of algae are floating on the ocean surface. These plants are food for small fish. The small fish are food for medium size fish. Finally, the medium fish are food for the big boys (Tuna, Mahimahi, etc). So, if you think about it, generally speaking, wherever there’s a lot of seaweed at the surface, you will probably find some sort of big fish down below. The tough part is finding these seaweed lines.
When you see huge temperature differences in an image, there are usually surface currents pushing toward each other in an area we call a convergence zone. The surface water, and everything in it, pushes together. When two water masses push towards one another, it’s kind of like two conveyor belts facing each other (figure 6). But seaweed and algae float so they begin to pile up at the surface in large lines. Got it? The bottom line: Temperature fronts generally equal some fish