The Rutgers University Weather Research and Forecasting Model (RU-WRF)
Since 2011, the Rutgers University Center for Ocean Observing Leadership (RUCOOL) has conducted extensive research on the Mid Atlantic Bight (MAB) offshore wind resource, the ocean processes that influence its variability, and engagement with a diverse group of stakeholders. This research is supported by the New Jersey Board of Public Utilities (NJBPU). A cornerstone of these efforts has been the development and application of the Rutgers University Weather Research and Forecasting Model (RU-WRF). This model has been instrumental in generating innovative products, datasets, and modeling tools that delineate the oceanic and atmospheric processes unique to New Jersey. This regional implementation of the Weather Research and Forecasting Model comprises three nested model domains with horizontal resolutions of 9 km, 3 km, and 1 km.
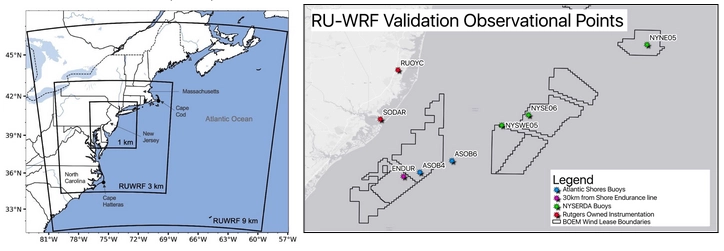
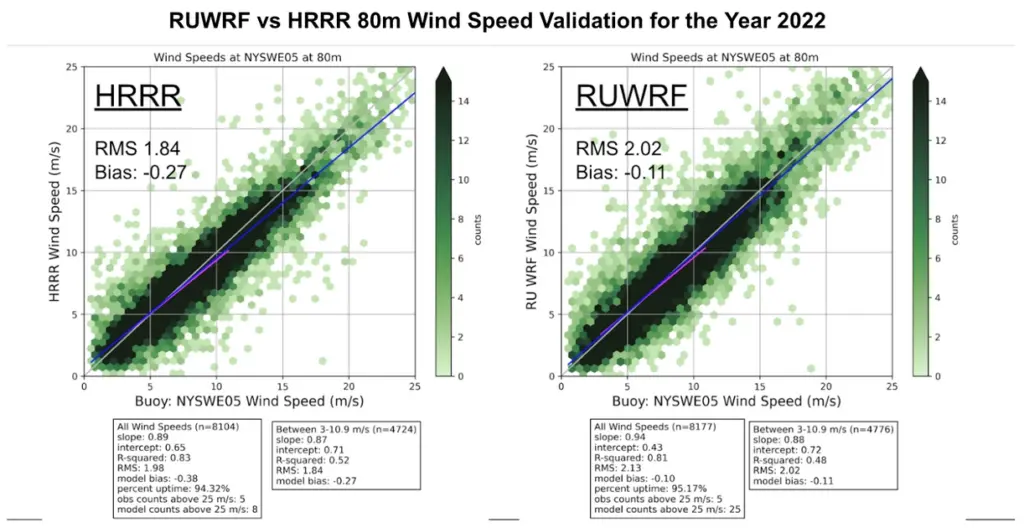
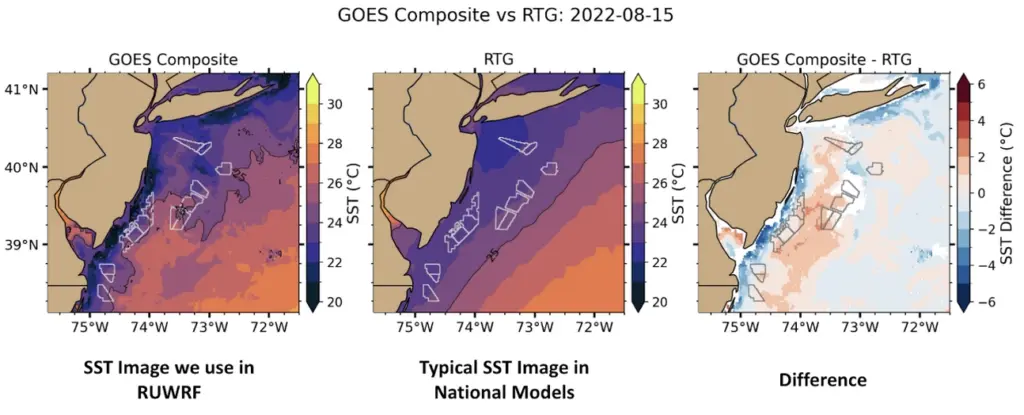
In 2019, the model’s configuration and performance were validated and optimized through a partnership with the National Renewable Energy Laboratory (NREL), utilizing data from five floating lidar buoys off the coast of New Jersey and comparisons with national forecast models. The validation emphasized the model’s innovative integration of high-resolution satellite sea surface temperature data and a tailored planetary boundary layer scheme, which significantly enhanced its capacity to capture critical local phenomena such as sea breezes and upwelling. The performance of RU-WRF has proven to match or surpass that of leading national models, including the High Resolution Rapid Refresh Forecast Model (HRRR), in this region. For more details see Validation of RU-WRF, the Custom Atmospheric Mesoscale Model of the Rutgers Center for Ocean Observing Leadership
The current NREL-validated version of the RU-WRF modeling system includes four years of 3D continuous hourly atmospheric simulations centered on New Jersey wind lease areas, spanning from December 2018 to February 2023. The data encompasses variables such as wind speed, direction, temperature, pressure, and an array of associated variables from the sea surface and across the wind-swept area of current and future offshore wind turbines throughout the MAB. RU-WRF is a numerical weather prediction model that outputs 3-day forecasts at 3km resolution and 5-day forecasts at 9km resolution. The “best” dataset, which includes the first 24-hour forecast each day for both 3km and 9km resolutions for the entire four years, has been presented and made accessible in collaboration with NJBPU to a wide range of stakeholders, including offshore wind developers, PJM, policymakers, decision-makers, and members of the public and scientific community. Data layers can be viewed via the Mid Atlantic Ocean Data Portal. The subset model data can be accessed through our RU-WRF THREDDS page along with python data access examples.
Offshore Wind Research
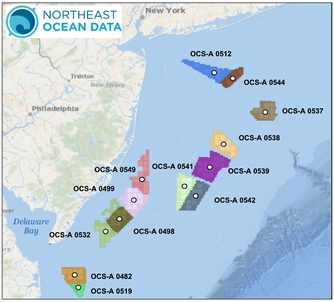
Over the last year, curated datasets and meteorological site characterizations have been carried out by the RUWRF team across all MAB lease area centroids. Pre-developed products that serve as a baseline turbine hub-height (160m) wind resource analysis of the 4-year 3km dataset are available for viewing and download. This includes figures of annual, seasonal, monthly, and daily wind speeds and power estimates. This data, along with our expertise in its development, has been utilized for planning and policy purposes, including the 2020 NJ Wind Energy Master Plan and the upcoming 2025 Master Plan, and through the MARCO and MARACOOS data portals. Additionally, the RU-WRF dataset has been leveraged to secure additional funding opportunities through the National Offshore Wind Research and Development Consortium (NOWRDC) for projects such as the “AI-powered Physics-based Tool for Offshore Wind Forecasting and Grid Integration” (AI-RUWRF), and a new project funded through the NJ Research and Monitoring Initiative titled “An Investigation of Potential Impacts of Wind Turbines and Foundations on the Cold Pool.”
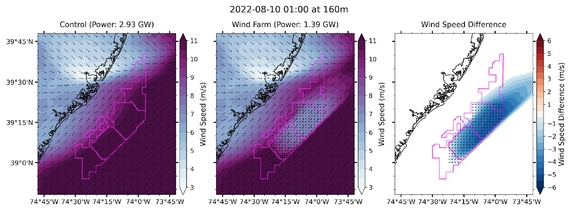
In addition to the extensive 3km and 9km dataset, Rutgers has completed and archived a full year of 1 km resolution RUWRF model hindcast runs beginning in March 2022 through February 2023, both with and without turbine wind farm effects parameterized for the nearshore NJ lease areas. (See information on the Fitch Parameterization here: https://github.com/wrf-model/WRF/blob/master/doc/README.windturbine). Utilizing a 1 km model resolution and simulated turbines, RUCOOL has conducted extensive case studies on wind farm power production, wind wake effects, storm scenarios, and more. These studies aim to enhance our understanding of the wind resource available to NJ ratepayers and its variability, both short-term (hours to days) and long-term (seasonal to annual), thereby aiding in strategic planning and development of offshore wind.
Data Links
RUWRF NREL Validation Report: https://www.nrel.gov/docs/fy20osti/75209.pdf
RUWRF Thredds Catalog: https://tds.marine.rutgers.edu/thredds/cool/ruwrf/catalog.html
RUWRF Python Tutorials: https://github.com/rucool/wind-energy-tutorials
RUWRF Validation Figures and Lease Centroid Products: https://rucool.marine.rutgers.edu/windenergy/public/