


-
Three Oceans Under Cristobal
Posted on June 16th, 2020 No commentsWe have multiple ocean models in the coupled atmosphere-ocean hurricane forecast workflow:
- The Navy Global Ocean Forecast System (GOFS3.1) – “It starts with us” to quote the Naval Oceanographic Command. This is were the data assimilation takes place.
- The NOAA global Real Time Ocean Forecast System (RTOFS) – derived from GOFS3.1 where the NOAA global winds are layered in.
- Regional Hybrid Coordinate Ocean Model (HYCOM )- derived from RTOFS where the high resolution processes are layered in to properly respond to the intense hurricane forecasting.
- Regional Princeton Ocean Model (POM) – currently initialized with climatology modified by feature models for the Loop Current and Eddies. Note that the climatology modified by feature models is scheduled to be retired July 1, 2020 and be replaced by an ocean derived from one of the RTOFS (items 2 or 5).
- The NOAA global Real Time Ocean Forecast Model with Data Assimilation (RTOFS-DA) – this is the data assimilative version of RTOFS. The Data Assimilation (DA) scheme is derived from the Navy Coupled Ocean Data Assimilation (NCODA) scheme, but some adjustments. The biggest difference with NCODA is how altimetry is assimilated. NCODA assimilates the altimetric sea surface heights by transforming them into temperature and salinity profiles using the Improved Synthetic Ocean Profiles (ISOP) and assimilating the synthetic profiles as “super obs”. RTOFS-DA assimilates the sea surface height (causing a barotropic pressure change throughout the water column), then adjusts the isopycnal layer thicknesses (to adjust the baroclinic pressure) to produce no total pressure change at the bottom. The result is that RTOFS-DA and NCODA (used in GOFS) have two different ways to adjust the subsurface temperature and salinity fields. This is important because Argo floats provide us the large scale thermal and salinity structure of the ocean, the altimeter data layers in the Mighty Mesoscale, and the underwater gliders fly in to tidy up the fuzzy spots. Three critical steps in our efforts to provide the hurricane models with the best representation of the ocean possible. RTOFS-DA changes how we do the critical step of layering in the Mesoscale, making this an important piece of our summer research.
Now the important step, an ongoing collaboration between Maria at Rutgers and Hyun-Sook and Zulema at NWS. They are an awesome team dedicated to improving the ocean side of the hurricane forecast models. None of this would be possible if these three scientists were not actively collaborating and talking to each other multiple times a week.
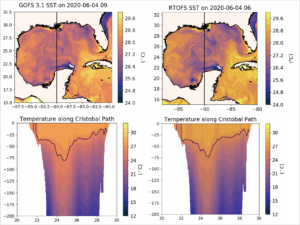
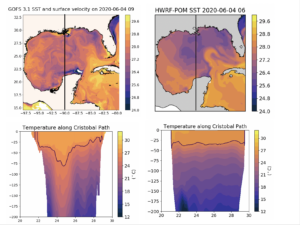
Maria has prepared two views of each of the different model oceans that were available for Tropical Storm Cristobal. Each model is represented as a column in the figures. The top row is a map of the surface temperature in the Gulf of Mexico immediately before the passage of Cristobal. The bottom row is the vertical temperature section of the upper 200 m from south to north along 90W, the approximate track Cristobal was about to follow across the Gulf.
The first plot below compares GOFS3.1 (model 1- where data assimilation takes place) with RTOFS (model 2- where nosaa winds are layered in). As expected, the two models look very similar in both the map view and the vertical section. The important feature is warm anticyclonic Loop Current Eddy centered at 25N, 9oW.
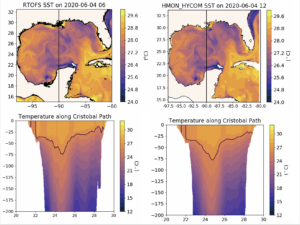
Next we move from the global RTOFS (model 2) to regional HYCOM (model 3). Regional HYCOM is the ocean in the “Hurricanes in a Multi-scale Ocean-coupled Non-hydrostatic (HMON)”. The US is required to operate two official hurricane models and HMON is one of them. In the figure below we see that the regional HYCOM that HMON is coupled to looks very much like ROTFS which looks very much like GOFS. This is the way the workflow is designed to work, – get the best available assimilation, get the best available winds, and get the ocean into the high resolution models we need – setting up the best initial condition for the ocean before the hurricane even enters the region. HMON has the best ocean the Navy and NOAA – working together – can provide.
Now we look at the second of the two hurricane models, the Hurricane Weather Research and Forecast (HWRF) model. HWRF is one of the highest performing hurricane models in the global ensemble. In the Atlantic Basin, the ocean model that HWRF is coupled to is the Princeton Ocean Model (POM). The Princeton Ocean Model is not initialized using the GOFS to RTOFS to HYCOM workflow described above. In the Atlantic Basin, it is initialized using climatology modified by feature models for the Loop Current and Eddies. Comparing the maps below, we see that the Loop Current is in the wrong location based on the satellite altimetry, and the Loop Current Eddy is not present at all. The POM model under HWRF appears to be initialized by climatology only.
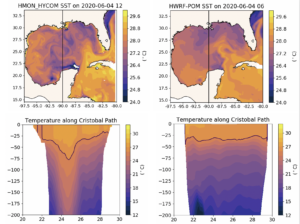
This is a significant dilemma. One of our required hurricane models, HMON, is coupled to the best ocean Navy and NOAA can provide. And our other hurricane model, HWRF, one of the global leaders in hurricane forecasting, is coupled to a climatological ocean that does not include the Essential Ocean Features impacting hurricane intensity. We look forward to the next update of operational HWRF scheduled for July 1, 2020.
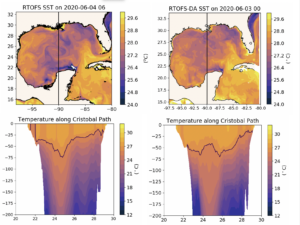
Enter RTOFS-DA (model 5 above). Can we reduce the distance between the data assimilative model and the regional scales we need to resolve the Essential Ocean Processes. RTOFS-DA is currently running at NWS in an experimental mode. In the figure below, we have the operational ROTFS in the left column and the experimental RTOFS-DA in the right column. The Loop Current is a bit different, but not disturbingly different like it is in the climatology. And both models have the warm anticyclonic Loop Current Eddy near 25N, 90W. But there are differences in the eddy structure. In the deeper part of the temperature section, say between 50 m and 200 m, the Loop Current Eddy is stronger in ROTFS-DA. So at depth, one has a stronger eddy, one has a weaker eddy, but both have an eddy, so we are doing good. But what about the upper 50 m. Here we see differences in the structure of the eddy in the water warmer than 26C (the black line in the bottom row of plots). The 26C isotherm domes up in the middle of the eddy like is does in a cold core ring with cyclonic circulation. The impact on the surface map is we don’t see the swirling motion of the alternating bands of warm and cold water wrapping around the eddy due to the clockwise surface circulation that we see in RTOFS. No this is an important difference for hurricane forecasting since it is the water above 26C that contributes to the calculated Ocean Heat Content (OHC). And maps of the OHC are used by the forecasters at the National Hurricane Center to alert them to potential regions where hurricanes may intensify. The operational RTOFS has a maximum in the Ocean Heat Content in the center of the Loop Current Eddy. And the Experimental RTOFS-DA has a local minimum in the Ocean Heat Content in the center of the eddy. These are two very different answers, and provide the NHC forecasters with very different guidance. So now we have work to do. Which one is right and why?
-
OceansMap view of Cristobal
Posted on June 6th, 2020 No commentsHere are two quick views of Cristobal from OceansMap.
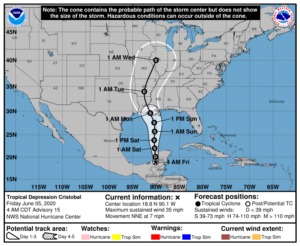
First we look at the current position and track of Cristobal over the Navy GOFS 3.1 model forecast for today’s Sea Surface Temperature. Cristobal is currently on the southern side of the Anticyclonic warm Loop Current Eddy. It will take most of today (Saturday) to cross over the eddy. Official NHC forecast has the intensity at 40 knots. The forecast is for a slight increase in intensity by about 11 mph as it crosses the Gulf with landfall Sunday.
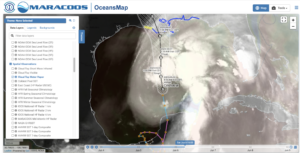
But Cristobal is a very broad storm as seen in the satellite cloud top water vapor product below, with the strongest convection to the north and east. The official NHC warnings extend well to the east of the expected landfall region.
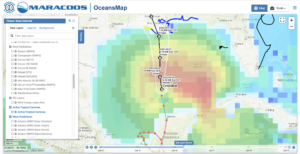
To get an idea of the scale of the impacts of this broad storm, we can check the global NOAA Wavewatch III model. The modeled waves indicate that this is a full-Gulf event.
-
Two Different Oceans
Posted on June 5th, 2020 No commentsBelow is a side by side comparison of the two oceans we have been looking at for the last 24 hours. The left hand column is the Navy’s data assimilative Global Ocean Forecast System (GOFS) 3.1. Right column is the regional-scale Princeton Ocean Model (POM) initialized using Loop Current and Eddy features models to adjust climatology. The top row is a map of the Sea Surface Temperature (SST). The black line running south to north along 90W is the approximate forecast path of TS Cristobal. Bottom row is the vertical temperature section along the 90W line between the surface and 200 m depth.
-
HWRF-POM initialized with climatology and feature models
Posted on June 5th, 2020 No commentsThe last few blogs talked about what we see in the Navy GOFS 3.1, the data assimilative step on the ocean side of the coupled atmosphere-ocean hurricane models. My blog post from May 15, 2020 describes the multi-step process that gets us to the operational models. GOFS3.1 is the data assimilation step. This information flows into Global RTOFS to layer on the NOAA global windfields. But remember, these both are global models, their job is through data assimilation and the good windfields to get the Essential Ocean Features in the right locations. We then initialize a high resolution regional ocean model capable of resolving the Essential Ocean Processes that impact hurricane intensity during the rapid co-evolution phase of the atmosphere and ocean subject to intense hurricane forcing.
Another path to the regional scale ocean model underneath the hurricane is the feature model initialization process. Here climatology is modified by typical structural models for key Essential Ocean Features. In the Gulf of Mexico, a forecaster provides 3 points to describe the location of the Loop Current, and the a model for a typical Loop Current is inserted. For the warm eddies, climatology is modified by inserting bowl shaped structures to represent the warm core.
Here we investigate the results of that feature model initialization procedure used in the most recent HWRF-POM coupled forecast for Cristobal. The first image below is the Sea Surface temperature for the POM ocean model coupled to the HWRF atmospheric model. We see the Loop Current is present, but it looks to be shifted west of the Loop Current seen in the data assimilative GOFS or in the CoastWatch altimetry product. It definitely is not up against the West Florida Shelf as it exits the Gulf. Along the 90W line we have been talking about, the water is relatively warm on much of the Yucatan Shelf, with some upwelling occurring on the shelf. But as you head north along 90W and leave the Yucatan Shelf, you encounter some of the coldest water in the Gulf. The large warm eddy observed in GOFS and the CoastWatch altimetric product centered near 25N, 90W is absent from POM.

So lets layer on the surface currents to search for the structures in the current field. The GOFS experience taught us that the SST may be confusing due to surface processes, and that the sea surface height and the surface currents are better for identifying the eddies. Below is a plot of the POM ocean model SST and Surface currents. The Loop Current is certainly present, but the anticyclonic circulation we have been talking about since last night is absent.
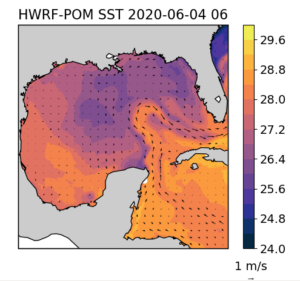
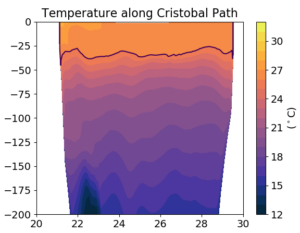
Ok, so lets just move straight to the subsurface section running from south to north along 90W. There is no bowl shaped warm core ring in the temperature section running from the Yucatan Shelf to the Louisiana Shelf. The 26C isotherm is pretty shallow, hovering around 30 m deep. Also wondering where the continental shelves on the north and south are. Looks like more to investigate.
-
An Argo Float from the critical Warm Eddy
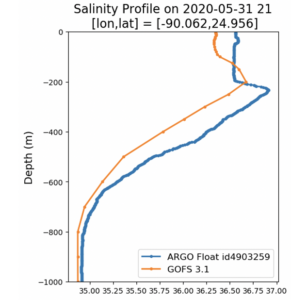
Posted on June 5th, 2020 No commentsHere we look back on the Argo floats locations for the last 20 days. Looking for one closer to the eddy center. So we chose one near 25N, 90W.
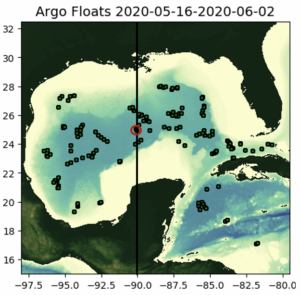
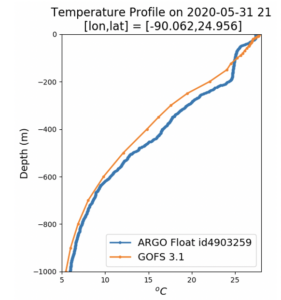
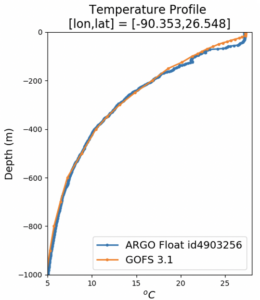
For the temperature comparison, we see the near surface region is similar in magnitude but with multiple mixed layers in temperature in the Argo data. Profiles at the depths below 600 m are also similar, but the main warm core of the eddy between 100 m and 600 m is different. Argo data is warmer than the model. Perhaps this is a true temperature difference, or perhaps it is simply a difference in location. That the real world Argo profile may be closer to the center of the eddy than the same location in the model. To help answer this question, it is often good to look at the profiles relative to an eddy center based coordinate system. We can do that in the model. More difficult in the data when you only have a single float profile and you can’t direct the float into the eddy center.
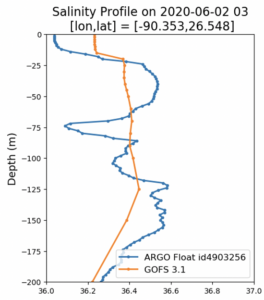
The same discussion applies to salinity. The core of the anticyclonic eddy is warm and salty. The Argo float is saltier than the model. Maybe the Argo float is closer to the eddy center? The Argo salinity profile also has a deeper mixed layer than the model. Is this a difference in surface mixing? or maybe it is part of the banding we see in the circulation around the eddy. Easier to check in the model. More difficult when you are dealing with a single profile instead of a cross-section through an eddy.
-
A quick check of the Satellite Altimetry
Posted on June 5th, 2020 No commentsHere is my new favorite place to look for satellite altimeter products in the Gulf of Mexico, the NOAA AOML site:
https://www.aoml.noaa.gov/phod/dhos/altimetry.php
I have been a long term user of the CCAR altimeter products for the Gulf, but I am not seeing it. Maybe our GCOOS friends have a recommendation for their go-to site for satellite altimetry. Was very happy to find this CoastWatch site from our friends at AOML. It has exactly the confirmation information we are seeking on the pre-storm ocean conditions.
In a previous blog post, we plotted the Sea Surface Height (SSH), and the surface currents, from the GOFS 3.1 model, noting that the Essential Ocean Features impacting hurricane intensity are well defined by SSH. Below is the CoastWatch altimeter product that plots the SSH (orange is high elevation, blue is low elevation) and the resulting geostrophic currents. The Loop Current flowing into and out of the Gulf is on the lower right. Nearly centered at 25N, 90W, is the large, warm core, Loop Current Eddy that Cristobal is forecast to track across tomorrow. Farther north and to the right of the forecast hurricane track is the Warm Eddy located just off the Florida panhandle continental shelf. In between the two warm, Anticyclonic eddies with the high elevations is the smaller area of low elevation associated with the cyclonic cold feature just south of the birdfoot. We clearly see the impact of the satellite altimeter in the data assimilative GOFS model.
It looks like we are being given a well designed laboratory experiment with a tropical storm tracking directly over the center of a warm Anticyclonic ring. Except that this one is real.
A next step will be to look for any of the operational regional HWRF runs that use the feature model initialization approach, and compare to the operational data-assimilative global GOFS model.
-
Argo Floats in the Gulf
Posted on June 5th, 2020 No commentsNational Hurricane Center forecasters still have Cristobal following the 90W latitude line north across the Gulf starting this weekend
Here is a look at the Argo Floats in the Gulf that recently reported profiles between June 1-4. There are a couple near the north to south line along 90W.

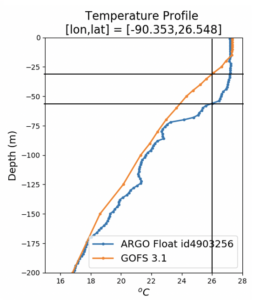
Below is a quick look at the first temperature profile compared to the Navy GOFS version 3.1. Everything below 200 m looks to be spot on. Above 200 m the observed Argo profile is a bit warmer, with a deeper mixed layer.
Zooming into the upper 200m, we can see the details of the warmer ARGO profile. Both have the same mixed layer temperature, but the mixed layer depth is less than 20 m and the argo float has it closer to 40 m. Using the depth of the 26C isotherm as another metric, we see it is about 30 m depth in GOFS and about 55 m deep in the Argo data.
Now for the salinity comparison. As with temperature, the salinity comparison between GOFS and the Argo Float look very similar. In the upper 200 m, the salinity is much more variable. So lets zoom into the surface layer.
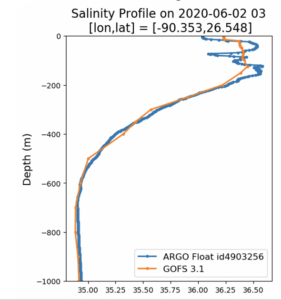
Below we zoom into the upper 200 m. Here the big question is the barrier layer. Temperature is nearly uniform down to a depth of about 50 m in the same profile, but the salinity profile indicates that there is a thin surface layer of low salinity water that is uncorrelated with the temperature. This is the critical barrier layer that inhibits mixing due to the resulting stratification. If we only had temperature observations, we might assume that the surface mixed layer is unstratified, and free to mix with the cold water below. The good news is that we do see the lower surface salinity in the GOFS model, but in the model, the low salinity surface layer is about 20 m deep and the temperature mixed layer is about 20 m deep. So the characteristics of the barrier layer are different. Salinity and temperature are well correlated in the upper layer of model, and are independent in the upper layer of the data.
More comparisons to come as we work through the day.
-
Forecast Tropical Storm Cristobal
Posted on June 4th, 2020 No commentsIt starts with the National Hurricane Center, with a forecast track for Cristobal going up the Yucatan Peninsula, across the Gulf of Mexico and into the Gulf Coast.
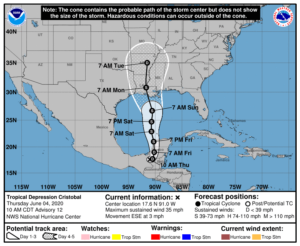
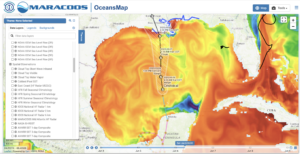
I then turn to my favorite product visualizer, the MARACOOS OceansMap. Below is a map of the forecast track for Cristobal over the bathymentry of the Gulf of Mexico. Here we see that Cristobal is forecast to travel over the shallow Yucatan Shelf Saturday morning, then cross the very steep Campeche Escarpment into deep water. Cristobal then spends Saturday afternoon through Sunday morning over the deep Gulf of Mexico. On Sunday afternoon Cristobal starts making its way across the Louisiana – Texas continental shelf towards eventual landfall.
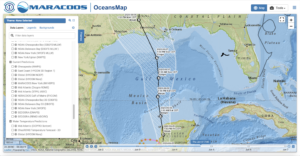
Next we use OceansMap to look for the Essential Ocean Features impacting hurricane intensity. The Essential Ocean Features in the Gulf of Mexico are the very warm Loop Current, the warm and cold eddy features, and the fresh water from the Mississippi. The Loop current enters the Gulf through the Yucatan Straits between Mexico and Cuba, forms and inverted U shaped loop inside the Gulf, and exits the Gulf through the Straits of Florida between the Keys and Cuba. The largest Loop Current Eddies break off from the Loop Current and travel Westward across the Gulf through the deepwater region noted above. Below we look for these Essential Ocean Features using OceansMap.
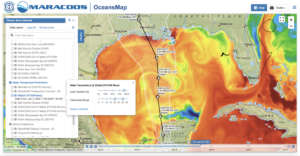
In OceansMap we first bring up the Navy Global Ocean Forecast System version 3.1, based on the HYCOM model. This is the model that assimilates all the ocean data for the hurricane forecasts, making it the critical first step in getting the ocean right. The nice thing about OceansMap is that the images can be manipulated in my web browser, so I can vary the enhancement. Below we have plotted the GOFS 3.1 Sea Surface Temperature field and adjusted the color bar to highlight temperatures between 20C (blue) and 30C (red). The warm Loop Current is easy to see entering the Gulf, extending somewhat less than half way north, and sharply turning back south, running along the West Florida Shelf to exit through the Florida Straits. We then move to identifying the eddies in our census of Essential Ocean Features. The most critical are known as Anticyclonic Eddies due to their clockwise circulation patterns. They are also known as Warm Eddies, since they have a deep warm subsurface structure that we don’t see in these surface maps, and warm water is the fuel for hurricane intensity. Looking for regions of clockwise circulation we see two, one large area right under the forecast track of Cristobal. Cristobal is forecast to be over this warm water feature Saturday 1 pm to Sunday 1 am. This is the location to watch. The other clockwise circulation feature is to the right of the storm track up against the West Florida Escarpment. The next set of Essential Ocean Features are the Cyclonic Eddies, with counterclockwise circulation and a subsurface structure that is cold. The cold water in these eddies have the effect of trying to weaken the storm. One of these Cyclonic Eddies are located just south of Louisiana birdfoot, between the two Anticyclonic eddies noted above. There also appears to be very cold upwelled water on the shallow water of the Yucatan Shelf, and in the shallow water of the West Florida Shelf.
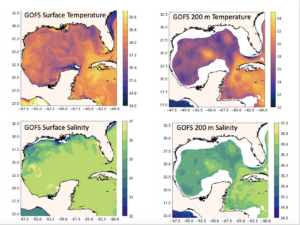
The OceansMap view of the Essential Ocean Features in the Gulf of Mexico prompts us to look deeper into Navy GOFS 3.1 model. Below are plots of the temperature (top row) and salinity (bottom row) from GOFS model on June 4, 2020. Surface values are on the right column and values at 200 m depth are in the left column. For surface temperature (upper right) the features seen in OceansMap are reproduced. They include the Loop Current, the two Anticyclonic eddies, and the one Cyclonic eddy in between. Looking at the temperature at 200 m depth, a depth below the seasonal thermocline, we see these features are well defined by their temperature structure. The anticyclonic eddies defined by their circulation at the surface are well defined by their warm cores. The cyclonic eddy is well defined by its cold core.
Now we look at the salinity in the bottom row. The surface salinity shows us the location of the Essential Ocean Features called barrier layers. These layers are barriers to mixing and enable the ocean to stay warm longer, contributing more to the intensification of the hurricane than it would if no barrier layer was present. In this view of the surface salinity, we see the Mississippi River plume and how it is spread along the Louisiana-Texas continental shelf. At 200 m, below the seasonal thermocline & halocline, the subsurface salinity map highlights different features than in the surface map. The large scale Loop Current and Eddies that we see in the 200 m temperature layer are reinforcing the way we define the anticyclonic eddies – that they have warm, high salinity waters that extend well below the surface.
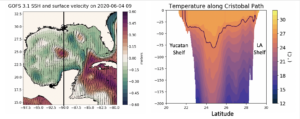
Below we look at a map of the sea surface height (SSH) on the left. The surface circulation we are using to define the Anticyclonic and cyclonic eddies is related to the variations in sea surface height. Anticyclonic circulation occurs around a high (red color) in the SSH. Cyclonic circulation occurs around the low elevations (blue) in the SSH. The eddies are very visible in the SSH fields, which illustrates the importance of the satellite altimeters to define the Essential Ocean Features in the Gulf of Mexico.
On the right we show a vertical temperature section running from south to north along 90W marked by the black line in the SSH map. In the vertical temperature section, the 26C isotherm is marked by the black line. In this case, 26C is also near the base of the surface mixed layer. The 26C isotherm is typically 25m to 40 m deep, except within the warm core ring, where the 26C isotherm extends to a depth of about 80 m. We also see that most of the variability in the model is in the upper 100 m. At about 200 m, the water is relatively cool except for the warm water in the core of the ring.
-
TS Arthur tracks along the Gulf Stream
Posted on May 19th, 2020 No commentsBelow is the view of Tropical Storm Arthur in the MARACOOS OceansMap. https://oceansmap.maracoos.org/
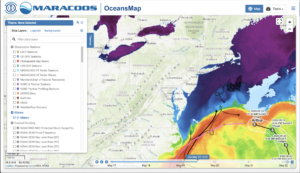
The track of Arthur follows the warm water of the Gulf Stream observed in the satellite SST. Arthur is forecast to now turn more towards the south. Arthur tracked close to 2 gliders that were flying in the Gulf Stream, Silbo operated by TWR and a spray glider operated by WHOI. Silbo in black is shown leaving the Gulf Stream to the north while the Spray glider in gray continues west with the Stream. Currents from the MARACOOS HF Radar network on the Mid Atlantic shelf are strong and alongshore towards the south.

A quick look at the global model temperature profiles as Glider Silbo leaves the Gulf Stream looks like a much faster departure in the models than in the real world. We’ll look more at the slope sea comparison when the glider is out of the Stream in both the model and real world conditions. Plots from all the gliders can be viewed at https://rucool.marine.rutgers.edu/hurricane/Hurricane_season_2020/
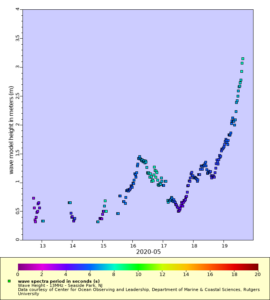
NHC warnings included heavy surf along the Mid Atlantic coast from Arthur. Some of the HF Radar systems in the Mid Atlantic are set up to monitor waves in real time and send the data to the NWS forecast offices. Above is one example of HF Radar derived waves along the NJ coast at Seaside Park, the first site to break 3 m. Waves from the NDBC sites further offshore are approaching 9 ft. The full HF Radar waves dataset can be accessed at
https://marine.rutgers.edu/~hroarty/maracoos/ERDDAP_MAB_HFR_Wave_Data_v2.html
-
TS Arthur forecast to turn just south of the gliders
Posted on May 18th, 2020 No comments
Tropical Storm Arthur is forecast to move parallel to the North Carolina coast today. The morning forecast discussion from the National Hurricane Center indicates that “Arthur is moving near and almost parallel to the Gulf Stream”. Several gliders are deployed in the slope sea or Gulf Stream just north of the forecast track, with glider Silbo being in the most southern position.

In the above figure temperature profiles from the global models are compared to glider Silbo. Profiles from the U.S. data assimilative GOFS and the operational RTOFS have similar features and agree well above 400 m and below 800 m. The transition between the 18C water near 300 m depth and the 7C water near 800 m depth is often related to differences in the position of the Gulf Stream. The global model from Copernicus starts near the same surface temperature, likely due to similar satellite Sea Surface Temperatures being assimilated, and is similar in the deep water at 1000 m, but what happens in between is has a very different shape.
