


-
Three Oceans Under Cristobal
Posted on June 16th, 2020 No commentsWe have multiple ocean models in the coupled atmosphere-ocean hurricane forecast workflow:
- The Navy Global Ocean Forecast System (GOFS3.1) – “It starts with us” to quote the Naval Oceanographic Command. This is were the data assimilation takes place.
- The NOAA global Real Time Ocean Forecast System (RTOFS) – derived from GOFS3.1 where the NOAA global winds are layered in.
- Regional Hybrid Coordinate Ocean Model (HYCOM )- derived from RTOFS where the high resolution processes are layered in to properly respond to the intense hurricane forecasting.
- Regional Princeton Ocean Model (POM) – currently initialized with climatology modified by feature models for the Loop Current and Eddies. Note that the climatology modified by feature models is scheduled to be retired July 1, 2020 and be replaced by an ocean derived from one of the RTOFS (items 2 or 5).
- The NOAA global Real Time Ocean Forecast Model with Data Assimilation (RTOFS-DA) – this is the data assimilative version of RTOFS. The Data Assimilation (DA) scheme is derived from the Navy Coupled Ocean Data Assimilation (NCODA) scheme, but some adjustments. The biggest difference with NCODA is how altimetry is assimilated. NCODA assimilates the altimetric sea surface heights by transforming them into temperature and salinity profiles using the Improved Synthetic Ocean Profiles (ISOP) and assimilating the synthetic profiles as “super obs”. RTOFS-DA assimilates the sea surface height (causing a barotropic pressure change throughout the water column), then adjusts the isopycnal layer thicknesses (to adjust the baroclinic pressure) to produce no total pressure change at the bottom. The result is that RTOFS-DA and NCODA (used in GOFS) have two different ways to adjust the subsurface temperature and salinity fields. This is important because Argo floats provide us the large scale thermal and salinity structure of the ocean, the altimeter data layers in the Mighty Mesoscale, and the underwater gliders fly in to tidy up the fuzzy spots. Three critical steps in our efforts to provide the hurricane models with the best representation of the ocean possible. RTOFS-DA changes how we do the critical step of layering in the Mesoscale, making this an important piece of our summer research.
Now the important step, an ongoing collaboration between Maria at Rutgers and Hyun-Sook and Zulema at NWS. They are an awesome team dedicated to improving the ocean side of the hurricane forecast models. None of this would be possible if these three scientists were not actively collaborating and talking to each other multiple times a week.
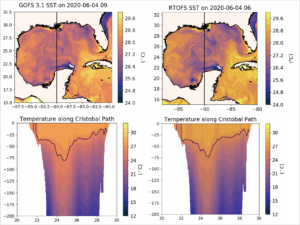
Maria has prepared two views of each of the different model oceans that were available for Tropical Storm Cristobal. Each model is represented as a column in the figures. The top row is a map of the surface temperature in the Gulf of Mexico immediately before the passage of Cristobal. The bottom row is the vertical temperature section of the upper 200 m from south to north along 90W, the approximate track Cristobal was about to follow across the Gulf.
The first plot below compares GOFS3.1 (model 1- where data assimilation takes place) with RTOFS (model 2- where nosaa winds are layered in). As expected, the two models look very similar in both the map view and the vertical section. The important feature is warm anticyclonic Loop Current Eddy centered at 25N, 9oW.
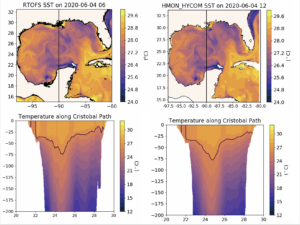
Next we move from the global RTOFS (model 2) to regional HYCOM (model 3). Regional HYCOM is the ocean in the “Hurricanes in a Multi-scale Ocean-coupled Non-hydrostatic (HMON)”. The US is required to operate two official hurricane models and HMON is one of them. In the figure below we see that the regional HYCOM that HMON is coupled to looks very much like ROTFS which looks very much like GOFS. This is the way the workflow is designed to work, – get the best available assimilation, get the best available winds, and get the ocean into the high resolution models we need – setting up the best initial condition for the ocean before the hurricane even enters the region. HMON has the best ocean the Navy and NOAA – working together – can provide.
Now we look at the second of the two hurricane models, the Hurricane Weather Research and Forecast (HWRF) model. HWRF is one of the highest performing hurricane models in the global ensemble. In the Atlantic Basin, the ocean model that HWRF is coupled to is the Princeton Ocean Model (POM). The Princeton Ocean Model is not initialized using the GOFS to RTOFS to HYCOM workflow described above. In the Atlantic Basin, it is initialized using climatology modified by feature models for the Loop Current and Eddies. Comparing the maps below, we see that the Loop Current is in the wrong location based on the satellite altimetry, and the Loop Current Eddy is not present at all. The POM model under HWRF appears to be initialized by climatology only.
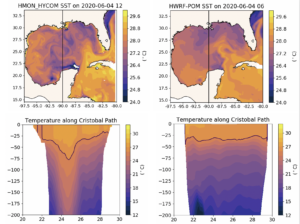
This is a significant dilemma. One of our required hurricane models, HMON, is coupled to the best ocean Navy and NOAA can provide. And our other hurricane model, HWRF, one of the global leaders in hurricane forecasting, is coupled to a climatological ocean that does not include the Essential Ocean Features impacting hurricane intensity. We look forward to the next update of operational HWRF scheduled for July 1, 2020.
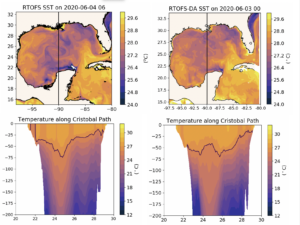
Enter RTOFS-DA (model 5 above). Can we reduce the distance between the data assimilative model and the regional scales we need to resolve the Essential Ocean Processes. RTOFS-DA is currently running at NWS in an experimental mode. In the figure below, we have the operational ROTFS in the left column and the experimental RTOFS-DA in the right column. The Loop Current is a bit different, but not disturbingly different like it is in the climatology. And both models have the warm anticyclonic Loop Current Eddy near 25N, 90W. But there are differences in the eddy structure. In the deeper part of the temperature section, say between 50 m and 200 m, the Loop Current Eddy is stronger in ROTFS-DA. So at depth, one has a stronger eddy, one has a weaker eddy, but both have an eddy, so we are doing good. But what about the upper 50 m. Here we see differences in the structure of the eddy in the water warmer than 26C (the black line in the bottom row of plots). The 26C isotherm domes up in the middle of the eddy like is does in a cold core ring with cyclonic circulation. The impact on the surface map is we don’t see the swirling motion of the alternating bands of warm and cold water wrapping around the eddy due to the clockwise surface circulation that we see in RTOFS. No this is an important difference for hurricane forecasting since it is the water above 26C that contributes to the calculated Ocean Heat Content (OHC). And maps of the OHC are used by the forecasters at the National Hurricane Center to alert them to potential regions where hurricanes may intensify. The operational RTOFS has a maximum in the Ocean Heat Content in the center of the Loop Current Eddy. And the Experimental RTOFS-DA has a local minimum in the Ocean Heat Content in the center of the eddy. These are two very different answers, and provide the NHC forecasters with very different guidance. So now we have work to do. Which one is right and why?
Last 5 posts by Scott Glenn
- Early Season in the Mid Atlantic - June 17th, 2021
- Disturbance in the Gulf - June 16th, 2021
- Hurricane Gliders 2021 - May 3rd, 2021
- Hurricane Iota - November 16th, 2020
- Hurricane Eta - Low Wind Shear, High SST - November 2nd, 2020
