


-
Argo Floats in the Gulf
Posted on June 5th, 2020 No commentsNational Hurricane Center forecasters still have Cristobal following the 90W latitude line north across the Gulf starting this weekend
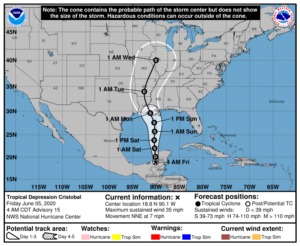
Here is a look at the Argo Floats in the Gulf that recently reported profiles between June 1-4. There are a couple near the north to south line along 90W.

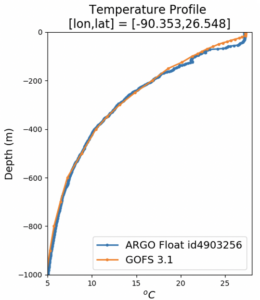
Below is a quick look at the first temperature profile compared to the Navy GOFS version 3.1. Everything below 200 m looks to be spot on. Above 200 m the observed Argo profile is a bit warmer, with a deeper mixed layer.
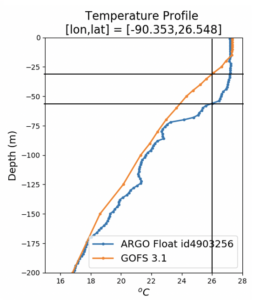
Zooming into the upper 200m, we can see the details of the warmer ARGO profile. Both have the same mixed layer temperature, but the mixed layer depth is less than 20 m and the argo float has it closer to 40 m. Using the depth of the 26C isotherm as another metric, we see it is about 30 m depth in GOFS and about 55 m deep in the Argo data.
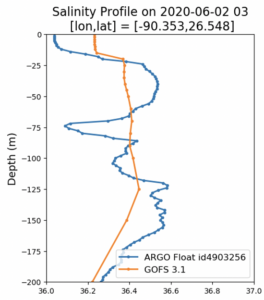
Now for the salinity comparison. As with temperature, the salinity comparison between GOFS and the Argo Float look very similar. In the upper 200 m, the salinity is much more variable. So lets zoom into the surface layer.
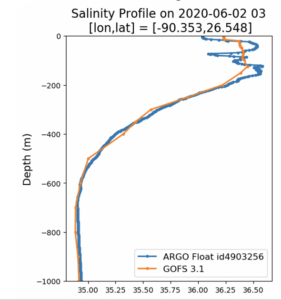
Below we zoom into the upper 200 m. Here the big question is the barrier layer. Temperature is nearly uniform down to a depth of about 50 m in the same profile, but the salinity profile indicates that there is a thin surface layer of low salinity water that is uncorrelated with the temperature. This is the critical barrier layer that inhibits mixing due to the resulting stratification. If we only had temperature observations, we might assume that the surface mixed layer is unstratified, and free to mix with the cold water below. The good news is that we do see the lower surface salinity in the GOFS model, but in the model, the low salinity surface layer is about 20 m deep and the temperature mixed layer is about 20 m deep. So the characteristics of the barrier layer are different. Salinity and temperature are well correlated in the upper layer of model, and are independent in the upper layer of the data.
More comparisons to come as we work through the day.
Last 5 posts by Scott Glenn
- Early Season in the Mid Atlantic - June 17th, 2021
- Disturbance in the Gulf - June 16th, 2021
- Hurricane Gliders 2021 - May 3rd, 2021
- Hurricane Iota - November 16th, 2020
- Hurricane Eta - Low Wind Shear, High SST - November 2nd, 2020
