


-
Forecast Tropical Storm Cristobal
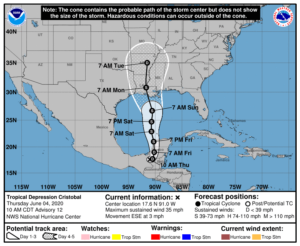
Posted on June 4th, 2020 No commentsIt starts with the National Hurricane Center, with a forecast track for Cristobal going up the Yucatan Peninsula, across the Gulf of Mexico and into the Gulf Coast.
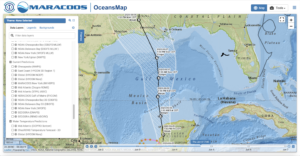
I then turn to my favorite product visualizer, the MARACOOS OceansMap. Below is a map of the forecast track for Cristobal over the bathymentry of the Gulf of Mexico. Here we see that Cristobal is forecast to travel over the shallow Yucatan Shelf Saturday morning, then cross the very steep Campeche Escarpment into deep water. Cristobal then spends Saturday afternoon through Sunday morning over the deep Gulf of Mexico. On Sunday afternoon Cristobal starts making its way across the Louisiana – Texas continental shelf towards eventual landfall.
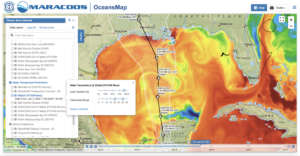
Next we use OceansMap to look for the Essential Ocean Features impacting hurricane intensity. The Essential Ocean Features in the Gulf of Mexico are the very warm Loop Current, the warm and cold eddy features, and the fresh water from the Mississippi. The Loop current enters the Gulf through the Yucatan Straits between Mexico and Cuba, forms and inverted U shaped loop inside the Gulf, and exits the Gulf through the Straits of Florida between the Keys and Cuba. The largest Loop Current Eddies break off from the Loop Current and travel Westward across the Gulf through the deepwater region noted above. Below we look for these Essential Ocean Features using OceansMap.
In OceansMap we first bring up the Navy Global Ocean Forecast System version 3.1, based on the HYCOM model. This is the model that assimilates all the ocean data for the hurricane forecasts, making it the critical first step in getting the ocean right. The nice thing about OceansMap is that the images can be manipulated in my web browser, so I can vary the enhancement. Below we have plotted the GOFS 3.1 Sea Surface Temperature field and adjusted the color bar to highlight temperatures between 20C (blue) and 30C (red). The warm Loop Current is easy to see entering the Gulf, extending somewhat less than half way north, and sharply turning back south, running along the West Florida Shelf to exit through the Florida Straits. We then move to identifying the eddies in our census of Essential Ocean Features. The most critical are known as Anticyclonic Eddies due to their clockwise circulation patterns. They are also known as Warm Eddies, since they have a deep warm subsurface structure that we don’t see in these surface maps, and warm water is the fuel for hurricane intensity. Looking for regions of clockwise circulation we see two, one large area right under the forecast track of Cristobal. Cristobal is forecast to be over this warm water feature Saturday 1 pm to Sunday 1 am. This is the location to watch. The other clockwise circulation feature is to the right of the storm track up against the West Florida Escarpment. The next set of Essential Ocean Features are the Cyclonic Eddies, with counterclockwise circulation and a subsurface structure that is cold. The cold water in these eddies have the effect of trying to weaken the storm. One of these Cyclonic Eddies are located just south of Louisiana birdfoot, between the two Anticyclonic eddies noted above. There also appears to be very cold upwelled water on the shallow water of the Yucatan Shelf, and in the shallow water of the West Florida Shelf.
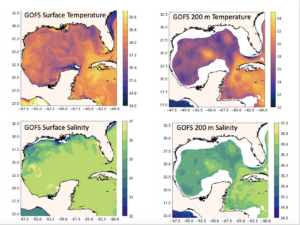
The OceansMap view of the Essential Ocean Features in the Gulf of Mexico prompts us to look deeper into Navy GOFS 3.1 model. Below are plots of the temperature (top row) and salinity (bottom row) from GOFS model on June 4, 2020. Surface values are on the right column and values at 200 m depth are in the left column. For surface temperature (upper right) the features seen in OceansMap are reproduced. They include the Loop Current, the two Anticyclonic eddies, and the one Cyclonic eddy in between. Looking at the temperature at 200 m depth, a depth below the seasonal thermocline, we see these features are well defined by their temperature structure. The anticyclonic eddies defined by their circulation at the surface are well defined by their warm cores. The cyclonic eddy is well defined by its cold core.
Now we look at the salinity in the bottom row. The surface salinity shows us the location of the Essential Ocean Features called barrier layers. These layers are barriers to mixing and enable the ocean to stay warm longer, contributing more to the intensification of the hurricane than it would if no barrier layer was present. In this view of the surface salinity, we see the Mississippi River plume and how it is spread along the Louisiana-Texas continental shelf. At 200 m, below the seasonal thermocline & halocline, the subsurface salinity map highlights different features than in the surface map. The large scale Loop Current and Eddies that we see in the 200 m temperature layer are reinforcing the way we define the anticyclonic eddies – that they have warm, high salinity waters that extend well below the surface.
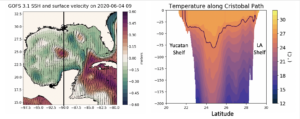
Below we look at a map of the sea surface height (SSH) on the left. The surface circulation we are using to define the Anticyclonic and cyclonic eddies is related to the variations in sea surface height. Anticyclonic circulation occurs around a high (red color) in the SSH. Cyclonic circulation occurs around the low elevations (blue) in the SSH. The eddies are very visible in the SSH fields, which illustrates the importance of the satellite altimeters to define the Essential Ocean Features in the Gulf of Mexico.
On the right we show a vertical temperature section running from south to north along 90W marked by the black line in the SSH map. In the vertical temperature section, the 26C isotherm is marked by the black line. In this case, 26C is also near the base of the surface mixed layer. The 26C isotherm is typically 25m to 40 m deep, except within the warm core ring, where the 26C isotherm extends to a depth of about 80 m. We also see that most of the variability in the model is in the upper 100 m. At about 200 m, the water is relatively cool except for the warm water in the core of the ring.
Last 5 posts by Scott Glenn
- Early Season in the Mid Atlantic - June 17th, 2021
- Disturbance in the Gulf - June 16th, 2021
- Hurricane Gliders 2021 - May 3rd, 2021
- Hurricane Iota - November 16th, 2020
- Hurricane Eta - Low Wind Shear, High SST - November 2nd, 2020
