


-
Two Different Oceans
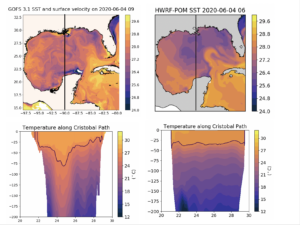
Posted on June 5th, 2020 No commentsBelow is a side by side comparison of the two oceans we have been looking at for the last 24 hours. The left hand column is the Navy’s data assimilative Global Ocean Forecast System (GOFS) 3.1. Right column is the regional-scale Princeton Ocean Model (POM) initialized using Loop Current and Eddy features models to adjust climatology. The top row is a map of the Sea Surface Temperature (SST). The black line running south to north along 90W is the approximate forecast path of TS Cristobal. Bottom row is the vertical temperature section along the 90W line between the surface and 200 m depth.
Last 5 posts by Scott Glenn
- Early Season in the Mid Atlantic - June 17th, 2021
- Disturbance in the Gulf - June 16th, 2021
- Hurricane Gliders 2021 - May 3rd, 2021
- Hurricane Iota - November 16th, 2020
- Hurricane Eta - Low Wind Shear, High SST - November 2nd, 2020
