


-
A good day for data assimilation
Posted on August 23rd, 2020 No commentsLet’s now look at Navy Glider NG645. Part of the annual Hurricane Glider Picket Line. The glider that is closest to the forecast track of Marco and Laura before the hurricane comes through.
Remember that the Hurricane Glider Picket Line has two purposes. The first purpose is to act in a coordinated fashion to resolve the Essential Ocean Features that impact hurricane intensity in each region that the hurricanes may pass over. This requirement to have a realistic ocean model forecast exists whether there is a hurricane or not, and benefits all users of the ocean model, including hurricane forecasters and models. The second purpose is to have at least one glider, and hopefully more, in place to witness the rapid evolution of the ocean as the hurricane passes. This provides data for the process and sensitivity studies that help improve the forecast models of the future. The two purposes have different sampling requirements, and the gliders have the flexibility for both.
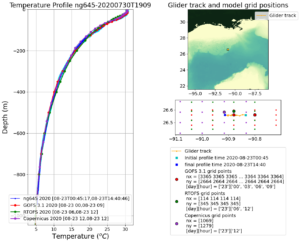
The first plot below is the temperature profiles provided by Navy Glider ng645 compared to the Navy global ocean model GOFS, the NOAA global ocean model RTOFS, and the European global ocean model Copernicus. My immediate impression is that the glider and the data assimilation schemes are doing their jobs. The daily spread in the glider profiles is nearly imperceptible, as is the difference between the US and European models. We see the surface layer of warm water above 26C is well less than 100 m deep, a shallow warm layer as expected based on the Sea Surface Height maps we looked in yesterday’s blog post. Our older textbooks say Marco will cool this layer through vertical mixing and leave a cooler ocean behind for Laura.
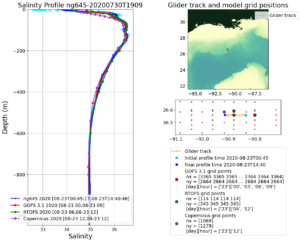
Now let’s look at salinity. Navy Glider ng645 daily salinity profile spread in light blue and the daily average in dark blue are compared to the three operational global models. Again, the differences are imperceptible. All the global models have a proper shape for the salinity profile, and even include a shallow fresh water barrier layer in the upper 40 m. The new textbook says this barrier layer is going to inhibit the mixing, so that Marco will not cool the ocean as much as expected, leaving behind a less cooled ocean for Laura. The Navy glider was out well before the storm, and there was plenty of time for the data to work its way through the system and into the models through the data assimilation system. The ocean model at the beginning of the hurricane forecast value chain, the Navy’s data assimilative GOFS model, could not be more ready. The Navy glider, and the Navy data assimilation into GOFS, is fulfilling the first purpose of the Hurricane Glider Picket Line as described above.
Tomorrow, and throughout the week, we watch Navy Glider ng645 fulfill the second purpose of the Hurricane Glider Picket Line to capture the rapid evolution of the ocean as two hurricanes pass over it.
-
Ocean conditions for Marco and Laura
Posted on August 23rd, 2020 No commentsBoth Marco and Laura are forecast to intensify as they cross the Gulf and approach the coast of Louisiana. Lets check the ocean conditions they are encountering (Marco) or will encounter (Laura).
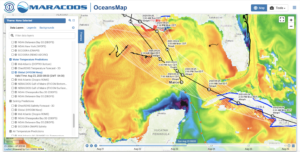
First we look at Sea Surface Temperature (SST) from the data assimilative Navy GOFS model. Here the temperature scale ranges from 25C to 32C. Marco is already over the Loop Current and Laura will pass over it. Both storms will be crossing over some of the warmest sea surface temperatures in the northern Gulf off the coast of Louisiana. A good contrast in what Marco will do to the deep warm waters of the Loop Current compared to the shallow warm waters of the northern Gulf before Laura passes over them.
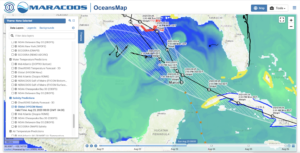
Below is the Sea Surface Salinity (SSS) map for the Gulf, with the color scale going from 34 to 37. The low surface salinity waters of the Mississippi River are evident on the Texas, Louisiana, Mississippi, Florida shelf. Our experience in the Caribbean during Isaias reminds us that the low salinity barrier layers inhibit mixing, resulting in less cooling of the surface waters, and greater potential to intensify the hurricanes.
Another natural experiment on the coupled ocean-atmosphere response to 2 hurricanes will unfold over the next few days. In our textbooks, we are told that the first hurricane is supposed to mix and cool the waters so the second hurricane has less warm water to promote intensification. But the warm water in the south is the deep Loop Current that does not cool rapidly. And the warm water is blanketed by a low salinity barrier layer that inhibits mixing. The storms will be passing by Navy Glider NG645 which has been on station this season as part of the annual Hurricane Glider Picket Line. Again, much more to learn if we form the research teams to look.
-
Laura – another science storm for 2020
Posted on August 23rd, 2020 No commentsThis morning’s NHC forecast calls for Laura to continue tracking from Hispaniola along the spine of Cuba, enter the warm 31C waters of the Gulf and intensify as it moves across the Gulf towards landfall in Louisiana. With the new HWRF v13.0.0 moved to operational status on Aug 5 at 12Z, the focus of our discussions changes. All operational and many experimental models are now using the same ocean, the high quality representation derived from the Navy’s data assimilative GOFS, which is used to initialize the NOAA global RTOFS that layers in the NOAA global winds, which is then used to initialize the ocean models coupled to HWRF, HMON, and FV3 (in HAFS v0.1.a). Lets begin by looking at how this high quality ocean forecast may be influencing the hurricane forecasts.
Yesterday was a remarkable day for Laura hurricane forecasts. We noted there were significant differences in track between the 3 models (HWRF, HMON, and HAFS (v0.1.a)), and that there were significant differences in the resulting intensity as Laura entered the warm Gulf. HWRF took a more easterly track that resulted a rapid intensification to Cat4, HMON and HAFS tracked more towards Texas and was forecast to stay near or below Cat1. But how much of the difference in intensity forecast is due to the different atmospheric models, and how much is due to the different atmospheric and ocean conditions encountered along the different tracks. It is hard to separate the two. You either want the same model along two different tracks to look at the influence of track differences, or different models along the same track to look at model differences.
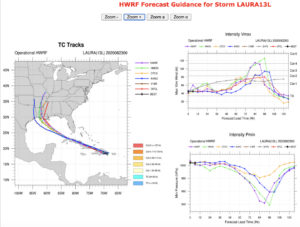
That makes today’s forecasts for Laura an even more remarkable day for hurricane science. Below are the forecast model results from the NOAA NWS HWRF website. Here on the left we see the HWRF (purple) and HMON (green) forecasts follow almost the exact same track into Louisiana until just before landfall. On the upper right, we see the intensity forecasts. Both HWRF (purple) and HMON (green) are predicting the rapid intensification event at the exact same time, 72 hours into the forecast. Both have it rapidly intensifying to Cat 4. Different models, same track, same ocean, same intensity forecast.
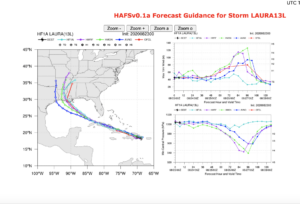
Now lets check in on one of the experimental models in HAFS, specifically version 0.1.a that is coupled to the same ocean as HWRF and HMON. Below on the left, HAFS in light blue is also crossing the Gulf on essentially the same route as HWRF and HMON, also landfalling in Louisiana, but a bit west of the others. But HAFS keeps Laura below hurricane strength the entire time.
This example illustrates the challenges of hurricane forecasting. We are 4 days before the forecast landfall in Louisiana, and with Laura, we see the models converging on a similar solution for track, but still diverging on the solution for intensity. We see that for Laura, the different HWRF and HMON models, now using the same ocean since Aug 5, converge to the same intensity forecast once the track converges. This was not the case as recently as Isaias, the storm just before Aug 5 when HMON used the high quality ocean derived from the Navy’s data assimilative GOFS, and HWRF was still using climatology.
We are learning much from this hurricane season. We are seeing improvements along the entire value chain, from the observing systems we deploy, to our ability to assimilate the data, and on to the coupled atmosphere-ocean models used for the hurricane models. And we are seeing what the NWS annual reviews have been saying for years, that we continue to make progress on track forecasts, but that improvements to intensity forecasts lag. We desperately need the research to figure out why. We have a vast pool of researchers at NOAA, the Navy, in universities and in industry that are willing to contribute, and we have the regional expertise already assembled and coordinated through U.S. IOOS and the OAR Cooperative Institutes. It is time to expand the Hurricane Forecast Improvement Program (HFIP) across agencies, across sectors, and across disciplines. If the answer is HFIP is already doing this, my question will be the same as it has been since Sandy, are we doing enough?
