-
Data assimilation vs rapid process evolution
Posted on August 24th, 2020 No commentsAdding this post so that we do not loose track of this event revealed by NG645 as it is passed by Marco.
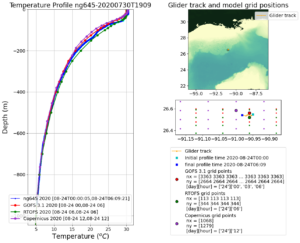
First plot below is the temperature profile comparisons from this morning. The data assimilative GOFS is closest to the glider temperature profile. There is some cooling in the upper ocean in RTOFS. Recall that RTOFS backs up 2 days in GOFS, pulls the initial condition, and moves forward without data assimilation with the NOAA winds. GOFS is doing data assimilation up to the present. RTOFS relies on model processes to carry the evolution forward for the final 2 days. Hard to say which approach is better based on temperature.
But now lets check the salinity profiles, and the evolution of the barrier layer. Here GOFS (red) kept the barrier layer salinity low consistent with the pre-storm conditions. RTOFS (green) mixed the barrier layer fully consistent with the Navy glider profile (blue) based on physical processes over the last 2 days.
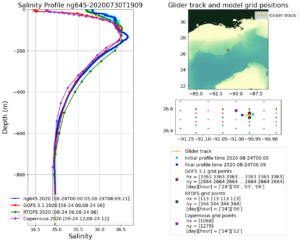
We saw similar behaviors in the data assimilation during Hurricane Michael in the Gulf a couple years ago. Perhaps this is another case where the choice of which CTD profile is assimilated during a period of rapid evolution makes a difference. Its an important time to investigate what we have noticed here, since RTOFS-DA is currently being run in experimental mode.
-
Leaning towards the regional models
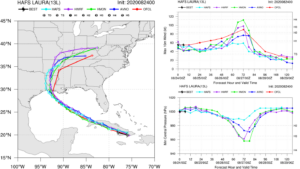
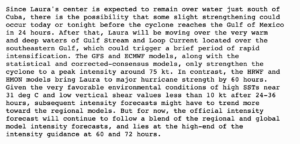
Posted on August 24th, 2020 No commentsThe following is cut and pasted from the National Hurricane Center (NHC) Forecast Discussion at 5 am this morning:
We also started a similar discussion in yesterday’s Hurricane Blog. The two operational regional models are continuing to agree this morning, and NHC may be leaning towards this consensus. Below is what this looks like from the NWS HAFS website. On the left, all the models are in tight agreement on the forecast track of Laura over Cuba, and across the Gulf up until landfall. On the upper right, the differences in the intensity forecast remain significant. The two regional models, HWRF (purple) and HMON (green), now using the same ocean initial condition derived from the data assimilative global GOFS model, still have Laura intensifying at 60 hours to a Cat 3 hurricane. One experimental model (light blue) is consistent with the consensus intensity of a tropical storm until 60 hours, but after 60 hours, instead of rapidly intensifying, keeps Laura as a weak tropical storm. The official intensity forecast from the NHC as described above is shown in red.