-
Two figures from the recent past
Posted on August 26th, 2020 No commentsNot everything happens in real time. Here we wanted to compare the the ocean under Laura for the entire forecast value chain that starts with the data assimilative GOFS, then ROTFS backs up 2 days, pulls the 3-D fields from GOFS and moves them forward in time with NOAA winds, then, for the operational forecasts, the initial condition for HMON’s coupled regional HYCOM model as well as the initial condition for HWRF’s coupled MPI-POM model are pulled from RTOFS. The plots from HWRF and HMON are constructed from the operational runs which are protected and still requires human-in-the-loop processing.
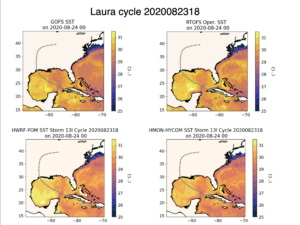
The first figure shows the SST map initialized at Aug 23 at 18Z for GOFS (upper left), RTOFS (upper right), HWRF-MPIPOM (lower left) and HMON-HYCOM (lower right). We are looking 6 hours ahead in the forecast to Aug 24 at 00Z. Variations between the models are generally in the 0.5C range, with the ocean in HWRF- MPIPOM the warmest. These variations are small compared to what we saw before the Aug 5 upgrade to the new version of HWRF.
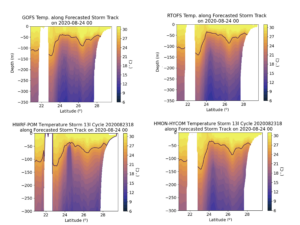
The plots we really wanted to see were the vertical sections. Here we look at the upper 350 m of the water column along the track of Laura from the start of the forecast to landfall. The x-axis is latitude, starting with the south on the left. The white area near 22N is Cuba. The black line on the plot is the 26C isotherm. After leaving Cuba, Laura crosses the warm waters of the Loop Current, then the shallow warm water layer in the central Gulf. The main feature of interest here is the deeper layer of warm water near 26N. This layer is in the northwest corner of the Gulf, the area the hurricane is expected to intensify before landfall. Looking at the surface layer structure, we have long known that GOFS, ROTFS and HMON’s HYCOM will look similar. It is good to see how similar the ocean in HWRF’s MPIPOM is along this track. This is a big step forward with the new HWRF. It moves us to a new level of validation. Our communications used to concentrate on whether the Essential Ocean Features impacting hurricane intensity even existed in the models. Now we are talking about the detailed structure and evolution of the Essential Ocean Features. A big step change.
-
The morning of …
Posted on August 26th, 2020 No commentsSome comments from the National Hurricane Center’s 4 am Discussion:
Satellite images indicate that Laura has become a formidable
hurricane since yesterday evening.

The hurricane has intensified a remarkable 40 kt during the past 24
hours, and there are no signs it will stop soon, with shear
remaining low-to-moderate over the deep warm waters of the central
Gulf of Mexico.
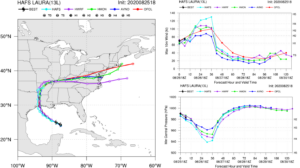
From the forecast guidance models below, we see good agreement on track on the left, and on the right, operational HWRF and HMON are in good agreement with the intensity increasing to Cat 3. HAFS increases intensity to Cat 4.
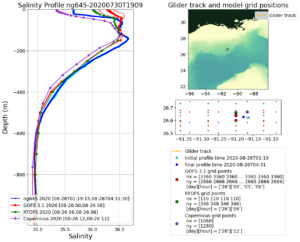
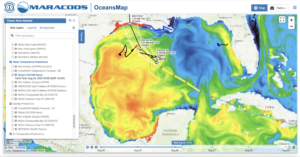
OceansMap has been updated with the 4 am track uncertainty cone. Laura is forecast to track over the relatively warm and fresh surface waters of the northwestern Gulf. Two Navy Gliders are within the track uncertainty cone, ng645 on the right, and ng314 on the left. TAMU glider Stommel is just off to the west in a small warm eddy. The automated morning glider/model comparisons should complete their run soon and we’ll get a look at the profiles from these gliders.
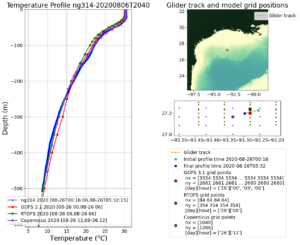
Navy Glider ng314 (left of track) is the first of the three comparison to process. We seem to be getting used to the global models doing well with assimilating the temperature data from gliders that have been deployed in advance of the storm.
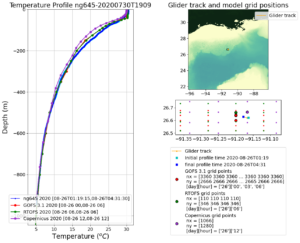
Navy Glider ng645 (right of track) is out. Same image we are getting used to. GOFS is assimilating the glider data nicely, and ROTFS is keeping in step with the NOAA winds. Both US models are doing slightly better than Copernicus in the critical upper 200 m.
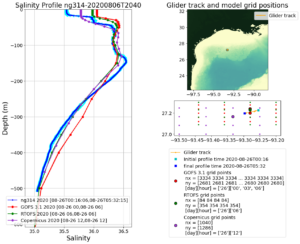
Now the look at salinity. First Glider ng314 on the left. We know salinity is harder – we have no satellite to help us with the smaller scale surface variations. So I expect variability near the surface, and we see it. Still the global models are resolving the Essential Ocean Feature in this region – the all have a surface barrier layer. GOFS and RTOFS even have the barrier layer at the right depth – thats good. Why is the observed surface salinity a bit less, something to come back to and figure out. Horizontal variability – we see a lot of this in the higher resolution oceans under HWRF and HMON. Also, we should track down what caused the deviation of GOFS in the 200 m to 600 m range. It has moved GOFS to slightly saltier values, but ROTFS remains aligned. That means it is likely to do with data assimilated by GOFS in the last 2 days, since RTOFS is always 2 days behind in the assimilation. This is the region of the profiles that we also see impacted by the altimetry. So what combination of altimetry and gliders, and what glider profiles are chosen for the assimilation if important to check. All these decisions have to be made in the implementation of RTOFS-DA that is being tested this summer. We can add another test case to the list.
Lets finish with the salinity profile on the right of the track from ng645. Here GOFS is doing fine in the 200 m – 600 m range. This really does narrow the search for improvements we can implement in ROTFS-DA with two gliders in the same storm with different behaviors. But now the upper ocean. The barrier layers are there in all three global models, but how did the Europeans do so well on the salinity in that layer. The US models saw the impact of Marco, a mixing and increase in the surface layer salinity. Maybe the European’s had less change in the salinity during Marco, and now the real ocean is just coming back into agreement with a relatively steady Copernicus forecast? All good questions to check into as we refine the experimental RTOFS-DA, and eventually build the data assimilation procedures for the future ocean model MOM6.