


-
Two figures from the recent past
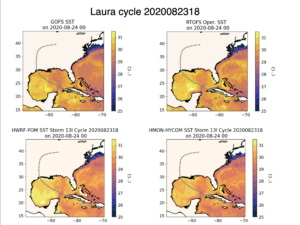
Posted on August 26th, 2020 No commentsNot everything happens in real time. Here we wanted to compare the the ocean under Laura for the entire forecast value chain that starts with the data assimilative GOFS, then ROTFS backs up 2 days, pulls the 3-D fields from GOFS and moves them forward in time with NOAA winds, then, for the operational forecasts, the initial condition for HMON’s coupled regional HYCOM model as well as the initial condition for HWRF’s coupled MPI-POM model are pulled from RTOFS. The plots from HWRF and HMON are constructed from the operational runs which are protected and still requires human-in-the-loop processing.
The first figure shows the SST map initialized at Aug 23 at 18Z for GOFS (upper left), RTOFS (upper right), HWRF-MPIPOM (lower left) and HMON-HYCOM (lower right). We are looking 6 hours ahead in the forecast to Aug 24 at 00Z. Variations between the models are generally in the 0.5C range, with the ocean in HWRF- MPIPOM the warmest. These variations are small compared to what we saw before the Aug 5 upgrade to the new version of HWRF.
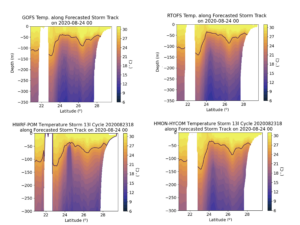
The plots we really wanted to see were the vertical sections. Here we look at the upper 350 m of the water column along the track of Laura from the start of the forecast to landfall. The x-axis is latitude, starting with the south on the left. The white area near 22N is Cuba. The black line on the plot is the 26C isotherm. After leaving Cuba, Laura crosses the warm waters of the Loop Current, then the shallow warm water layer in the central Gulf. The main feature of interest here is the deeper layer of warm water near 26N. This layer is in the northwest corner of the Gulf, the area the hurricane is expected to intensify before landfall. Looking at the surface layer structure, we have long known that GOFS, ROTFS and HMON’s HYCOM will look similar. It is good to see how similar the ocean in HWRF’s MPIPOM is along this track. This is a big step forward with the new HWRF. It moves us to a new level of validation. Our communications used to concentrate on whether the Essential Ocean Features impacting hurricane intensity even existed in the models. Now we are talking about the detailed structure and evolution of the Essential Ocean Features. A big step change.
Last 5 posts by Scott Glenn
- Early Season in the Mid Atlantic - June 17th, 2021
- Disturbance in the Gulf - June 16th, 2021
- Hurricane Gliders 2021 - May 3rd, 2021
- Hurricane Iota - November 16th, 2020
- Hurricane Eta - Low Wind Shear, High SST - November 2nd, 2020
