-
Coupled Modeling of Fay
Posted on July 12th, 2020 No commentsOver the last year a team at Rutgers has been developing new model coupling capabilities as part of the US IOOS Coastal Ocean Modeling Testbed (COMT) program. In this application we’ve coupled a regional ROMS model, DOPPIO, which covers the Mid-Atlantic Bight (MAB) and Gulf of Maine, and an implementation of the Weather Research and Forecasting (WRF) model. In this coupled system ROMS provides SST to WRF, while WRF calculates heat fluxes and passes back forcing information to ROMS.
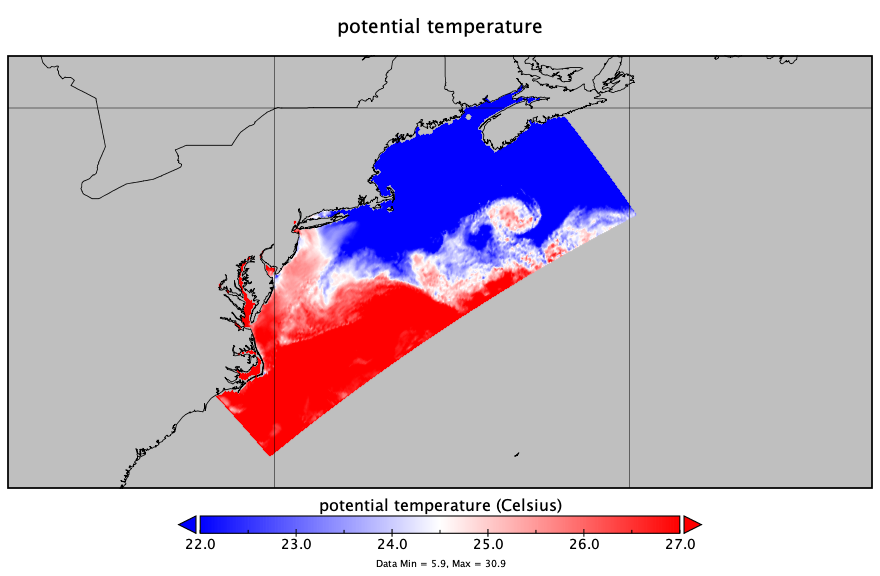
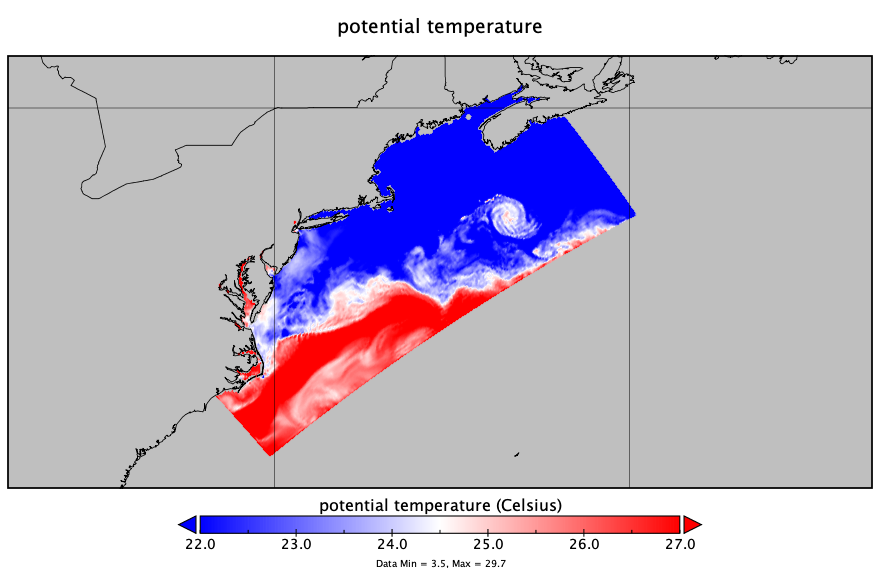
The coupled system was initialized on 07/09 00:00 GMT and ran forward 72 hours. In the first SST image from ROMS you can see warm surface waters over the southern portion of the MAB and cooler waters to the north and into the Gulf of Maine. As the storm passes the Atlantic Shores Buoy on 07/10 at 20:00 GMT the next SST image shows the cooling over the entire southern portion of the MAB.
Animations of the latent and sensible heat fluxes from the WRF portion of the coupled model show that both heat fluxes were negative for much of the storm time period. This means that energy was getting sucked out of the atmosphere and into the ocean. This is setup from the cool ocean temperatures underneath a warmer atmosphere, just like we observed in the Hurricane Irene case back in 2011.
Over the next few weeks we’ll be evaluating how the model compares to the observations collected throughout the storm, and performing sensitivities to see how the ocean coupling influenced the storms intensity before landfall. More to come!
-
Atlantic Shores Buoy off Atlantic City – 90% ahead of eye cooling
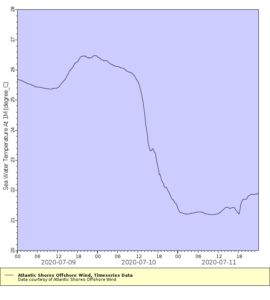
Posted on July 12th, 2020 No commentsFay continues to capture our attention with its ahead of eye cooling. Travis and I are now look at Fay using the Atlantic Shores buoy deployed in the Wind Energy Area off Atlantic City, NJ. This buoy is closer to landfall and south of the NDBC buoy in last night’s post. Atlantic Shores makes its buoy data available through the MARACOOS OceansMap, and you can download it as ERDDAP files. Here we look at it through the ERDDAP interface.
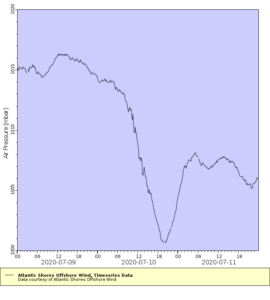
First plot is the air pressure. The minimum occurs at about 20 GMT on July 10. We will use this as the time of eye passage.
We now look at the ocean temperature from the sensor at 1 m depth below the surface. The water temperature cools from 26.5C before the storm to about 22C at eye passage at 20 GMT on July 10. Total of 4.5C cooling ahead of eye. The minimum temperature looks to be about 21.5C, so an additional 0.5C of cooling after eye passage. So for the total of 5C cooling caused by the passage of the storm, 90% occurs ahed of eye, and 10% after eye passage. Another good case for ahead of eye cooling and rapid co-evolution of the ocean and atmosphere.
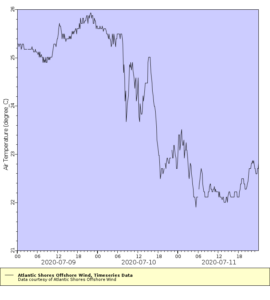
So how does this feedback on the atmosphere? Lets look at the air temperature from the Atlantic Shores buoy. Because of the rapid ocean cooling, the ocean is colder than air temperatures. The heat flux is from the hurricane into the ocean, which acts to weaken the storm. If our forecast had kept the ocean temperatures warm – a static ocean rather than a co-evolving ocean – the ocean would be warmer than the air temperatures, changing the sign of the heat flux and strengthening the storm.
This clearly demonstrates the value of IOOS collaborations between the Regional Associations, industry, and academic partners.
-
Fay from a NDBC buoy – 2/3 ahead of eye cooling
Posted on July 11th, 2020 No commentsTropical Cyclone Fay shot up the Mid Atlantic Bight yesterday, making landfall around Atlantic City. Like an early season Irene (2011).
Irene is the famous storm where the MARACOOS ocean observatory, and its associated regional ocean and atmospheric forecast models, was used to identify the Essential Ocean Processes responsible for rapid ahead-of-eye cooling of the ocean, and the subsequent Rapid Weakening (RW) of the storm (see the paper linked in yesterday’s blog). The paper looked at over 130 atmospheric forecast sensitivity runs to discover that hurricane-forced ahead-of-eye ocean cooling was the critical missing physical process required to properly match the observed Rapid Weakening (RW) of Irene as it tracked through the Mid Atlantic. It’s a process we call rapid co-evolution of the atmosphere and ocean during the intense forced phased of a hurricane.
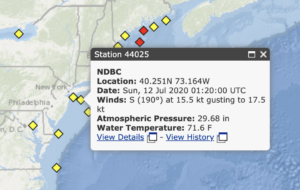
Looks like the best NDBC buoy to check for ahead of eye cooling is 44025, up in the Bight Apex.
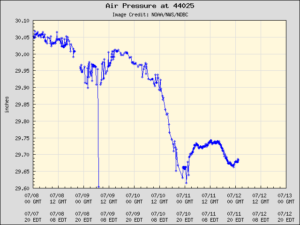
First we look at the atmospheric pressure. The minimum pressure is July 11, about 01 GMT.
Now we look at the ocean temperature. Starts about 78F before the storm. At 01 GMT on July 11, the water temperature has cooled to about 72F, so 6 degrees F ahead of eye center cooling. The minimum temperature on 7/11 is about 69F, so 3F cooling after eye passage.
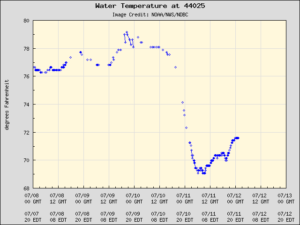
Result is 2/3 of the cooling ahead of eye, 1/3 of the cooling after eye passage. And this is for a buoy north of the landfall location. I would expect more cooling opportunity south of landfall. We’ll need to check the models for that.
How does this compare to the other Irene-class hurricanes that track across the Mid Atlantic? That same Nature Comms paper quoted yesterday has the table of all 11 Irene-class hurricane occurring between Charlie (1986) and Arthur (2014). The average percentage of ahead of eye cooling for these 11 hurricanes, based on the truly awesome 40 year NDBC buoy record, is 73%. And Fay is already at 66% ahead of eye cooling on our first look.
Physics is awesome. Thank you Adm. Lautenbacher.
-
The Operational System – Thank you Fay
Posted on July 10th, 2020 No commentsHWRF is one of the world’s best hurricane forecast models. Our job is to improve the ocean model component of HWRF to make it even better.
Now we just can’t look at the operational HWRF whenever and wherever we like. The operational HWRF is kicked-off by the presence of a hurricane and it follows the hurricane. So we need a hurricane, or at least a tropical storm, to track through the Mid Atlantic to get a look at the ocean that the operational HWRF is using in this region.
Thank you Fay.
Below is temperature transect across the Mid Atlantic shelf along the Tuckerton Endurance Line. It is along the same cross-shelf transect as the previous blog post from yesterday (below), but it uses a different color scale since it had to be generated on one of the operational computers. We’ll download the data and fix that next week. But here is a quick look just as Fay was beginning its northward track up the Mid Atlantic coast. Right away you can see some differences between this ocean model and the Navy, NOAA and European global models, plus the MARACOOS regional model, posted in the previous blog.
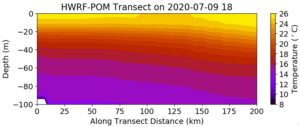
First issue is the water depth. Moving offshore from 0 on the X-axis, the actual bottom should start at about 20 m depth, and run to about 100 m depth about 125 km offshore. Here the water depth is deeper than 100 m almost along the entire transect.
Second issue is the temperature structure. We are missing the Essential Ocean Features of the Mid Atlantic shelf – the thin warm surface layer, the intense thermocline between 10 m and 15 m, and the widespread Cold Pool beneath. Our NOAA-sponsored science has proven that these Essential Ocean Features are critical for better intensity forecasts in our Mid Atlantic research models (https://www.nature.com/articles/ncomms10887). And if this ocean does give us a better intensity forecast in the operational model, it means something else is wrong and is compensating for the less accurate ocean. This is why we need intermediate metrics along the entire forecast value chain. Did we improve the ocean model? Did we improve the air-sea interactions? Did we improve the intensity forecast? The intermediate metrics help us identify where we are doing well, and where we need to focus more work.
There is an easy to read viewpoint article on this by Kerry Emanuel, MIT’s expert on hurricanes. https://agupubs.onlinelibrary.wiley.com/doi/full/10.1029/2019AV000129#.XvXR-OhrkjI.twitter
Six paragraphs from the end, the one that starts “Sometimes the quest for better simulations…”, is especially relevant.
Thank you Fay.
-
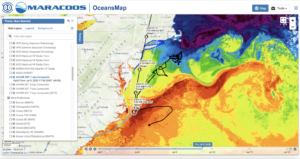
Tropical Storm Fay in the Mid Atlantic
Posted on July 9th, 2020 No commentsTropical Storm Fay is shown here leaving the Gulf Stream where it will rapidly be heading north across the Mid Atlantic shelf. NHC forecasters called for Fay to intensify over the Gulf Stream then weaken as it passed over the Mid Atlantic shelf. Surface waters on the shelf are anomalously warm this year, but they much cooler than the Gulf Stream as seen here. Still the biggest source of cold water in the region – the Mid Atlantic Cold Pool – is unseen from space. It spends much of its summer below a 10-20m thick layer of warm, fresh surface water. To see this Cold Pool, you have to go out and touch it with a CTD. Thats why we send out the shallow water gliders in the summer. Simultaneously WHOI is sending out the deep gliders to monitor the evolving Gulf Stream. This way there are gliders in the Gulf Stream making sure the models have the right characteristics where the hurricanes are expected to intensify, and gliders on the shelf where the storms have been shown to rapidly weaken due to ahead-of-eye mixing and cooling. These rapid intensity changes, both intensification and weakening, are one the the challenges of modern hurricane forecasting.
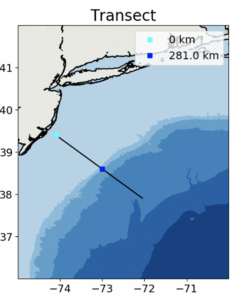
With Fay about to cross over the Mid Atlantic shelf, lets take look at the structure of the Cold Pool and the warm, fresh surface layer on a cross shelf line known as the Endurance Line, a glider line originating from Tuckerton, NJ and extending across the shelf, a line first occupied by gliders in 2003.
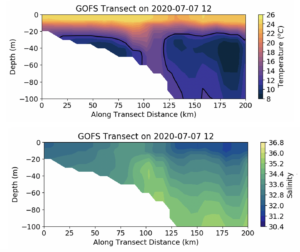
First model – the Navy Global Ocean Forecast System (GOFS). Top panel is temperature, bottom panel is salinity. In the temperature section Maria has drawn in the 12C isotherm as a black line. You can see the Cold Pool on the shelf between about 20 km to 100 km offshore. And it has a thin warm surface layer about 10m thick. A global model that has a Cold Pool on the continental shelf – pretty awesome how far we have come since hurricane Irene in 2011. Salinity will need to be watched. The surface fresh water barrier layers in the Mid Atlantic usually mimic the temperature field. If the temperature Mixed Layer Depth (MLD) is 10 m deep, the salinity MLD is often also about 10 m deep. Here there is no barrier layer, simply a cross-shelf gradient.
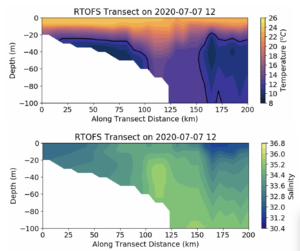
Global model #2 – NOAA Real Time Ocean Forecast System (RTOFS). This uses the data assimilative ocean produced by GOFS but forces it with NOAA winds. The shelf looks pretty similar for temperature, but offshore the shelf break, the cold water has moved farther offshore.
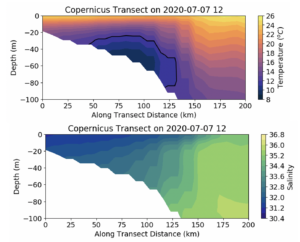
Global Model #3, the European Copernicus system. It has a Cold Pool, still an amazing accomplishment for a global model, but the structure on the shelf is very different. The Cold Pool is much farther offshore, and the thermocline is weaker and thicker. More downwelling pushing the cold bottom water offshore?
Fourth model – regional Doppio. This definitely looks like a downwelling example, where the core of the Cold Pool is moved offshore and the nearshore isotherms in the bottom layer bend downward. And the salinity also has the usual barrier layer structure, the there is a surface pool of low salinity water and the temperature and salinity MLDs are both about the same.
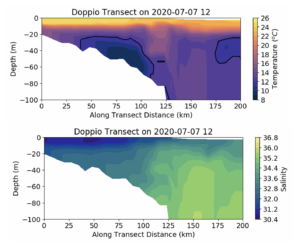
In the Caribbean, the low salinity surface layer is usually shallower than the temperature mixed layer depth, so any surface induced mixing has to break through both the halocline and the thermocline, so it is important to get both temperature and salinity upper ocean structures right. In the Mid Atlantic, the halocline and thermocline are often co-located, resulting in a stronger pycnocline, so it is important to get both the temperature and salinity upper ocean structure right.
-
Complimentary aspects of Argo and Gliders
Posted on July 1st, 2020 No commentsA question from the IOOS-OAR collaboration workshop yesterday concerned how Argo and Gliders are complimentary.
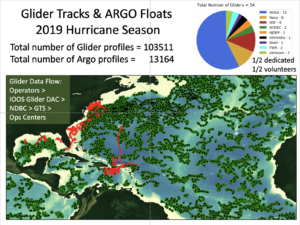
Below is a plot of the locations of the Argo profiles during the 2019 hurricane season compared to the tracks of the gliders during the same time period.
The Argo floats provide the broad spatial coverage over large areas of the ocean. The gliders are concentrated in regions that have less or no Argo coverage, like the Gulf Stream, the Caribbean, and definitely on the continental shelves. Each Argo float typically provides a profile once every 10 days. Gliders provide multiple profiles a day, and can be directed across strong currents. Over 100,000 glider profiles were provided by the community’s glider fleet during the 2019 hurricane season.