


-
Tropical Storm Fay in the Mid Atlantic
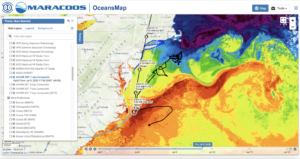
Posted on July 9th, 2020 No commentsTropical Storm Fay is shown here leaving the Gulf Stream where it will rapidly be heading north across the Mid Atlantic shelf. NHC forecasters called for Fay to intensify over the Gulf Stream then weaken as it passed over the Mid Atlantic shelf. Surface waters on the shelf are anomalously warm this year, but they much cooler than the Gulf Stream as seen here. Still the biggest source of cold water in the region – the Mid Atlantic Cold Pool – is unseen from space. It spends much of its summer below a 10-20m thick layer of warm, fresh surface water. To see this Cold Pool, you have to go out and touch it with a CTD. Thats why we send out the shallow water gliders in the summer. Simultaneously WHOI is sending out the deep gliders to monitor the evolving Gulf Stream. This way there are gliders in the Gulf Stream making sure the models have the right characteristics where the hurricanes are expected to intensify, and gliders on the shelf where the storms have been shown to rapidly weaken due to ahead-of-eye mixing and cooling. These rapid intensity changes, both intensification and weakening, are one the the challenges of modern hurricane forecasting.
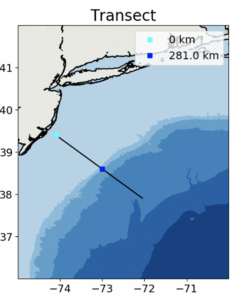
With Fay about to cross over the Mid Atlantic shelf, lets take look at the structure of the Cold Pool and the warm, fresh surface layer on a cross shelf line known as the Endurance Line, a glider line originating from Tuckerton, NJ and extending across the shelf, a line first occupied by gliders in 2003.
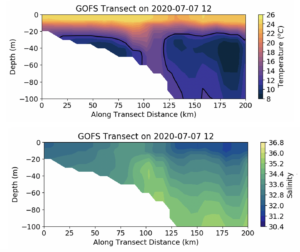
First model – the Navy Global Ocean Forecast System (GOFS). Top panel is temperature, bottom panel is salinity. In the temperature section Maria has drawn in the 12C isotherm as a black line. You can see the Cold Pool on the shelf between about 20 km to 100 km offshore. And it has a thin warm surface layer about 10m thick. A global model that has a Cold Pool on the continental shelf – pretty awesome how far we have come since hurricane Irene in 2011. Salinity will need to be watched. The surface fresh water barrier layers in the Mid Atlantic usually mimic the temperature field. If the temperature Mixed Layer Depth (MLD) is 10 m deep, the salinity MLD is often also about 10 m deep. Here there is no barrier layer, simply a cross-shelf gradient.
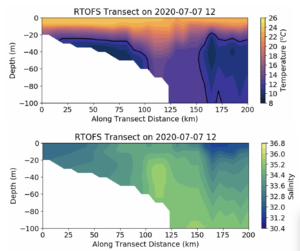
Global model #2 – NOAA Real Time Ocean Forecast System (RTOFS). This uses the data assimilative ocean produced by GOFS but forces it with NOAA winds. The shelf looks pretty similar for temperature, but offshore the shelf break, the cold water has moved farther offshore.
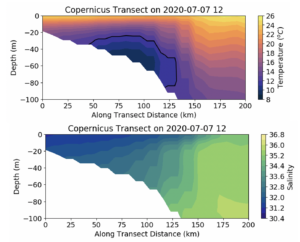
Global Model #3, the European Copernicus system. It has a Cold Pool, still an amazing accomplishment for a global model, but the structure on the shelf is very different. The Cold Pool is much farther offshore, and the thermocline is weaker and thicker. More downwelling pushing the cold bottom water offshore?
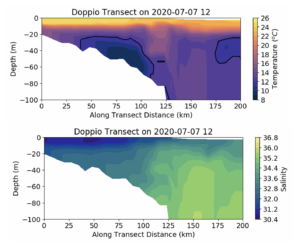
Fourth model – regional Doppio. This definitely looks like a downwelling example, where the core of the Cold Pool is moved offshore and the nearshore isotherms in the bottom layer bend downward. And the salinity also has the usual barrier layer structure, the there is a surface pool of low salinity water and the temperature and salinity MLDs are both about the same.
In the Caribbean, the low salinity surface layer is usually shallower than the temperature mixed layer depth, so any surface induced mixing has to break through both the halocline and the thermocline, so it is important to get both temperature and salinity upper ocean structures right. In the Mid Atlantic, the halocline and thermocline are often co-located, resulting in a stronger pycnocline, so it is important to get both the temperature and salinity upper ocean structure right.
Last 5 posts by Scott Glenn
- Early Season in the Mid Atlantic - June 17th, 2021
- Disturbance in the Gulf - June 16th, 2021
- Hurricane Gliders 2021 - May 3rd, 2021
- Hurricane Iota - November 16th, 2020
- Hurricane Eta - Low Wind Shear, High SST - November 2nd, 2020
