


-
More from Atlantic Shores
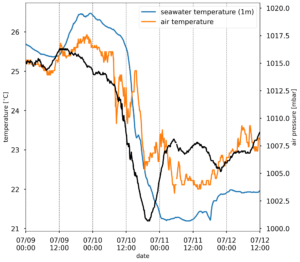
Posted on July 13th, 2020 No commentsBelow is another plot of the Atlantic Shores buoy data. Cliff Watkins (a Rutgers grad student who hopes to soon be working on hurricanes and typhoons for the Navy) took the 3 weekend plots of air pressure (black), air temperature (orange), and water temperature (blue) and combined them into one plot below. The air pressure drops to a minimum about 18-20 GMT on July 10. Remember how warm the Mid Atlantic’s coastal ocean was before Fay? How Matt Oliver’s (a past Rutgers grad student, now a professor at U.Delaware) Sea Surface Temperature Anomaly product had it warmer than usual by about 2C or more.
In the plot below, on July 9, at the Atlantic Shores buoy off Atlantic City, the ocean (blue line) was warmer than the air above it (orange line). As the storm approaches and the air pressure drops ahead of eye, so does the ocean temperature. Just after mid-day on July 10, the air-sea temperature difference changes sign, and the ocean remains colder than the air for the next few days. The sign of the air-sea temperature difference also effects the sign of the air sea heat fluxes, so instead of a warm ocean acting to increase the storm’s intensity, we see a cold ocean acting to weaken the storm.
Once again we see rapid ahead of eye cooling in a storm tracking up the Mid Atlantic coast. The next step is to investigate why it it cooled. Thinking back to the 100 or so talks I have given on the ahead of eye cooling discovery process for Irene, I have that one slide I have used more than any other, the slide made by Josh Kohut (past Rutgers grad student, now a Rutgers professor) showing the importance of the ocean observatory to the discovery process. The slide shoes the 3 steps in the discovery process. (1) That we used the satellite imagery to tell us what happened – that the ocean cooled by 5-11C. (2) We then used the glider to tell us when the cooling happened – ahead of eye. (3) Lastly we used the HF radar network and its maps of the ocean currents to explain why.
Tomorrow we look more at the Acoustic Doppler Current Profiler on the Atlantic Shores buoy, and see if we can figure out why the ocean cooled so rapidly by looking at the currents. I think Sage Lichtenwalner (a past Rutgers undergrad) has some NSF REU students following along. For those students, and any other students who may be checking in, this is the discovery process. It never gets old. Just ask Josh or Matt or Cliff or Sage.
