


-
Coupled Modeling of Fay
Posted on July 12th, 2020 No commentsOver the last year a team at Rutgers has been developing new model coupling capabilities as part of the US IOOS Coastal Ocean Modeling Testbed (COMT) program. In this application we’ve coupled a regional ROMS model, DOPPIO, which covers the Mid-Atlantic Bight (MAB) and Gulf of Maine, and an implementation of the Weather Research and Forecasting (WRF) model. In this coupled system ROMS provides SST to WRF, while WRF calculates heat fluxes and passes back forcing information to ROMS.
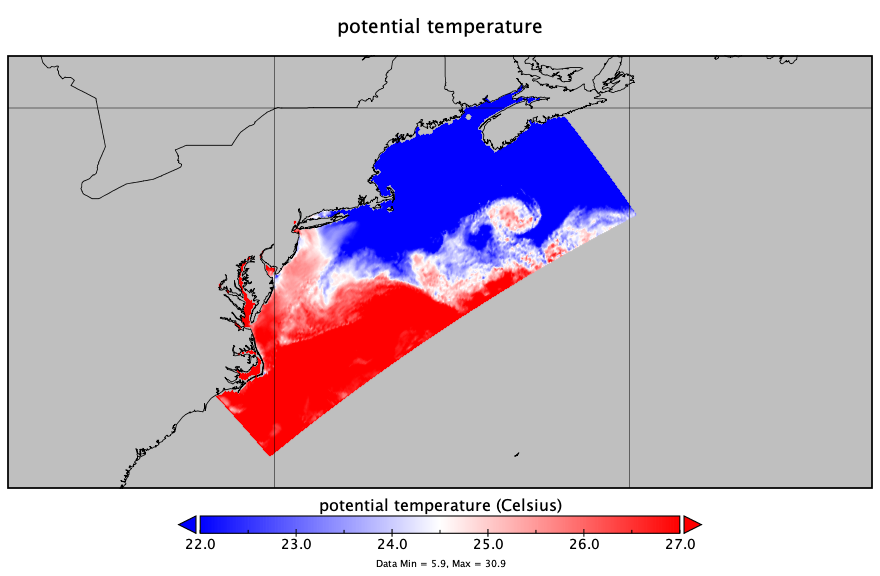
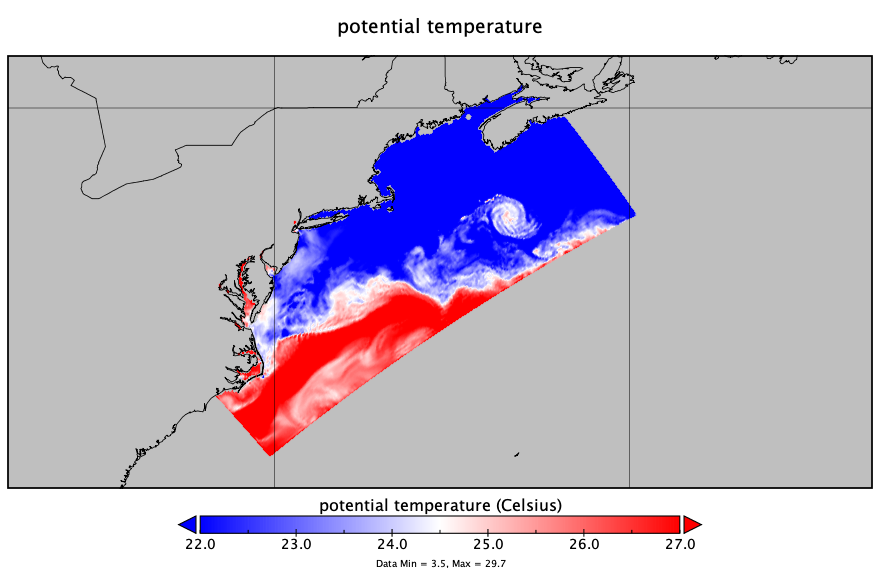
The coupled system was initialized on 07/09 00:00 GMT and ran forward 72 hours. In the first SST image from ROMS you can see warm surface waters over the southern portion of the MAB and cooler waters to the north and into the Gulf of Maine. As the storm passes the Atlantic Shores Buoy on 07/10 at 20:00 GMT the next SST image shows the cooling over the entire southern portion of the MAB.
Animations of the latent and sensible heat fluxes from the WRF portion of the coupled model show that both heat fluxes were negative for much of the storm time period. This means that energy was getting sucked out of the atmosphere and into the ocean. This is setup from the cool ocean temperatures underneath a warmer atmosphere, just like we observed in the Hurricane Irene case back in 2011.
Over the next few weeks we’ll be evaluating how the model compares to the observations collected throughout the storm, and performing sensitivities to see how the ocean coupling influenced the storms intensity before landfall. More to come!
-
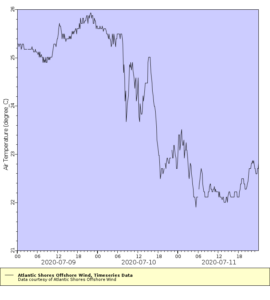
Atlantic Shores Buoy off Atlantic City – 90% ahead of eye cooling
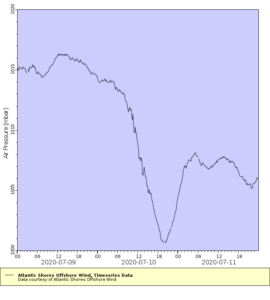
Posted on July 12th, 2020 No commentsFay continues to capture our attention with its ahead of eye cooling. Travis and I are now look at Fay using the Atlantic Shores buoy deployed in the Wind Energy Area off Atlantic City, NJ. This buoy is closer to landfall and south of the NDBC buoy in last night’s post. Atlantic Shores makes its buoy data available through the MARACOOS OceansMap, and you can download it as ERDDAP files. Here we look at it through the ERDDAP interface.
First plot is the air pressure. The minimum occurs at about 20 GMT on July 10. We will use this as the time of eye passage.
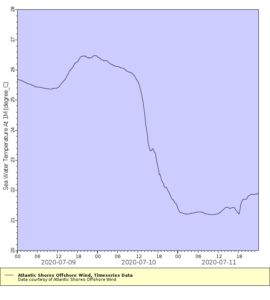
We now look at the ocean temperature from the sensor at 1 m depth below the surface. The water temperature cools from 26.5C before the storm to about 22C at eye passage at 20 GMT on July 10. Total of 4.5C cooling ahead of eye. The minimum temperature looks to be about 21.5C, so an additional 0.5C of cooling after eye passage. So for the total of 5C cooling caused by the passage of the storm, 90% occurs ahed of eye, and 10% after eye passage. Another good case for ahead of eye cooling and rapid co-evolution of the ocean and atmosphere.
So how does this feedback on the atmosphere? Lets look at the air temperature from the Atlantic Shores buoy. Because of the rapid ocean cooling, the ocean is colder than air temperatures. The heat flux is from the hurricane into the ocean, which acts to weaken the storm. If our forecast had kept the ocean temperatures warm – a static ocean rather than a co-evolving ocean – the ocean would be warmer than the air temperatures, changing the sign of the heat flux and strengthening the storm.
This clearly demonstrates the value of IOOS collaborations between the Regional Associations, industry, and academic partners.
