-
Preparing for Disturbance 1
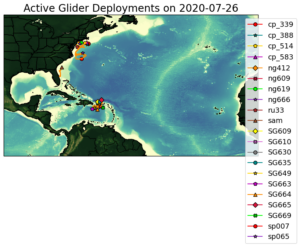
Posted on July 27th, 2020 No commentsDisturbance 1 is heading toward the Lesser Antilles. Just beyond this line of islands is Puerto Rico, surrounded by the extensive AOML glider fleet. I’ll start with one quick comparison tonight. You only need to look once, the result is the same for glider after glider. The data assimilative models are doing really well.
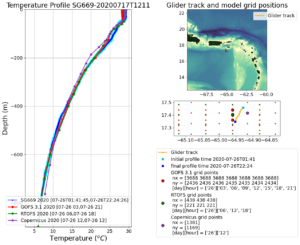
I’ll show glider SG699, the most forward glider in the array, on the southeast corner. First plot is the temperature profile. All three global models are in amazing agreement. It gives us a lot of confidence when all the models agree, that the sensitivities to the different methods of assimilation are small compared to the value added by the data.
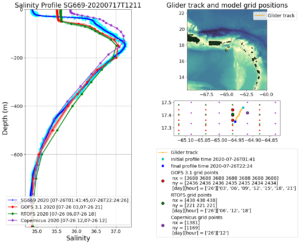
Next is salinity. Again, very good agreement through most of the water column. The important features are the subsurface peak in salinity about 180 m deep, and how the salinity then decreases as you approach the surface. The exciting thing here is that the global models all have a low salinity barrier layer. There are some differences between the model and the salinity data. The barrier layer is thinner and less salty in the data. Depth of the barrier layer looks to be more tied to the temperature profile in the model. But looking from the perspective of a global model informed by local data, this is really good.
If you click on the other automated model/glider comparison plots Maria posts
https://rucool.marine.rutgers.edu/hurricane/Hurricane_season_2020/
you will see similarly good agreement between the glider data and the models for multiple gliders. Looks like all the pieces are working together, with the glider data ensuring that the global models have time to be on track well before the storm hits. This is the plan in action.
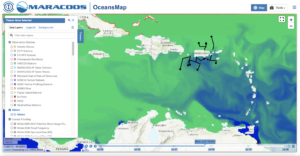
Now that we know the global models are doing a fairly good job of including the barriers layers at least where we have data to assimilate, let’s take a look at the spatial distribution of sea surface salinity from the Navy GOFS model. In the OceansMap layer below, we use a salinity color scale from blue (33) to green (36). The plume of the Amazon and Orinoco rivers make it through the passages between the Windward Islands, especially by South America, remaining relatively fresh heading northwest towards Puerto Rico. South of Hispaniola you see the Caribbean-wide mesoscale feature wrapping fresh water around itself. Looking back at Puerto Rico, you can see why glider SG699 is a bit more salty than the observations. There are some small submesoscale features in the model just South of St. Croix. Looking at the profiles above tends to push you towards invoking vertical processes to explain the differences in barrier layer salinity, but the maps tend to lean you towards small scale horizontal processes being something to consider. Also remember, these are global ocean models, the smaller scale horizontal processes are supposed to be cleaned up by the higher resolution nested regional ocean models. Bottom line, from what we can see, we have the global model ocean in pretty good shape in the area near Puerto Rico well before the tropical disturbance arrives.