


-
The Operational System – Thank you Fay
Posted on July 10th, 2020 No commentsHWRF is one of the world’s best hurricane forecast models. Our job is to improve the ocean model component of HWRF to make it even better.
Now we just can’t look at the operational HWRF whenever and wherever we like. The operational HWRF is kicked-off by the presence of a hurricane and it follows the hurricane. So we need a hurricane, or at least a tropical storm, to track through the Mid Atlantic to get a look at the ocean that the operational HWRF is using in this region.
Thank you Fay.
Below is temperature transect across the Mid Atlantic shelf along the Tuckerton Endurance Line. It is along the same cross-shelf transect as the previous blog post from yesterday (below), but it uses a different color scale since it had to be generated on one of the operational computers. We’ll download the data and fix that next week. But here is a quick look just as Fay was beginning its northward track up the Mid Atlantic coast. Right away you can see some differences between this ocean model and the Navy, NOAA and European global models, plus the MARACOOS regional model, posted in the previous blog.
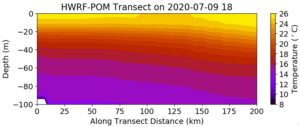
First issue is the water depth. Moving offshore from 0 on the X-axis, the actual bottom should start at about 20 m depth, and run to about 100 m depth about 125 km offshore. Here the water depth is deeper than 100 m almost along the entire transect.
Second issue is the temperature structure. We are missing the Essential Ocean Features of the Mid Atlantic shelf – the thin warm surface layer, the intense thermocline between 10 m and 15 m, and the widespread Cold Pool beneath. Our NOAA-sponsored science has proven that these Essential Ocean Features are critical for better intensity forecasts in our Mid Atlantic research models (https://www.nature.com/articles/ncomms10887). And if this ocean does give us a better intensity forecast in the operational model, it means something else is wrong and is compensating for the less accurate ocean. This is why we need intermediate metrics along the entire forecast value chain. Did we improve the ocean model? Did we improve the air-sea interactions? Did we improve the intensity forecast? The intermediate metrics help us identify where we are doing well, and where we need to focus more work.
There is an easy to read viewpoint article on this by Kerry Emanuel, MIT’s expert on hurricanes. https://agupubs.onlinelibrary.wiley.com/doi/full/10.1029/2019AV000129#.XvXR-OhrkjI.twitter
Six paragraphs from the end, the one that starts “Sometimes the quest for better simulations…”, is especially relevant.
Thank you Fay.
