History Group Blog #2
Credits:
Eve Nevelos, Biotechnology, Class of 2028
Vangelina Clark, Marine Biology, Class of 2029
Victoria Samuel, Marine Biology, Class of 2027
Amaya Baez, Marine Biology, Class of 2027
Hello! Welcome back to Sentinel’s history blog.
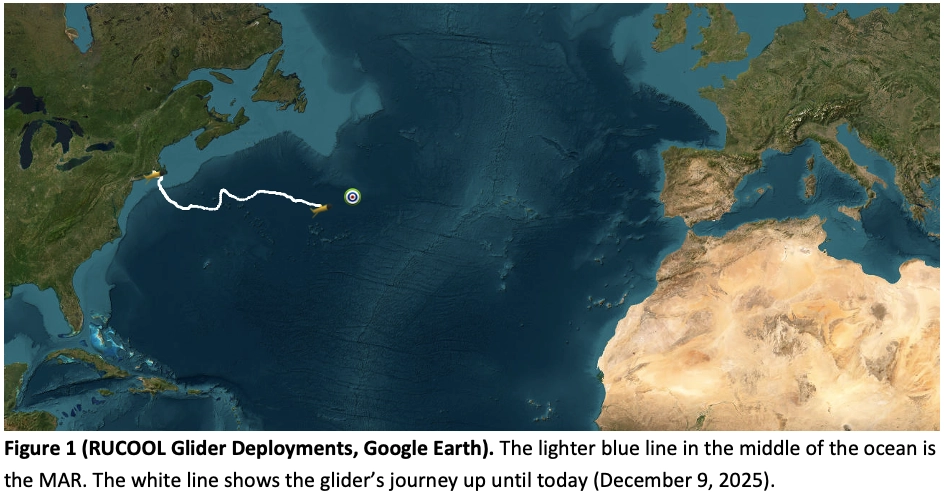
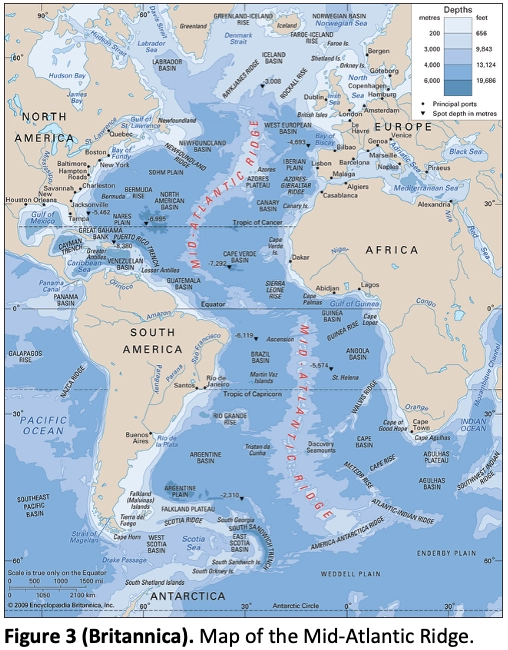
This time, we will be focusing on the history of the Mid-Atlantic Ridge (MAR). The MAR is the longest mountain chain in the world, running along the North-South axis of the Atlantic Ocean, at approximately 10,000 miles (16,000 km) in length. Sentinel is on track to reach the MAR before the end of January.
Mid-Atlantic Ridge History
The mapping of the MAR began as early as 1825 by U.S. Navy Lieutenant Matthew Maury, author of The Physical Geography of the Sea (1855). His work was used by navies and merchant ships around the world.
As we learned last month, the Gulf Stream was pivotal to colonial trade. The industries that benefitted the most from this oceanic highway were fur, timber, and tobacco coming from the eastern United States and Canada, and sugar, molasses and fruit from the Caribbean. Before steamships and more modern technology took over, trade between a multitude of different countries relied on the strong currents of the Gulf Stream to transport such items between the 15th and 19th centuries.
These sailors noticed magnetic abnormalities in their compasses when traveling over the MAR. Seafloor magnetic striping explains these magnetic field reversals. When a new oceanic crust forms at a ridge, it becomes magnetized in the direction of Earth’s magnetic field at the time. Research on magnetic striping started in the 1950s, using technology from WWII. Marie Tharp, an American cartographer, created the first map of the MAR in 1953 using sonar-equipped vessels.
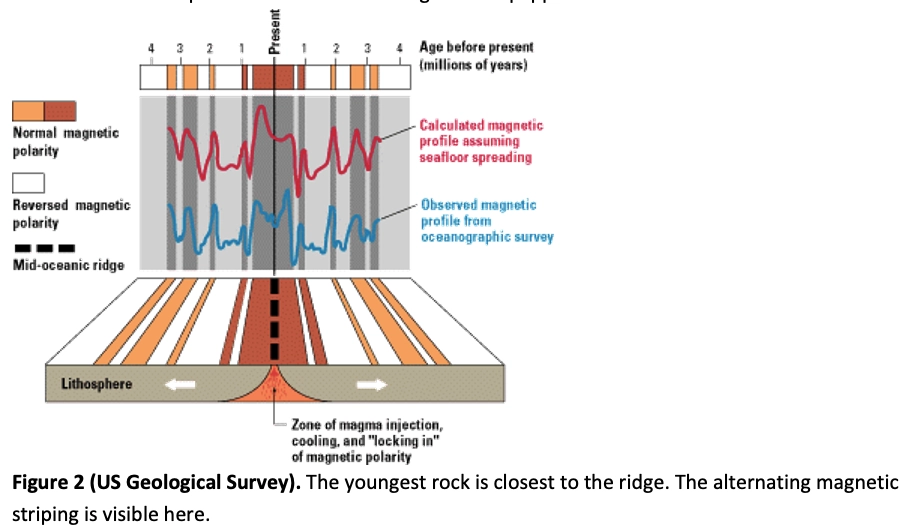
In the 1960s, American geophysicist Harry H. Hess proposed the seafloor spreading hypothesis, which explained the magnetic striping and the lack of sediment on the seafloor. This was a big advancement in plate-tectonics theory. In 1963, the Worldwide Standardized Seismograph Network (WWSSN) was established. The WWSSN was created to monitor the compliance of the 1963 treaty banning the above-ground testing of nuclear weapons. They determined the Benioff zones (prominent earthquake zones) and contributed to further research on the MAR. The continents bordering the Atlantic Ocean move away from the MAR at a rate of 1–2 cm (0.4–0.8 inch) per year.
Offshore drilling also furthered oceanographic research. The Glomar Challenger, a research vessel, retrieved drill-core samples of the ocean floor, providing more evidence for the seafloor spreading theory.
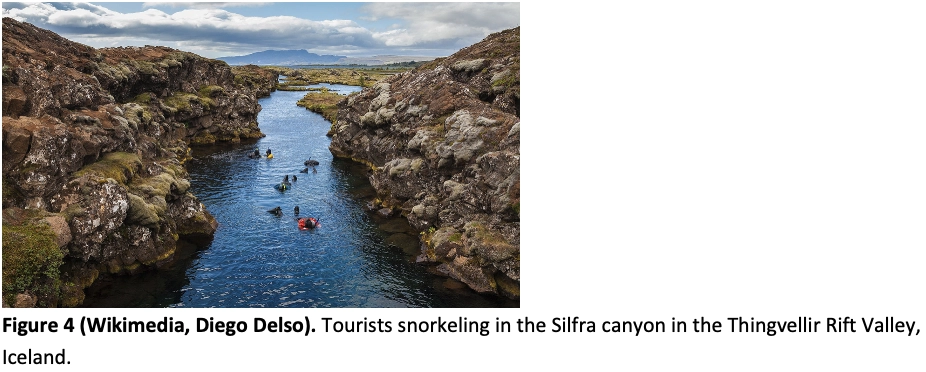
Many volcanic islands have formed along the MAR. Iceland is the most well-known of these islands, where the MAR runs straight through the middle of the country. The West side of Iceland is on the North American Plate, and the East side of Iceland is on the Eurasian Plate. Visiting the Thingvellir Rift Valley, a section of the MAR which is about 10,000 years old, is a popular tourist attraction in Iceland, where the volcanic, earthquake, and seafloor spreading activity is highly visible.
The Azores, an autonomous region of Portugal, is an archipelago on the MAR. The Scandinavian Vikings are believed to be the first to have visited the island, possibly as early as 800 CE. The Azores (composed of nine islands) were settled in 1427 by Portuguese navigator Diogo de Silves. They quickly became a strategic point for trade and naval operations, as it is a convenient stopping point for boats travelling across the Atlantic. The region became a target for pirates in the 16th and 17th centuries, leading to the fortification efforts that are still evident today. During World War II, the Azores became a military base for Allied Forces. The US built an air base on Santa Maria Island. During the Cold War, the United States used Terceira Island to surveil the Soviet Union’s naval activity. The Azores are the last hub of whaling, which only ended there in 1987. The archipelago remains a hub for deep-sea research.
Another example of volcanic islands are the Canary Islands, formed by a magmatic hot-spot. The Canary Islands are an archipelago made up of 7 islands off the northwest coast of Africa, colonized by Spain in the early 15th century. The Canary Islands served as a blue-print for the colonial fate of the Caribbean, involving the establishment of sugar plantations, exploitation of the local Guanche people, and the spread of Spanish catholicism and culture. During the 1800s, many canarians immigrated to Cuba, Puerto Rico and Venezuela, and would export sugar, dye, and rum there. To this day, the islands are an Autonomous Community under Spain.
The Mid-Atlantic Ridge is one of the most significant examples of continental drift and seafloor spreading. As the ocean crust moves into the continents, it is subducted and eventually resurfaces at the Mid-Atlantic Ridge. Think of it as a conveyor belt running; the start of the belt is the Mid-Atlantic Ridge, and the end of the belt is a continent, and just like a conveyor belt, the sea floor goes from the crust cycling down into the mantle and back up to the crust once again. If you were to take samples from both the Mid-Atlantic Ridge and along the coast of either the Americas or Europe and Africa, you would see that the sample from the ridge is much younger than the one along the coast. If you continue to repeat this process, you will see that the floor in both places almost constantly remains the same age, proving furthermore that the floor is cycling. The more that seafloor spreading happens, the more it pushes into the continents, slowly moving them over many years.
Thanks for tuning in for this one!
Blog Post 2
Credits:
Mason Diaz
Emma Feehan
Max Joyce
Paavni Vyas
Rhys Pyatt
Aaron Mico
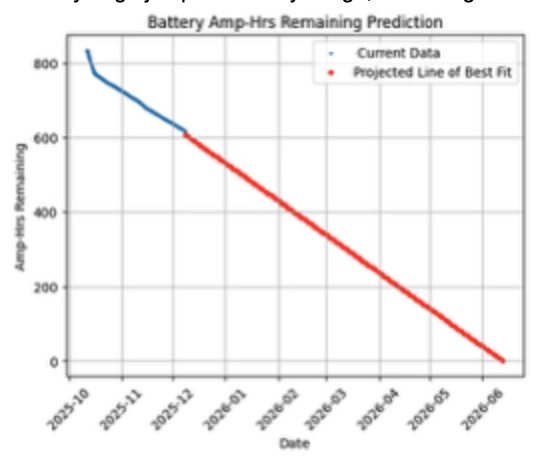
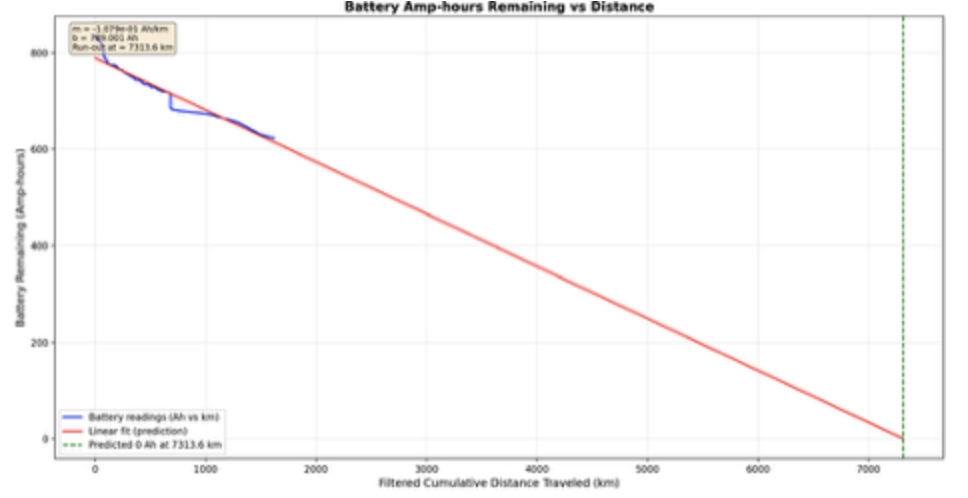
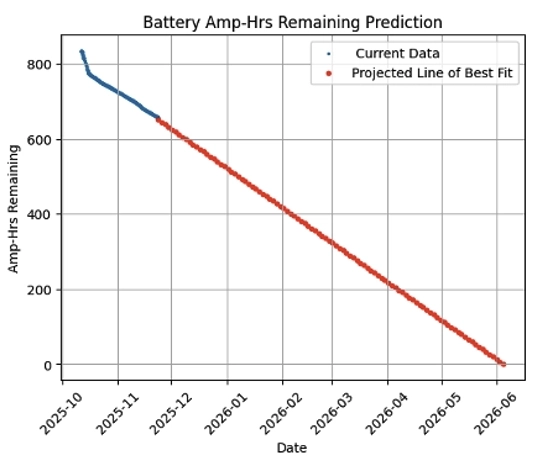
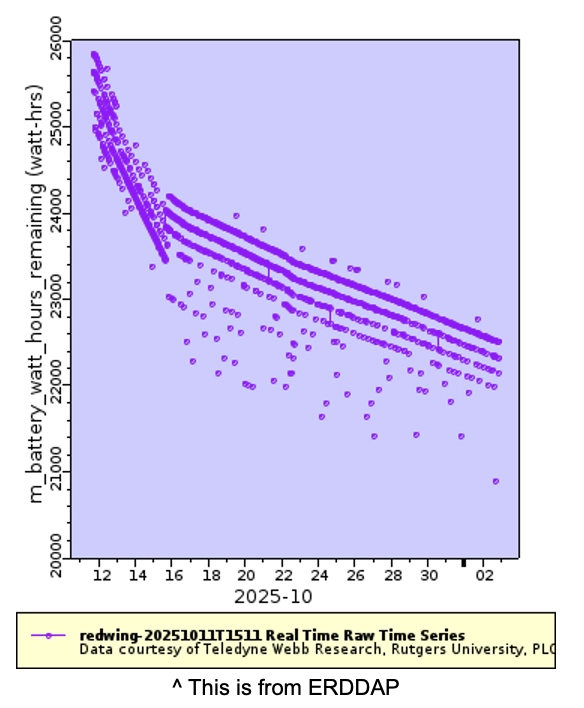
Over the course of Redwings’ mission, its battery usage has stayed very consistent. With a steady decline after making it across the shelf, it doesn’t seem like it’s run into any significant trouble. Using the data we already have, an estimated line of best fit shows that if we keep this consistent rate, we’d have enough battery to last until June. Obviously, the rest of the mission will likely be very different than what is shown here. The bottom line is that there doesn’t seem to be any large jumps in battery usage, which is great to see!
Going forward, we also plan to implement a simple battery tracker on the website, featuring an easy-to-understand fuel gauge that updates in real-time, displaying the current kilowatt-hours and the total days at sea. Although it may not look its best right now, we plan to refine it further before it’s added to the website.
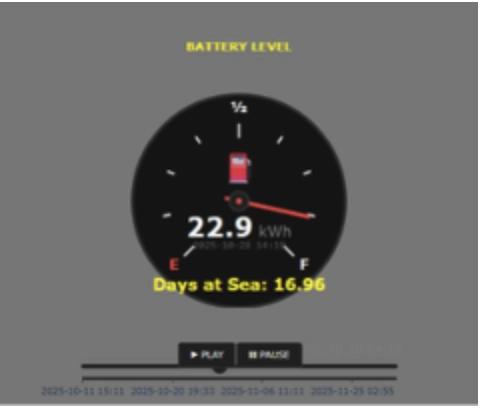
Video of the Gauge with Slider
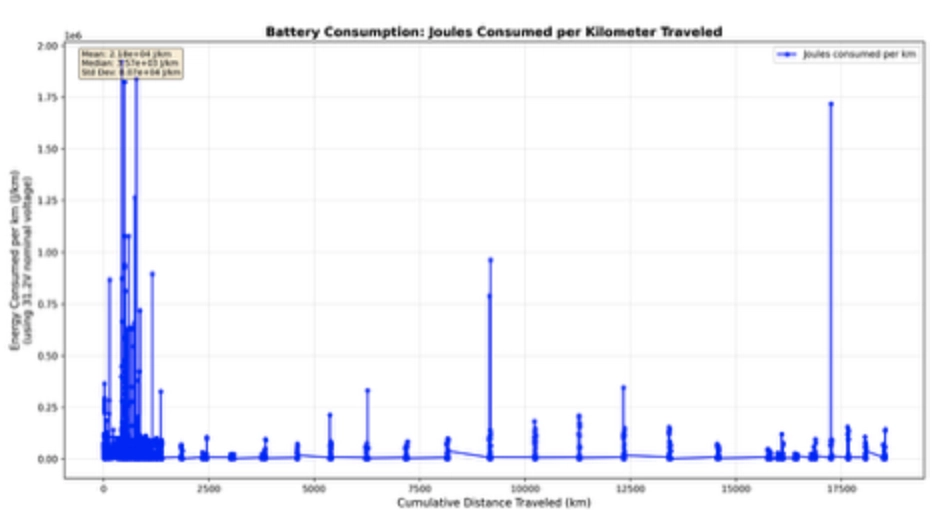
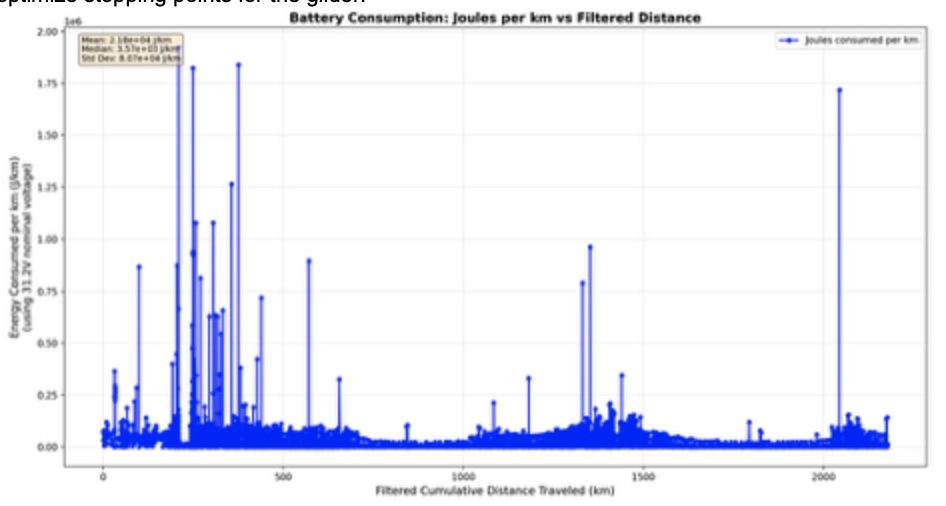
Some errors occurred when plotting the data, involving plotting the battery usage over large distances due to the sampling rate of the glider. The glider provides its location frequently, and this artificially inflates the distance the glider has traveled. The glider has traveled ~2,200 kilometers, but according to the data, it has traveled over 17,000 kilometers. You can filter the data specifically to find an accurate distance traveled. Doing this results in a more accurate result of about ~2,177 kilometers. Doing this could allow you to predict how long the glider can operate before requiring a new battery or recharge. This would be great if we wanted to further optimize stopping points for the glider.
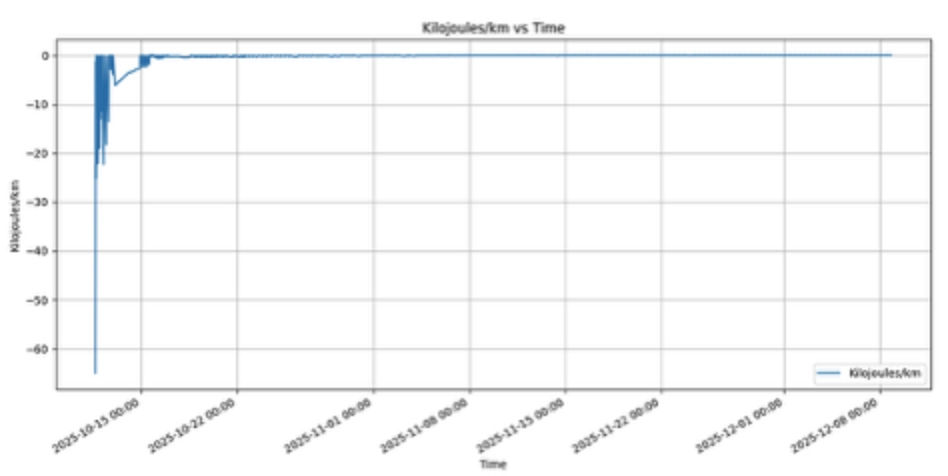
We decided to look into the kilojoules/km over the course of the trip so that we could get a better understanding of how the battery was being consumed over its journey. Looking at the kJ/km is similar to looking at the miles per gallon in a car.
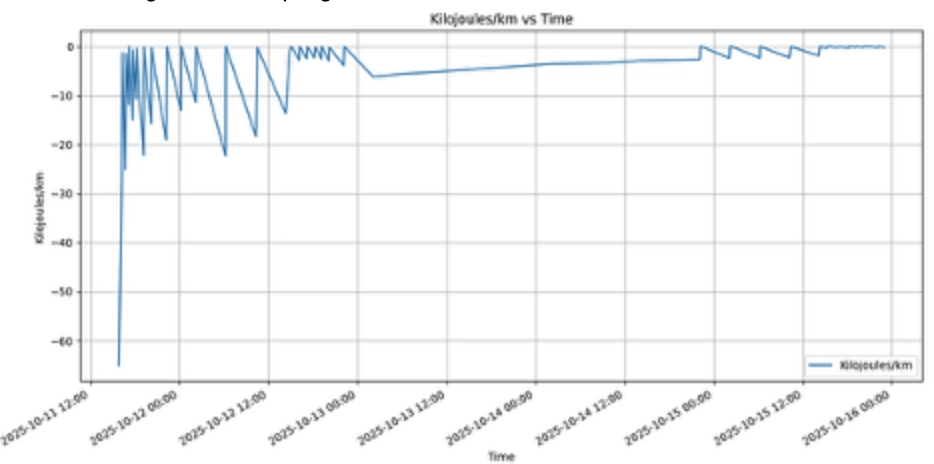
At the beginning of the journey, from October 11th to October 16th, the glider was in a “bathtub maneuver.” While in the bathtub maneuver, it uses a lot more battery since it is engaging its rear thrusters. It was using an average of 3.77 kJ/km during that time.
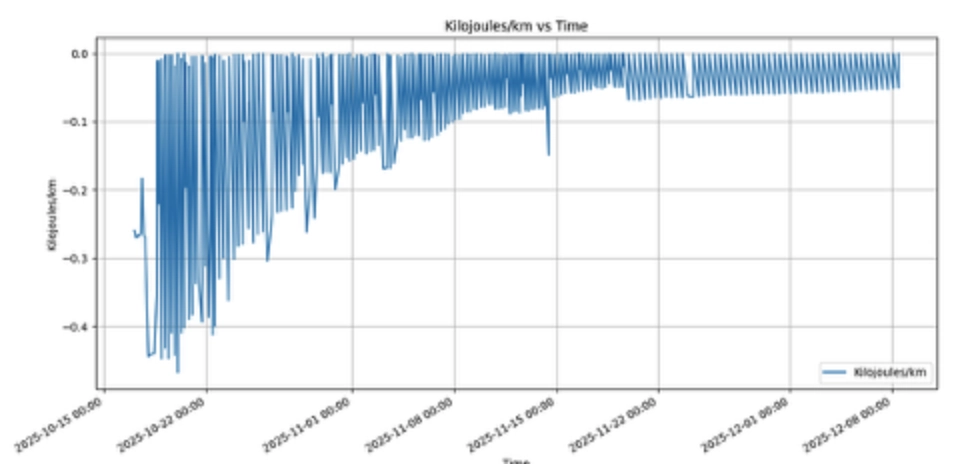
Once the glider reached the shelf break, around October 16th, the glider returned to reach normal conditions. This cut down the kJ/km usage by about 97.1%. It went from 3.77 kJ/km to using .11 kJ/km.
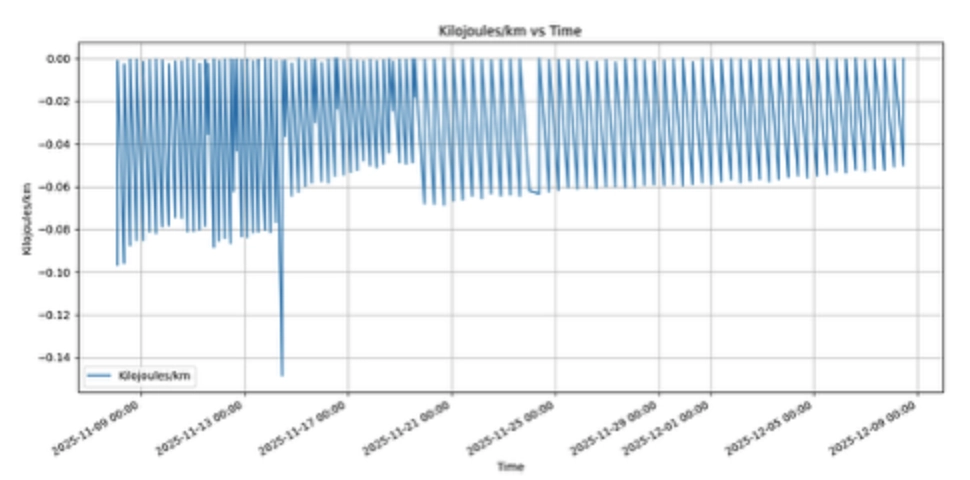
Once the glider reached the Gulf Stream, around November 8th. We are using the fast-moving Gulf Stream to help us cross the Atlantic quickly. Being in the Gulf Stream has allowed us to have an average usage of .03 kJ/km, or a 72.7% difference from the continental shelf break to the Gulf Stream.
Blog Post 7 Credits:
Jason Cardona, Marine Biology, Class of 2026
Tolga Kose, Marine Biology, Class of 2027
Hikari Oshiro, Marine Science, Class of 2026
Emily Smietana, Marine Biology, Class of 2028
Devorah Zambas, General Anthropology, Class of 2026
Aidan Stumpf, Marine Biology, Class of 2027
Introduction:
Hello everyone!
This is the final blog post from the Fall 2025 Topics in Marine Science class. To wrap things up, let’s look at Redwing’s journey from launch to today. Since its launch from the Woods Hole Oceanographic Institution (WHOI) in Massachusetts on October 10th, 2025, Redwing has been steadily gliding across the North Atlantic, diving, and collecting data.
Navigation – Devorah and Emily
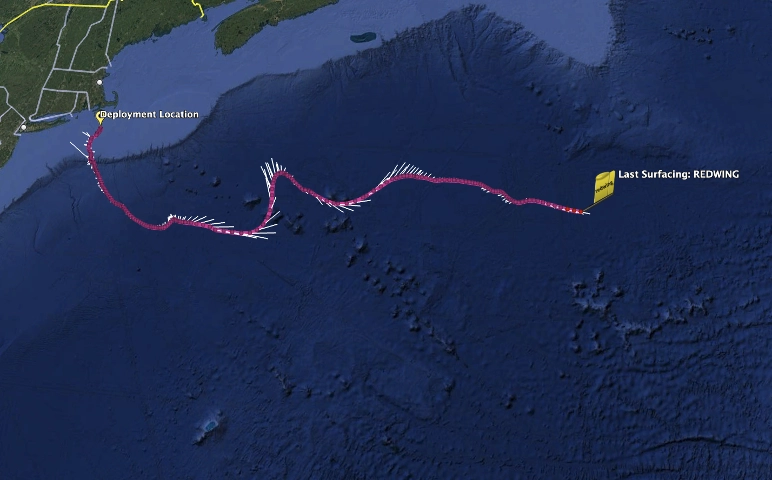
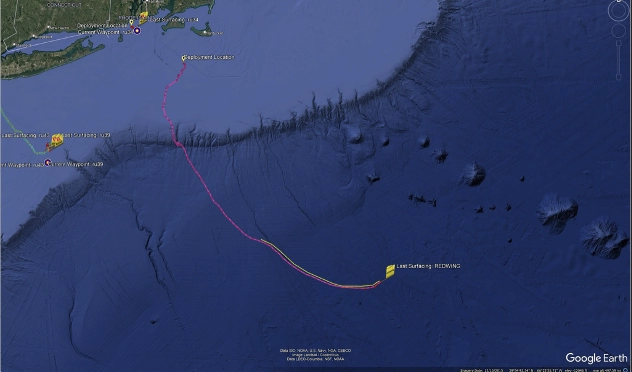
Since launching from off the coast of Massachusetts, Redwing has traveled a remarkable distance across the North Atlantic of 2144 km (as of 12/7/2025). To put that into perspective, that’s roughly the distance from New Jersey to Miami. As of December 7th, 2025, Redwing is located at approximately 38° 16.132’N 51° 42.821’W in the North Atlantic and we are still riding in the Gulf Stream (as you can see below!).
As of Redwing’s last resurfacing, it is moving at about 0.69 m/s, which is about 1.5 mph. While that sounds slow on land, it’s a solid cruising pace for an underwater glider navigating shifting currents while repeatedly diving and climbing through the water column.
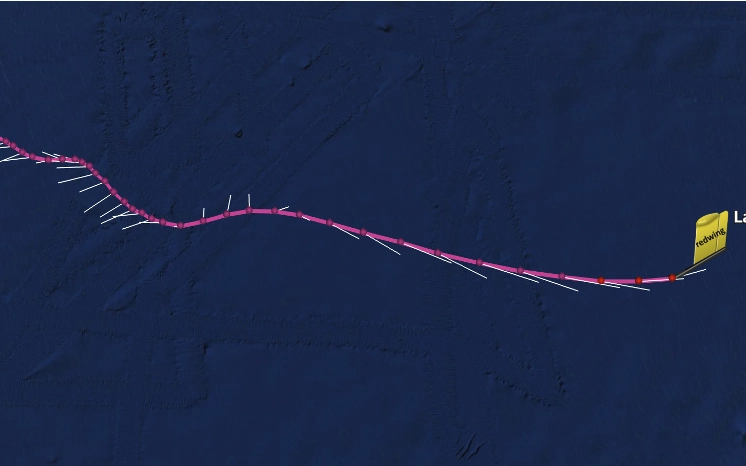
Above is the zoomed in look of where Redwing has traveled in the last week (since around 12/1/2025 to 12/8/2025), which is about 309.85 km.
Now, let’s compare the data Redwing is currently getting to what other gliders have gathered on transatlantic missions.
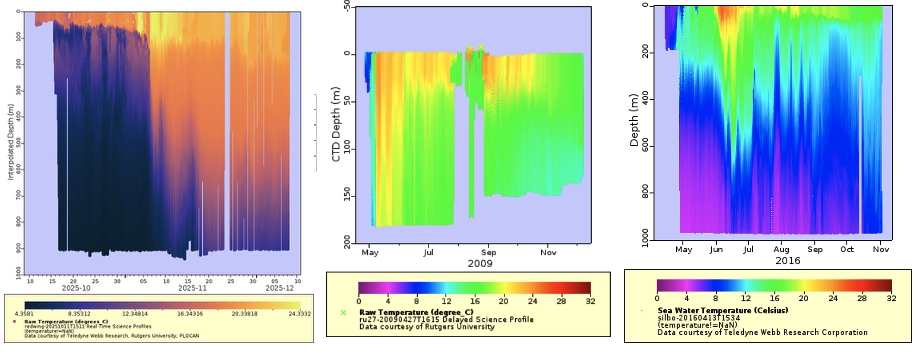
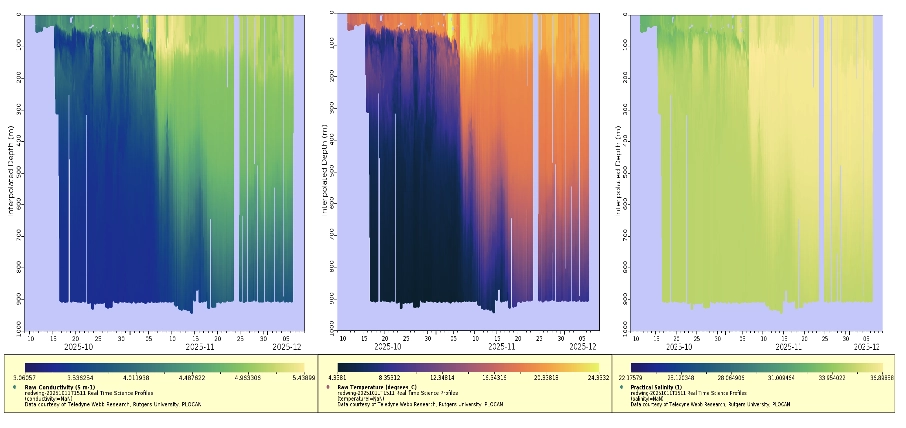
In order left to right, these are Redwing, the 2009 Challenger mission, and the first leg of Silbo’s Atlantic circumnavigations temperature graphs. The first two months of the Challenger and Silbo graphs specifically are what we can look at today, as the Redwing has only been out for two months and so that is where the data overlap stops. Both Redwing and Silbo were launched off of Cape Cod, and the Challenger mission was launched off of the NJ coast. In addition, Silbo and the Challenger mission were launched in the spring, while Redwing was launched in October,
While the Challenger glider was a much shallower diver, its graph only reaching approximately 175 meters, both it and Silbo show similar patterns in the oceans temperature that are less present in Redwings. SIlbo’s data very clearly shows the horizontal temperature banding that is characteristic of summer oceans, while Redwing shows more of the mixing that winter weather brings, along with an overall lower temperature.
As the mission continues, the data Redwing’s collected will continue to grow and become easier and easier to compare to the data from Silbo and the Challenger mission, as well as many others.
This mission comes with its own unique insights into power and how speed affects it and its sensors.
Engineering – Jason and Tolga
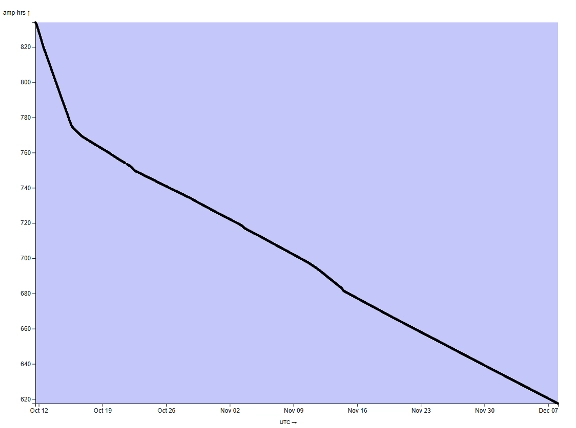
The first thing to look at is the battery that has been used and what is left. Redwing has used a total of approximately 200 amp-hrs since the day it was launched. It started at around 830 amp-hrs, and is now down to approximately 620 amp-hrs remaining. In the last week, Redwing has used approximately 18 amp-hrs (on average, 4.7 amp-hrs per day). Comparing the battery used to what is predicted will be used by this month, the prediction is almost spot on, if anything there is more battery left than predicted! As long as the slope is consistent, there should be no issues making it to our first destination, at least in regards to battery life
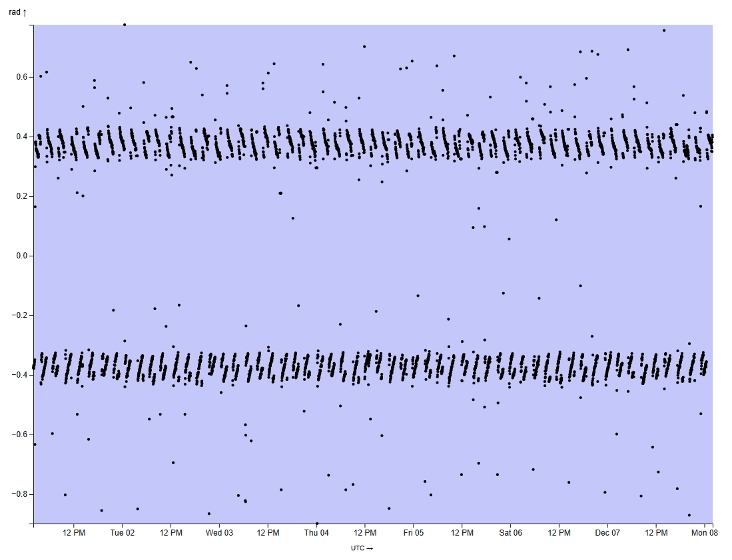
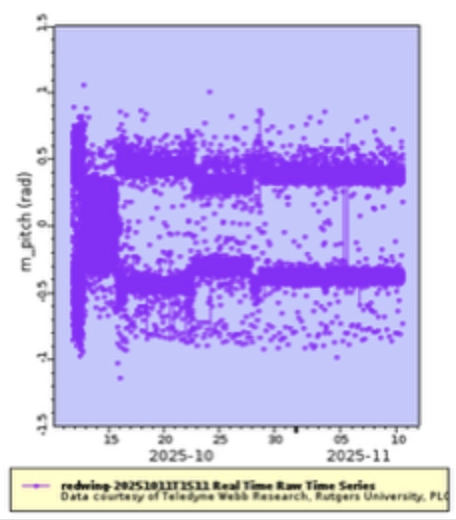
Now, to direct our attention to the roll and pitch. This graph shows that the pitch sits generally around 0.4 to -0.4 rads, or about 23o. The data is consistent with previous weeks, so there is no cause for concern.
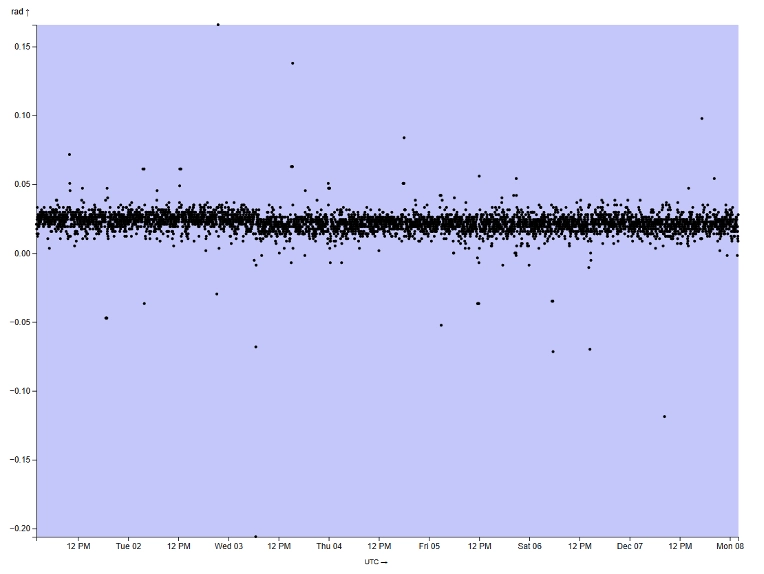
Looking at the roll graph, it appears that a majority of the points tend to hover between 0 and 0.5 radians. This positive roll indicates that the glider is most likely just trying to stay in the gulf stream. Overall, the mechanical aspects of the glider appear to all be working as it is intended!
Science – Hikari and Aidan
Aidan: Conductivity, Temperature, Salinity all vs depth
Conductivity Temperature Salinity
For the last blog post, we will be looking at how conductivity is affected by salinity and temperature, and why conductivity is important. Conductivity is a measurement of how much electricity can be conducted through a material. In addition, conductivity also determines if the water is saltwater or freshwater. Conductivity is an important measurement to examine because it directly affects the data for temperature and salinity. The measurement of conductivity heavily depends on the measurement of temperature and salinity in the water. An increase in salinity creates more ions in the water, while an increase in temperature causes the ions to move faster leading to higher conductivity. Temperature is important to conductivity because as temperature increases it causes conductivity to increase because the increase in temperature makes ions move faster, increasing the kinetic energy, making the ions move faster and more freely allowing the ions to have more charge thus increasing conductivity.
However, fast temperature changes can affect the accuracy of the sensors for conductivity and salinity. The sensor for conductivity takes a lot longer to adjust to temperature changes than the sensor for temperature does, which causes errors in the salinity data. One solution to this problem is implementing corrections to the data as there is a pattern to the measurement changes.
From launch to today, Redwing has traveled 2144 km, nearly ⅓ of the way across the Atlantic. While our semester is ending, and updates may get more spotty until mid-January when next semester starts, Redwing will continue to glide her way across the Atlantic, providing us with new data for every surfacing.
School Group Blog 2: Understanding Ocean Data
Credits:
Aiden Blanos
Charlie Chuya
Sonia Chen
Marc Youhana
Paavni Vyas
Hello there everyone! Welcome to another entry of the Sentinel Mission School Group’s Blog. Today, as the year and the semester are coming to the end, we’ll be discussing Ocean Data, how it can be understood and accessed, and our plans for the future! Without further ado, let’s dive into some ocean data!
Right now, we will be going over how to read the data that comes from our gliders! Once you get the hang of it, you will be able to understand what type of waters the gliders are flying through and what could mean for the area around it. Our data comes from depth profiles and time graphs. Depth profiles cover the ocean from top to bottom, taking a sort of “slice” of data that we can then use to get information from. We then take those depth profiles and put them next to each other in order of date, allowing us to see changes in one slice of water over many days, weeks, or even months.
Let’s take a look at one now…
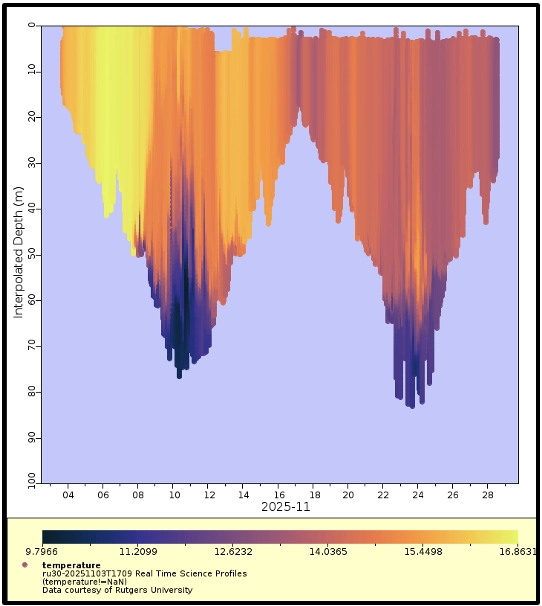
What you see here is a temperature depth graph from the deployed glider ru-30 throughout November off the coast of southern New Jersey. These are many slices taken back to back over the course of the month, creating this colorful graph shown above. The higher temperatures are marked by the warmer colors, yellow being the highest temperature. The colder temperatures are marked by cooler colors, dark blue indicates the coldest temperatures. What do you notice about where the colors are? It seems that deeper waters are colder while surface waters are warmer. This is one of the ways we can determine where our gliders are in the ocean. If the temperature they send us is colder, they’re usually deeper! Since this graph is also over time, we can also see changes in the temperature as November continues. At the surface especially, the water temperatures are slowly getting colder, which makes sense because air temperatures are cooling as we transition into winter, causing the water to get colder too.
Here’s another:
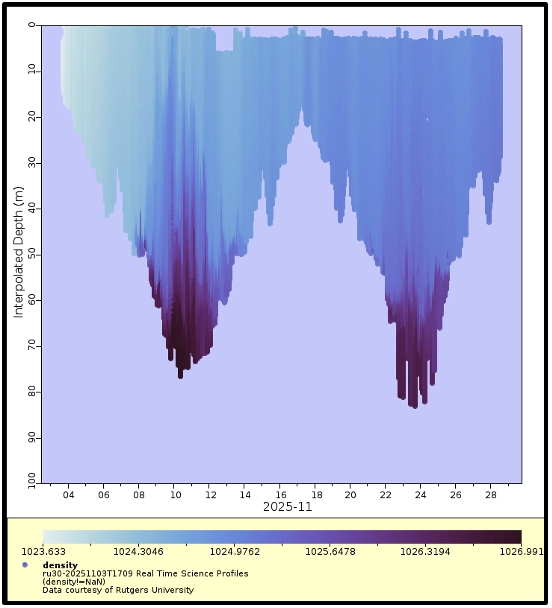
This is a density graph made in the same way the temperature graph was, with many slices of profile data over the course of November. You’ll notice that the darker colors seem to match with the previous graph, and the warmer yellow/orange colors were replaced with light and dark blues. This doesn’t mean much, just a way to differentiate between the two measurements, but the idea is the same. Again, you’ll notice that the darker blues and purples are at the deeper depths, while the colors get gradually lighter as you rise to the surface. Density in the ocean is the inverse of temperature, as water gets colder the density rises, making the water heavier and sink to the bottom. This is seen in the darker colors at the bottom, the water is heavier so it sinks! This means that since the ocean water is getting gradually cooler transitioning into the winter months, then the density should gradually rise at the same time. If you look at the surface, that’s exactly what is happening! Knowing this allows you to determine the relative temperature of water from the density without even looking at the temperature graph. While you may not know the exact degree, you can interpret the graph to mean that waters are getting cooler.
One last depth profile:
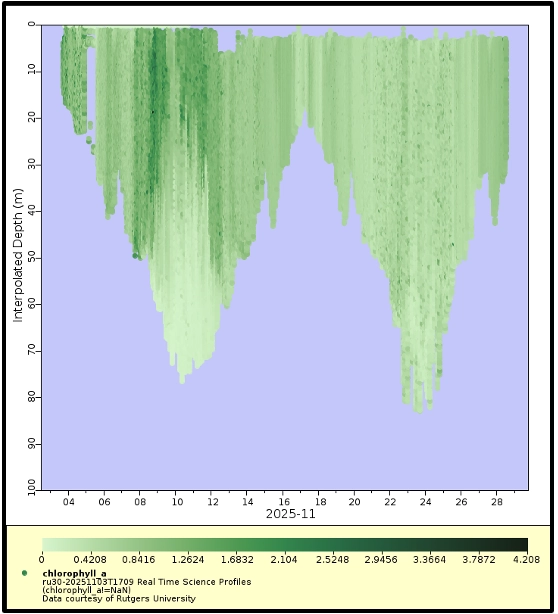
This one’s a little tricky, it’s a graph of chlorophyll-a concentrations within ocean waters. It doesn’t share the same color patterns as the other two graphs, and that’s because it’s not a measure of the properties of the water, but what’s in it. Chlorophyll-a is produced by phytoplankton, small plsnts that use sunlight to create their own food, exactly like what plants do on land. These creatures make up most of the energy in the oceans and allow many other animals up the food chain to survive. Now, what can we see in this graph that can show us what’s going on? If you look at the colors, there seems to be a relatively higher concentration of chlorophyll-a, and therefore phytoplankton, at the beginning of the month than nearing the end. Additionally, the darker colors are near the surface, meaning there are more phytoplankton there than in deeper waters. Once again, the answer to this question is the transition from fall into winter! As waters get colder and more dense in the winter, like you just discovered in the other graphs, the availability of food for phytoplankton slowly goes away. The water settles and sunlight becomes less frequent, meaning less phytoplankton can live in this area of the ocean. This is reflected in the chlorophyll-a measurements, less phytoplankton means less chlorophyll is measured. Because many fish and other creatures rely on phytoplankton for food, they become less abundant too, meaning that jobs like fishing will catch less in the winter months. Just like in the other graphs, a simple picture taken by our gliders can tell you much more about the ocean around us than meets the eye.
In many cases, events that happen in the ocean affect the people on the coast. Taking what you learned in this blog and applying it to real life can allow you to predict what might happen before the weather channel can! For example, if you see high ocean temperatures, that could potentially mean more evaporation, and a higher chance of rain. Utilizing the skill of reading graphs can not only help you learn about the ocean, but about all the things that the ocean affects.
Now that we’ve started to understand Ocean Data, let’s focus on how we can access it!
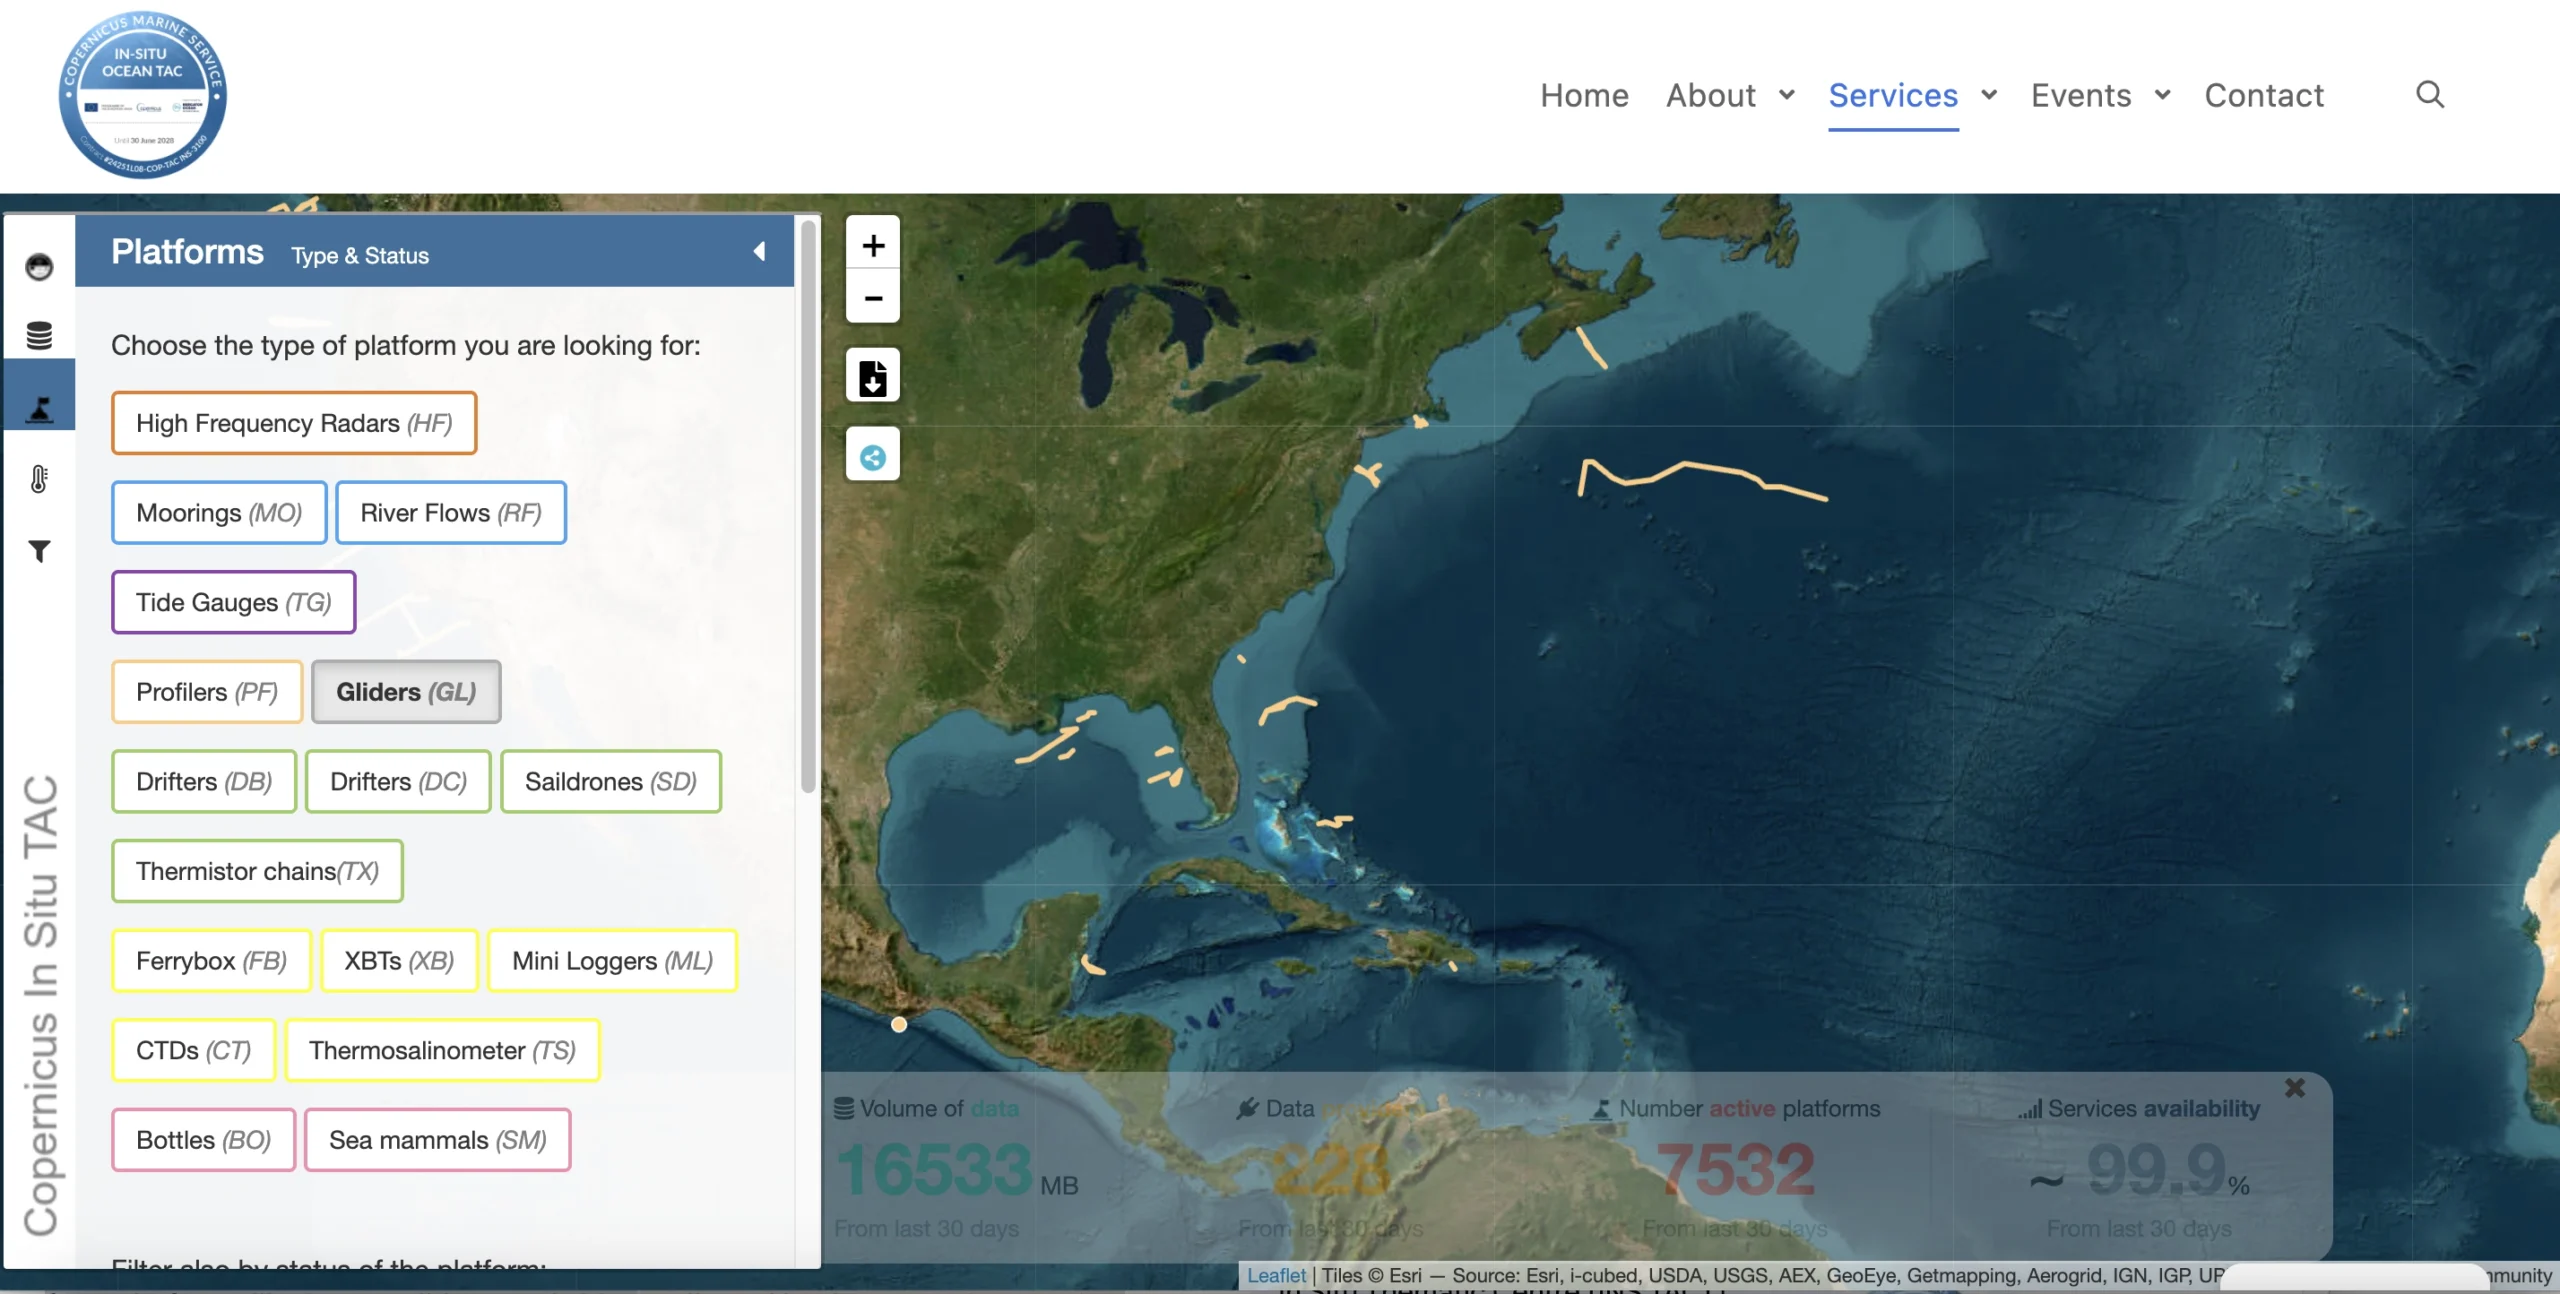
Accessing ocean data can be as simple as going on your phone or computer and opening google. Let’s start with searching for “rucool gliders” and pressing the link at the top.
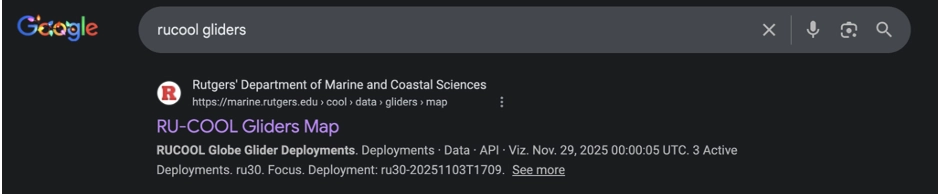
Pressing the first link will direct you to this screen that shows a list of active deployments. For this example, we will be using our very own REDWING Sentinel mission glider. Press the three dots next to where it says “REDWING”!
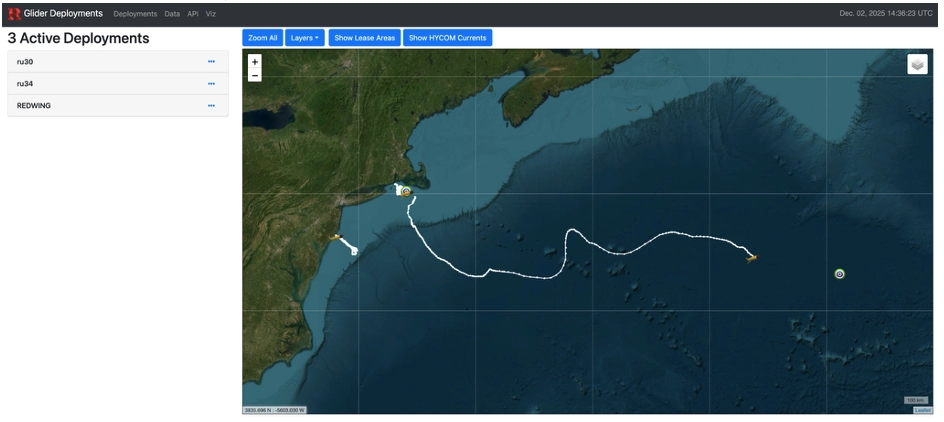
A screen like this will appear once you click on your glider of choice. On this screen, you’ll want to click on the blue link.
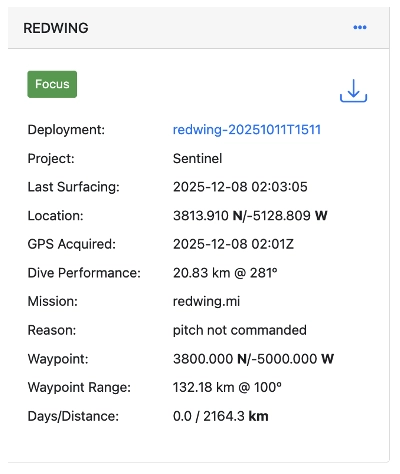
We’ve now arrived at the final step of our journey! From here, you can view some details about the glider’s deployment as well as the plots of the data that it’s collected. If you think that you’re up to the task, you can even try to make your own plots using the plotter function.
That’s just about everything that we have for this blog, and in turn, this semester! As the sentinel mission continues its deployment, we plan on bringing you more blogs, and potentially even more outreach events like the ones we held last spring. One of the key tenets of the sentinel mission has been to further the world’s understanding of our oceans, and we here at the School Blog group remain committed to that task. It’s been a great semester, and we can’t wait to keep up the work in the spring! Sea you later!
Life Group Blog 2: Barnacles and Other Atlantic Hazards
Credits:
Joshua D.
Paavni V.
Sarah S.
Sophia D.
Marc Y.
Delilah R.
Maureen S.
Leo F.
Jason S.
Joseph S.
Janae W.
Introduction (Joshua & Sophia)
Hello again! Welcome back to the life blog, where we talk about all things biology on the path to the Canaries and onward. Last month, we spoke about the seasonality of the ocean and all things it’s possible to encounter on our adventures around the globe. This month, we are going to zoom in a little farther on the specific marine life Redwing may encounter. As Redwing travels along the Gulf Stream, she uses the warm currents to help glide herself across the Atlantic. The stream acts as an ocean highway, and as we all know, we are never the only ones on the highway. Redwing is no different, as she is not the only one using the streams to travel. Microscopic larvae, algae, eels, and plankton all coast along with her. Species like barnacles, mussels, and other mollusks can attach to her outer casing, slowing her down and causing changes in pitch and roll profiles.
This month, we’ll be discussing barnacles in depth. Barnacles can be found on any floating debris that a current may carry across the ocean. There are many different species of barnacles to look out for, and as we coast along the Gulf Stream, the warm, salty waters can get a little dangerous. Barnacles are very temperature and salinity-tolerant species, meaning they can survive in temperatures ranging from 20℃-45℃ and salinities from 15-35PSU. Barnacles can cause many issues with Redwing, so we will look to avoid contact with as many as possible. Barnacles attached to Redwing can affect her roll (the left or right tilt of the glider), and this could lead to Redwing being pushed way off course and potentially being stranded. Once a barnacle attaches to something, reproduction and growth can occur very quickly, meaning that Redwing can be swarmed quickly if barnacles decide to attach. This blog will touch on exactly what barnacles are, as well as a few common species, the processes of biofouling and antifouling, and a few other potential hazards Redwing may encounter. Hope you enjoy and learn something new!
What are Barnacles? (Delilah and Leo)
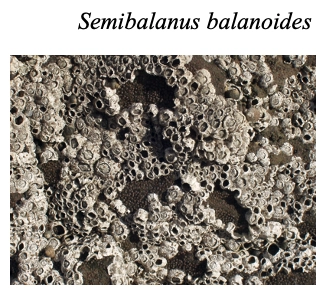
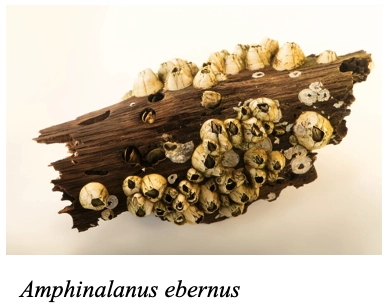
Barnacles are small, marine crustaceans that are related to crabs, lobsters, and shrimp. There are different species of barnacles, such as the Common Rock Barnacle, Semibalanus balanoides, and Goose Barnacles, Pollicipes pollicipes. Common Rock Barnacles are found from the Northeast Atlantic to the Northwest coast of Spain, while Goose Barnacles are found on rocky shores and cliffs along the coasts of the Northeastern Atlantic Ocean and Northwest Africa. Other species include Acorn Barnacles, Balanus grandula, and the Ivory Barnacle, Amphibalanus ebernus. Ivory barnacles are found in the North Atlantic, stretching down to the Caribbean, and Acorn Barnacles are found along the Northern Atlantic and extend down the coasts. They are often considered the most dangerous due to their prevalence and ability to multiply rapidly. They stick to different surfaces by releasing a cement-like glue that cures very fast. This adhesive is extremely strong, and a pressure washer is often needed to remove it.. Even after they are removed, they can leave permanent structural damage such as calcium rings. Acorn Barnacles present a serious problem for us as we pilot Redwing. We’ll have to be implement strategies to deal with them if we do interact.
How do we deal with them? (Jason & Marc)
We combat biofouling with antifouling! Antifouling can be broken down into passive and active methods, with some methods being environmentally friendly and others potentially causing some harm. Passive methods include using paint which is either non-adhesive or chips easily, coating the machinery in an abiotic substance to poison the barnacles, and avoiding danger zones for barnacles (warm shallow water). Active methods include scraping off barnacles individually (using a specific tool or a pressure washer), using ultrasound to deter the barnacles from sticking in the first place, and detection systems to release more extreme biofouling measures (like vibrations, form changes, or releasing a toxic reagent).
Additional Hazards: Eels
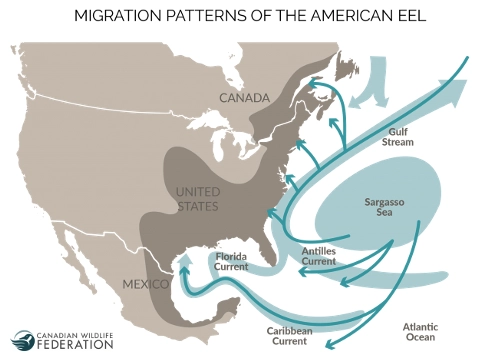
During this journey, we also need to keep in mind the annual eel migration towards the Sargasso sea. Many European and North American Eels start their journeys towards Bermuda during the cold winter months, traveling between 20-800 meters of depth throughout their daily vertical migrations. Some have even been recorded going deeper than 1400 meters! The most common species we may encounter as of Redwing’s current position is the American Freshwater Silver Eel. It takes these eels around six months of travel from the shelf-break to the Sargasso sea, meaning they will definitely be in the same waters as us. It will be important to watch out for any groups of eels migrating south, as they tend to stick together to avoid predation.
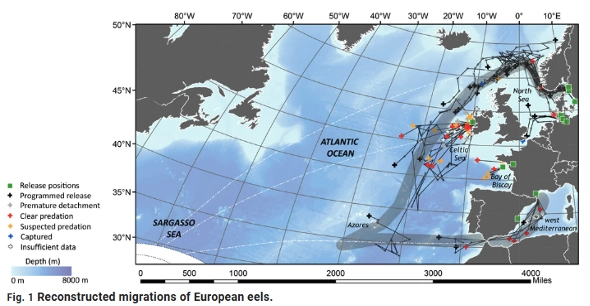
We also should be aware of the European eels heading west, as they may also be a hazard. As those species move towards the Sargassum sea, they will be directly in the path of redwing. We may have to maneuver strategically around them, or try and use current predictions to avoid them all altogether.
Additional Hazards: Sargassum (Ryan)
Another hazard that redwing might encounter on its journey through the Atlantic is sargassum algae, a type of brown seaweed that can be found in abundance in the Atlantic. Sargassum is a very common occurrence in the Atlantic as it has a tendency to form very large patches that can vary from a few feet to possibly an acre large. These patches form what is known as the “Great Atlantic Sargassum Belt,” which is located in the Southern Atlantic, between the Gulf of Mexico and the African Coast. Although redwing will not be traveling through this area, it will still run the risk of encountering large patches of sargassum in the Northern Atlantic as well, given its proximity to the Sargasso Sea. The Sargasso sea is a large gyre off the coast of the Eastern United States that is known for having very large amounts of sargassum, which it deposits in coastal communities. The northern boundary current of the Sargasso Sea is the Gulf Stream, which means that the Gulf Stream contains large amounts of sargassum that it carries from the Sargasso Sea. Redwing runs the risk of encountering these patches of sargasso in the gulf stream, which could cause it to become entangled, which would cause a variety of negative effects. Becoming entangled with Sargassum would create drag, slowing Redwing’s speed, and it could possibly even do more severe damage to Redwing, halting its progress altogether. Additionally, sargasso attracts other organisms that feed on it, so if some sargassum becomes stuck on redwing, it could possibly attract other sources of biofouling that would create even more drag.
Alright everyone, that’s all we have for this entry of the Sentinel Mission Life Group Blog. We’ve had a great time writing for you all and we hope you’ve had a great time reading. Be sure to check back next semester for more! Sea you later!

Topics in Marine Science: Sentinel Updates
Resources:
Active Glider Deployments: https://marine.rutgers.edu/cool/data/gliders/map/
Model Transect Plotter: https://transects.marine.rutgers.edu/
Glider-Model Data Comparison: https://ioos-model-comparisons.marine.rutgers.edu/
Google Earth Plotter: https://marine.rutgers.edu/cool/data/gliders/kmz/active_network_links/RUCOOLGliderFleetUpdater.kmz
Satellite Data: https://marine.rutgers.edu/cool/data/satellites/imagery/
IOOS Model Viewer: https://eds.ioos.us/map/
Sentinel Update Template:
General instructions: Teams should collaboratively fill out this document. Use the starting points below to help you craft and submit a blog post. The blog post will be what you are graded on. When we say “make” a plot, we mean through one of the links above. Don’t just copy the science plots from the active deployments page in the first link.
What I want from you for this assignment:
- Tell a story about what Redwing has been doing over the last week. Craft this as if the audience is your non-STEM neighbor. Why do they care?
- Use plots, plots, plots. What makes a good plot? Don’t just slap screenshots together. Make plots of the engineering and science data from the active deployments plotter and the location in Google Earth.
- Your blog post should have descriptive text about the mission and figures with captions. Not too long, but not too short either. You will be graded based on effort, does your blog post make me want to tune in for another one?
1) Navigation:
a) Where is Redwing now?
b) How far has it traveled in the past week? Total?
Approximately what speed is that?
2) Engineering:
As we near the end of November, it’s essential that we continue to monitor Redwing’s positioning and ensure it’s not tilting in any unusual manner. Spoiler alert: It’s looking great!
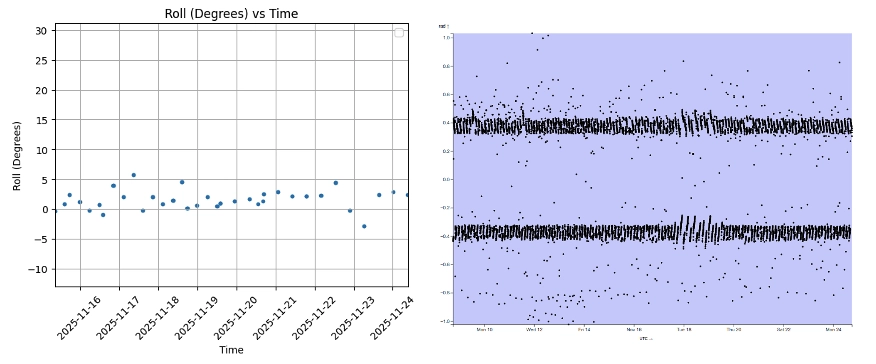
First up is the roll and pitch. Similar to last week’s blog, Redwing’s roll (shown on the left) sits between 0° and 5°, which is no cause for concern. This is most likely due to a slight difference in ballasting from the start of the mission, as it is still too early for any organisms to begin latching on. Our pitch is similar to last week’s, with a dive and climb angle of around 0.5 radians, or 28.6 degrees. On 11/18, you can see a clear variation in the pitch, and we’ll soon find out why! Overall, we’re good to keep rolling on!
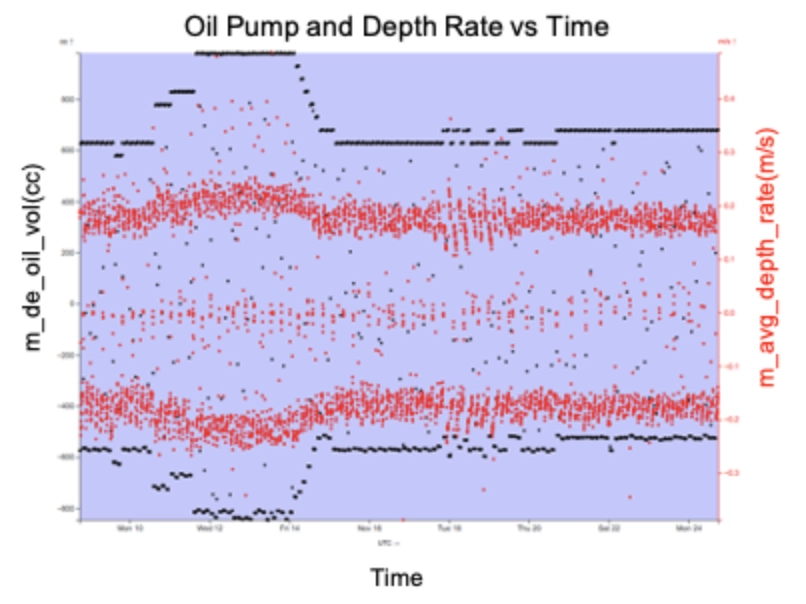
Now, here’s the culprit for our change in pitch. Plotted above in the black is our measured pump position. When it’s negative, our glider dives, and when it’s positive, our glider climbs. Generally, the greater the magnitude, the faster our glider will dive and climb. Also, the pitch tends to be steeper, which is exactly what we see here! In the red is a plot of our vertical speed through the water, and we can clearly see the trend around Nov 12, 2025. As Redwing starts to move its pump farther in and out, we can see those slightly faster climb and dive speeds associated with it. This would explain the slight change in our usual pitch as well! After about a day, Redwing returns to its expected values, and hopefully it stays that way.
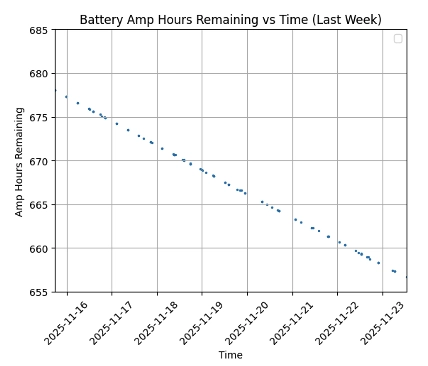
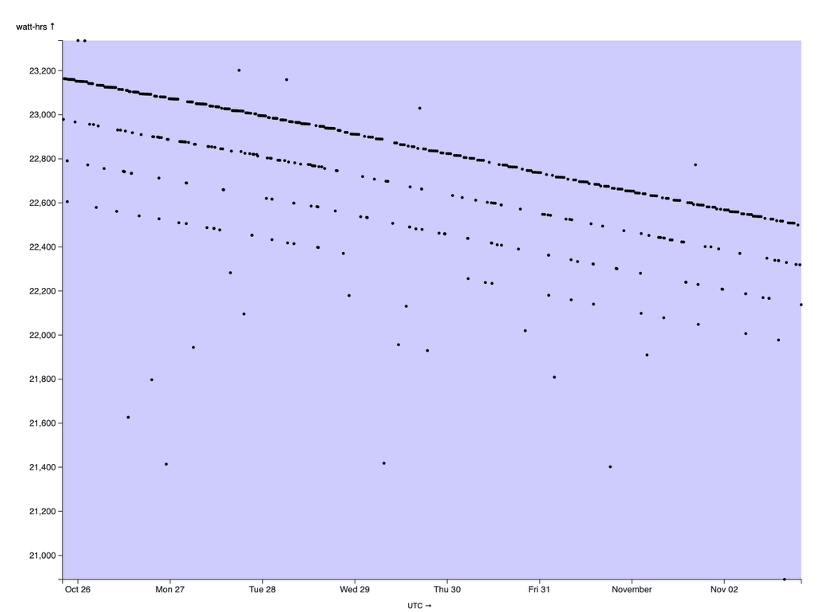
Last but not least for engineering, our battery! Over the past week, Redwing has used roughly 20 Amp-Hrs, or around 600 Watt-Hours. This is about the same as running a standard, 60-watt light bulb for 10 hours!
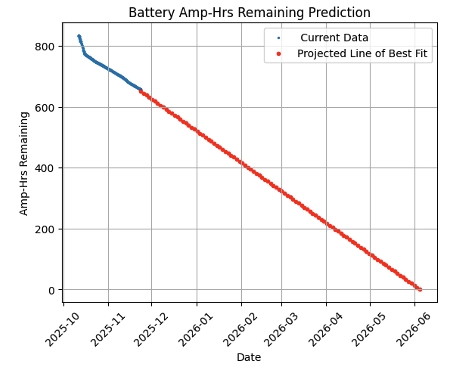
Looking beyond the battery we’ve already used up, we wanted to take a look ahead and estimate our current battery’s status. Below is a plot that shows our projected battery usage until it hits zero. This is based on the average rate our battery has been draining up until now.
Based on the plot, our battery would fully deplete by around June if we continue at the same rate, which is more than enough time to complete our first leg. Granted, this estimation is not completely accurate, as our battery usage will likely look much different going forward. However, it’s nice to get a good idea of how our battery is looking now.
3) Science:
a) How does the science data look? (use profile-sci-rt)
- Temperature salinity and density plots;
- TS plot (temperature salinity)
- Add a plot showing the past week AND over the entire deployment
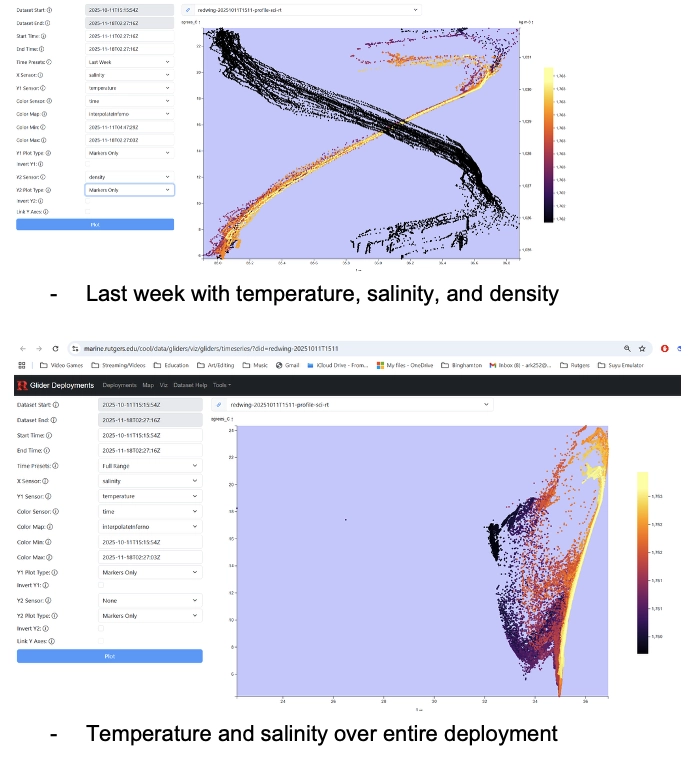
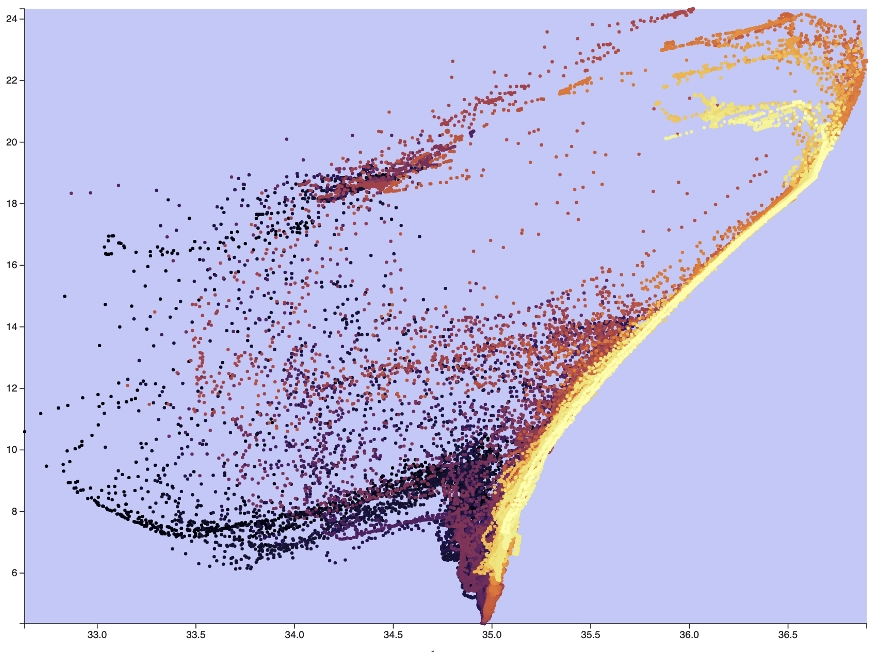
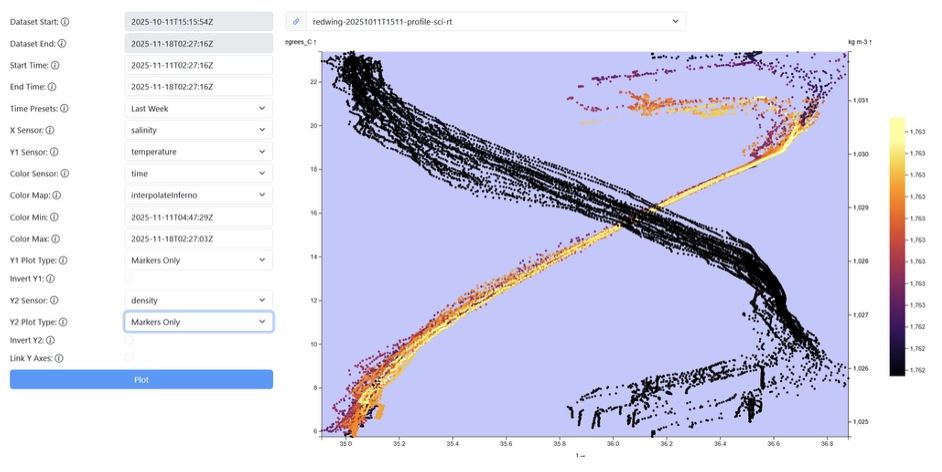
Yellow = more recent, purple = earlier
- Heavy vs light water, gulf stream = right top
- Thermocline shows much less variation
b) How does the science data look compared to the models?
11/17:
4) Do you have any questions, concerns, or exciting findings to share with Teledyne?
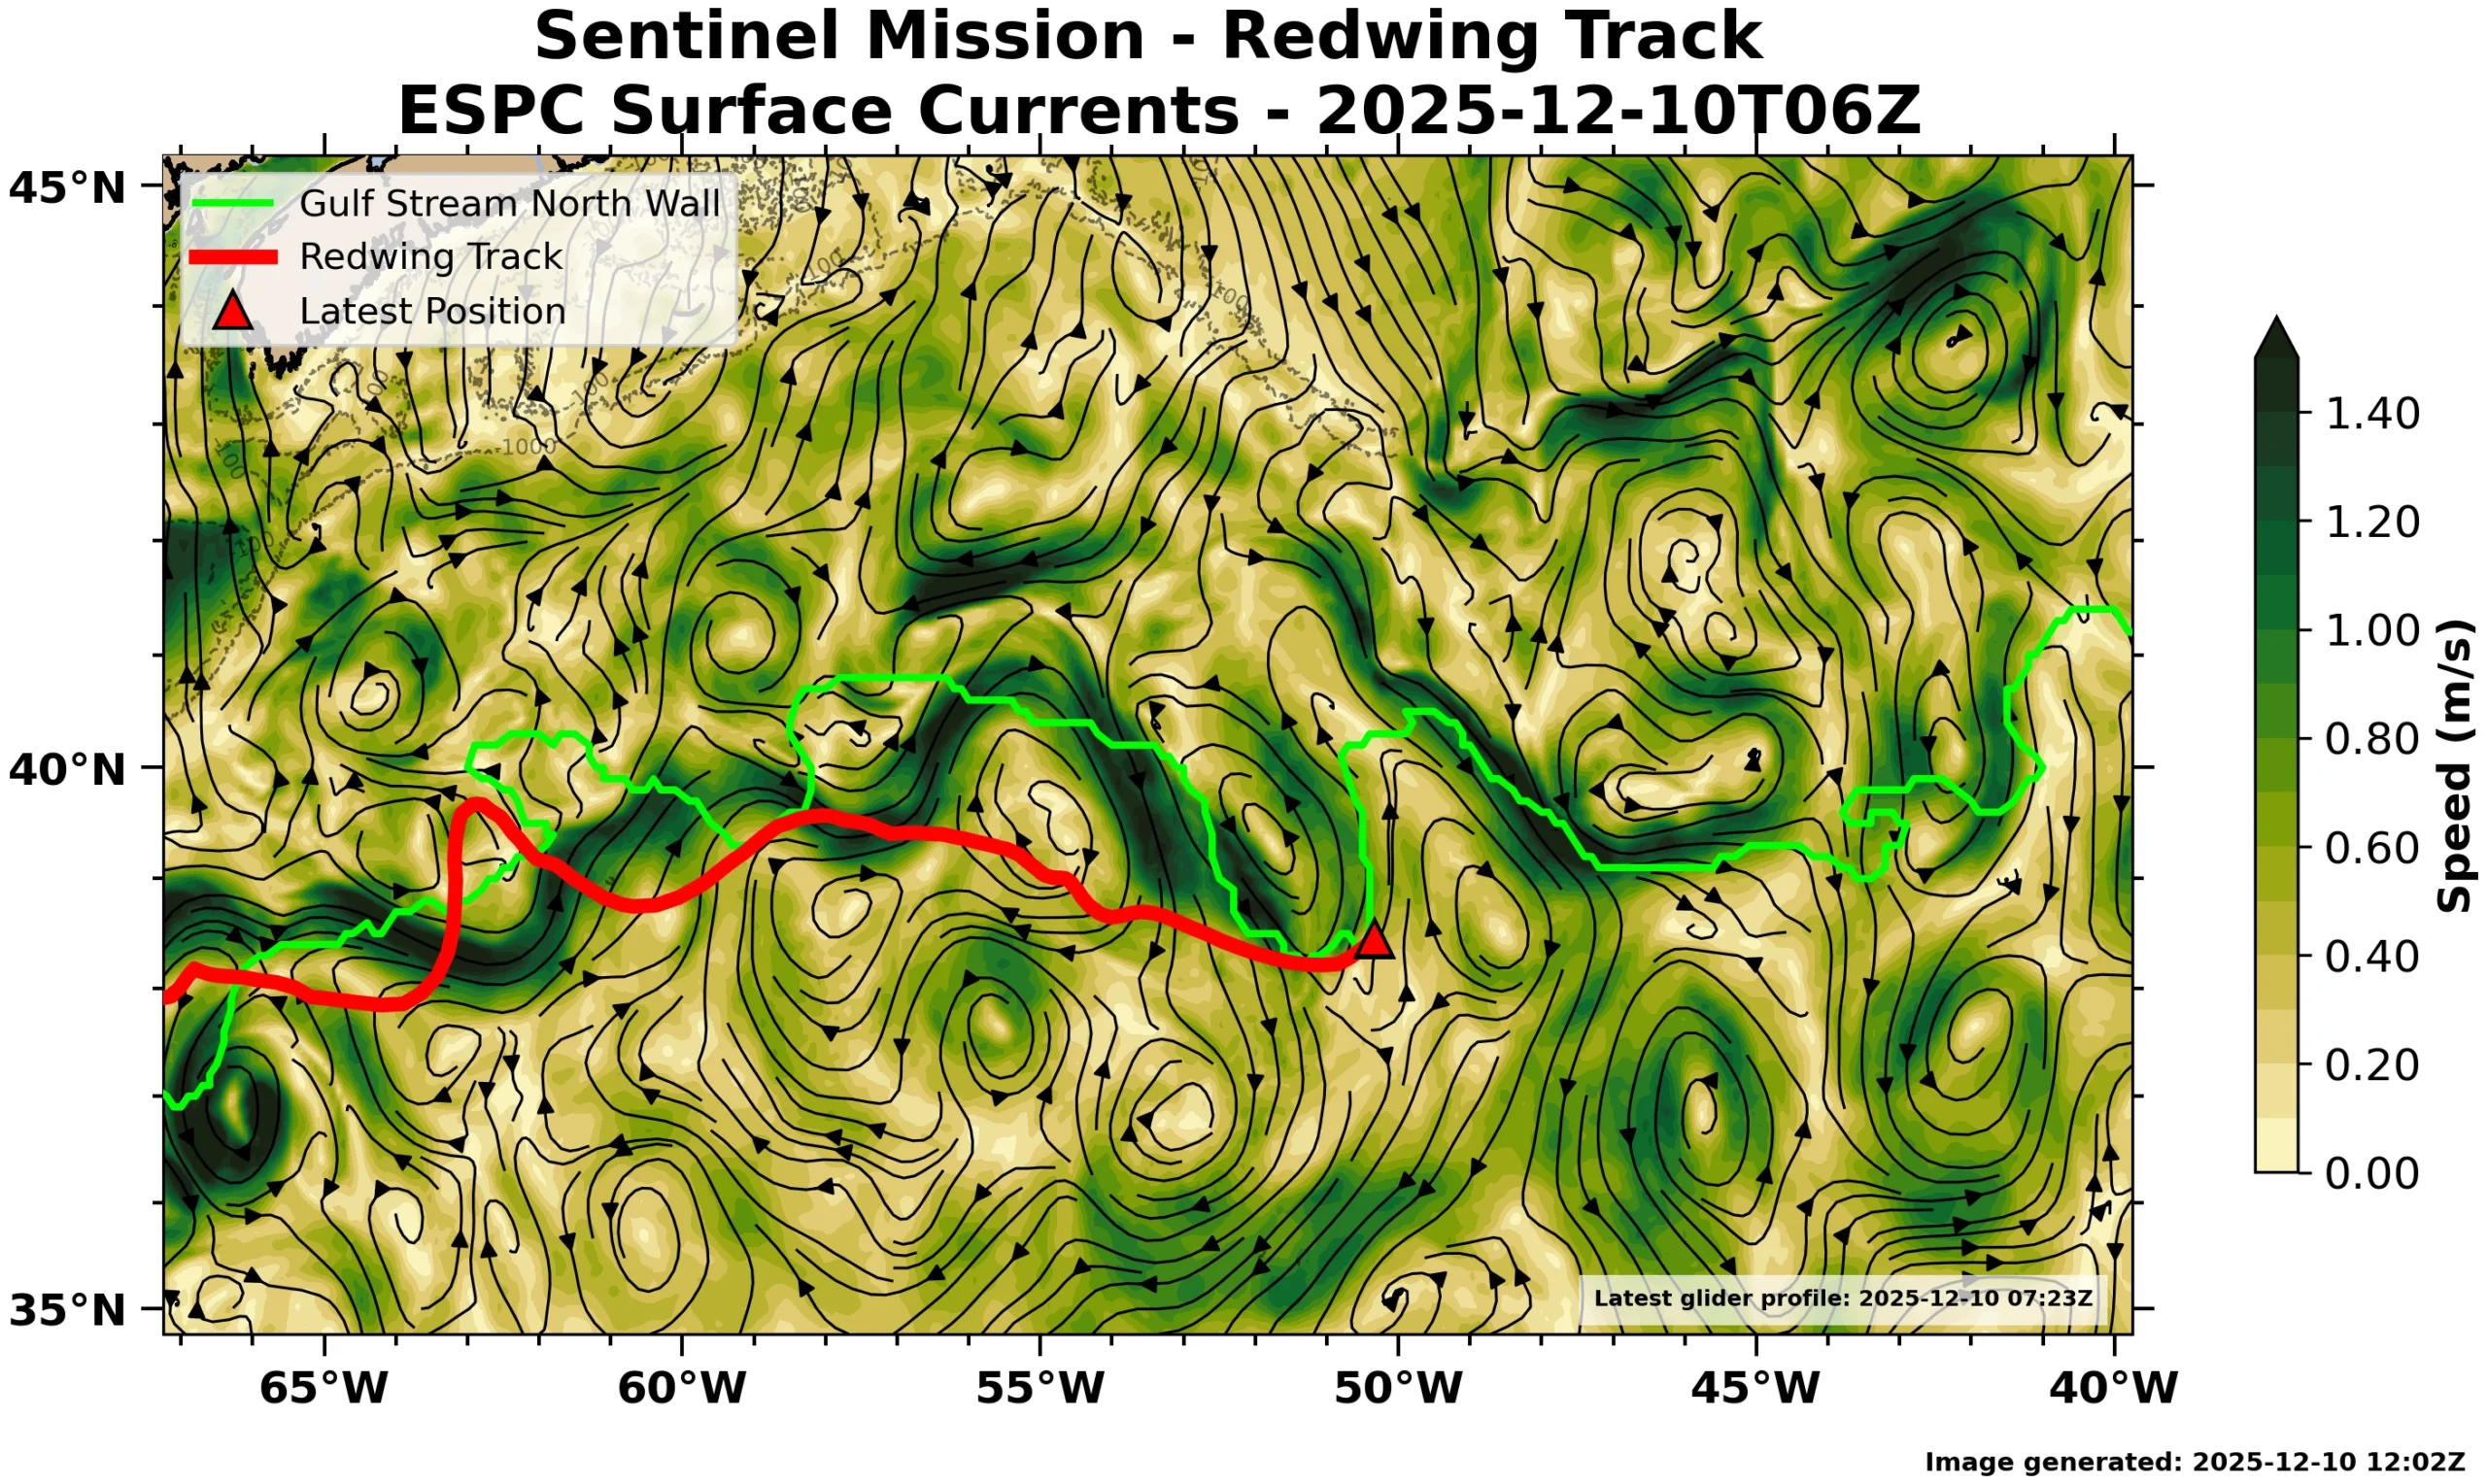
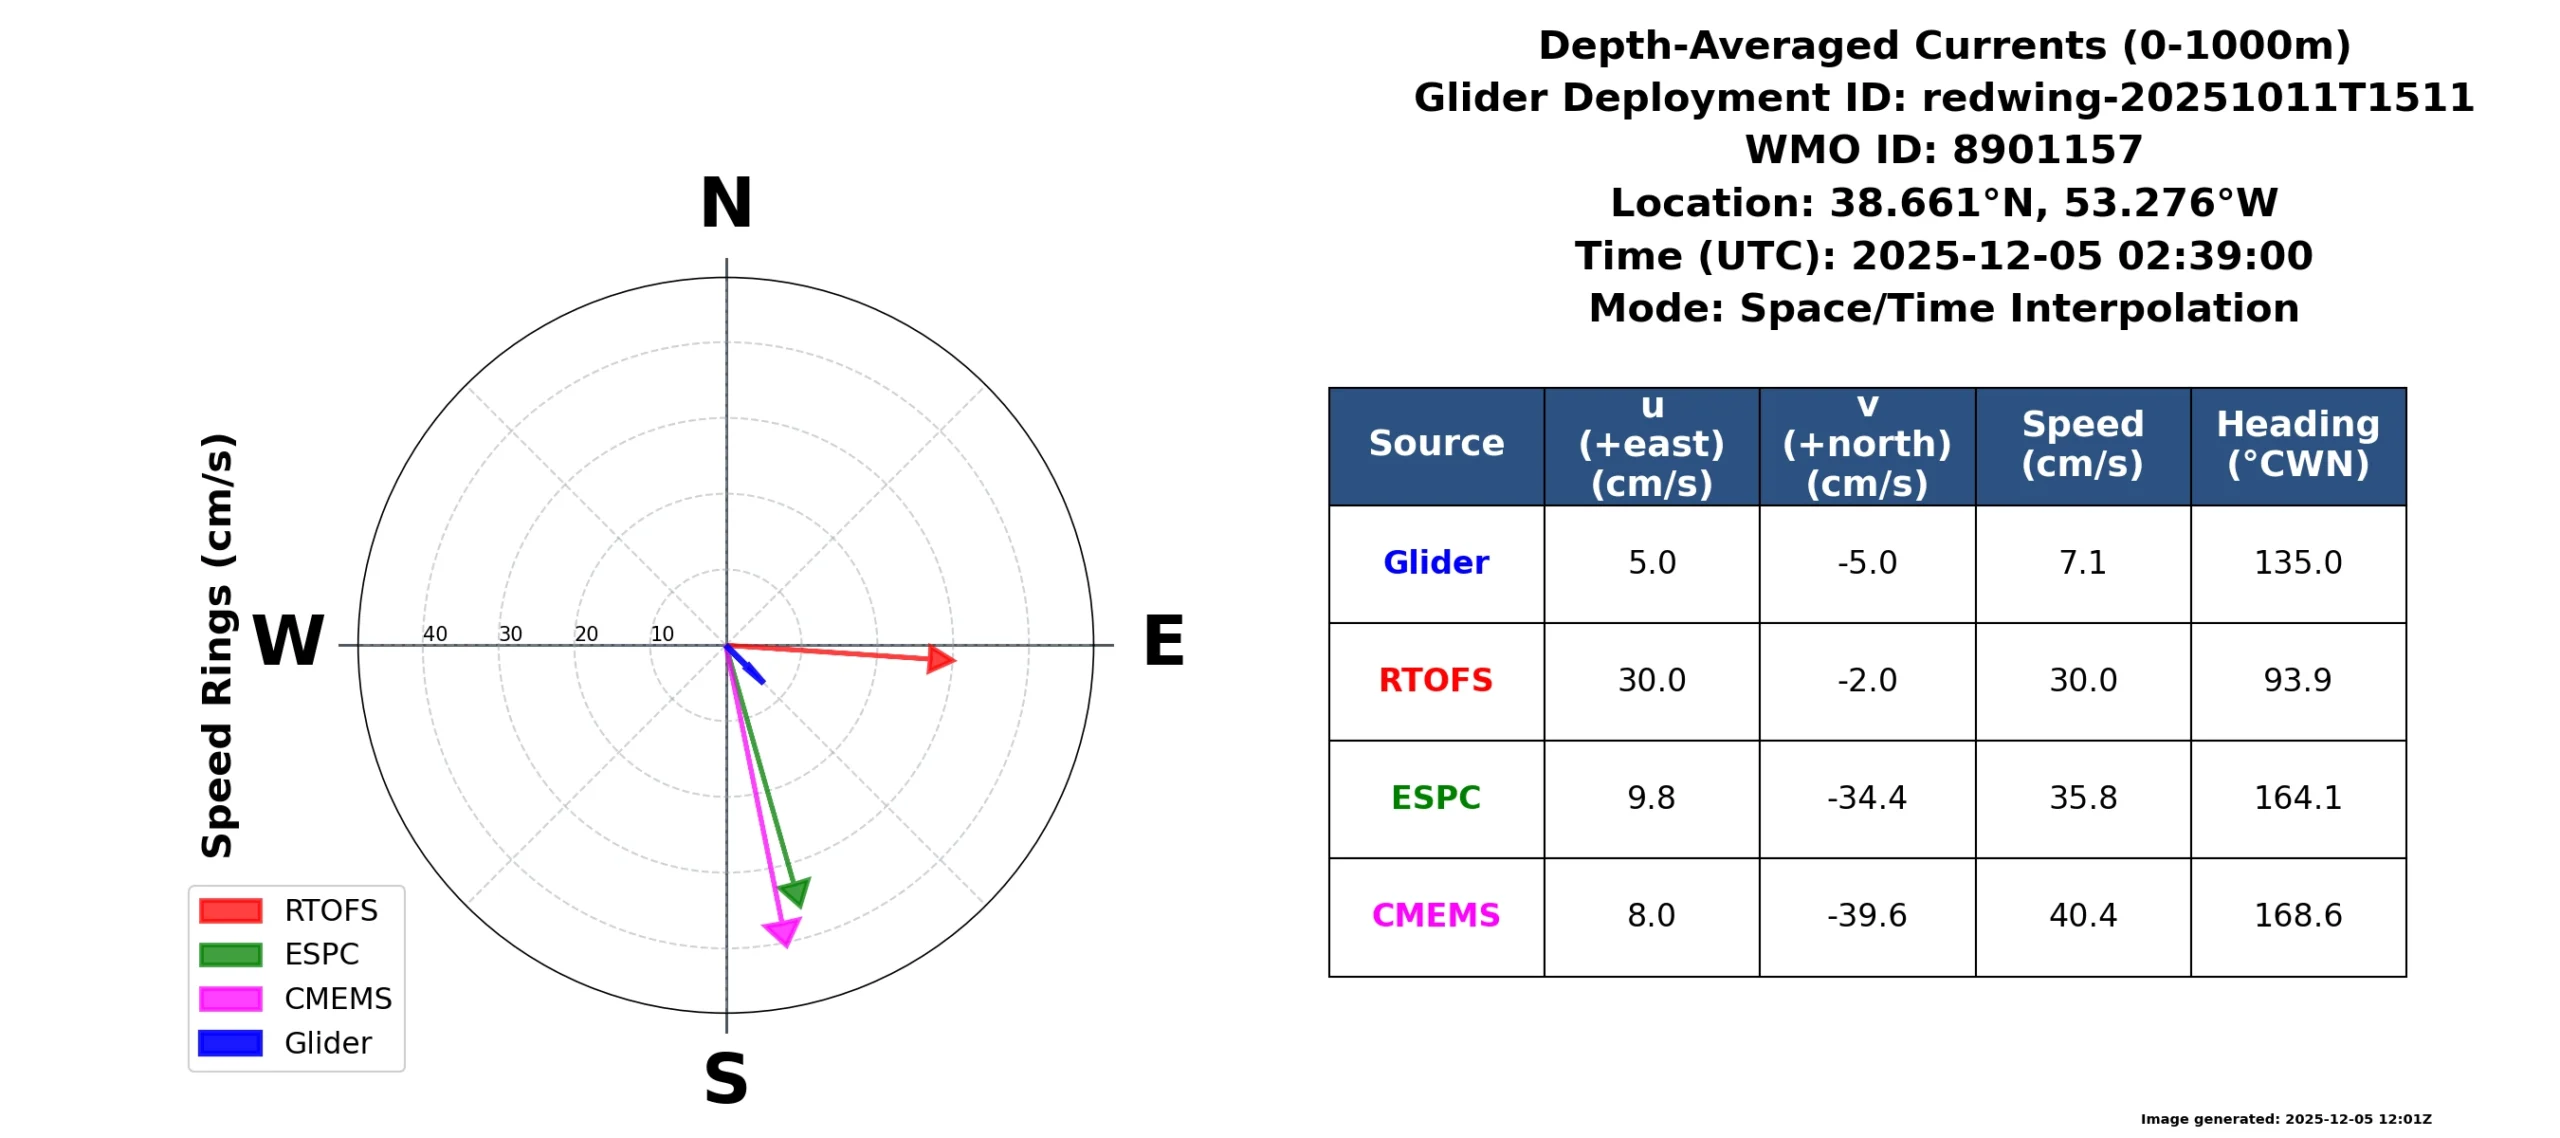
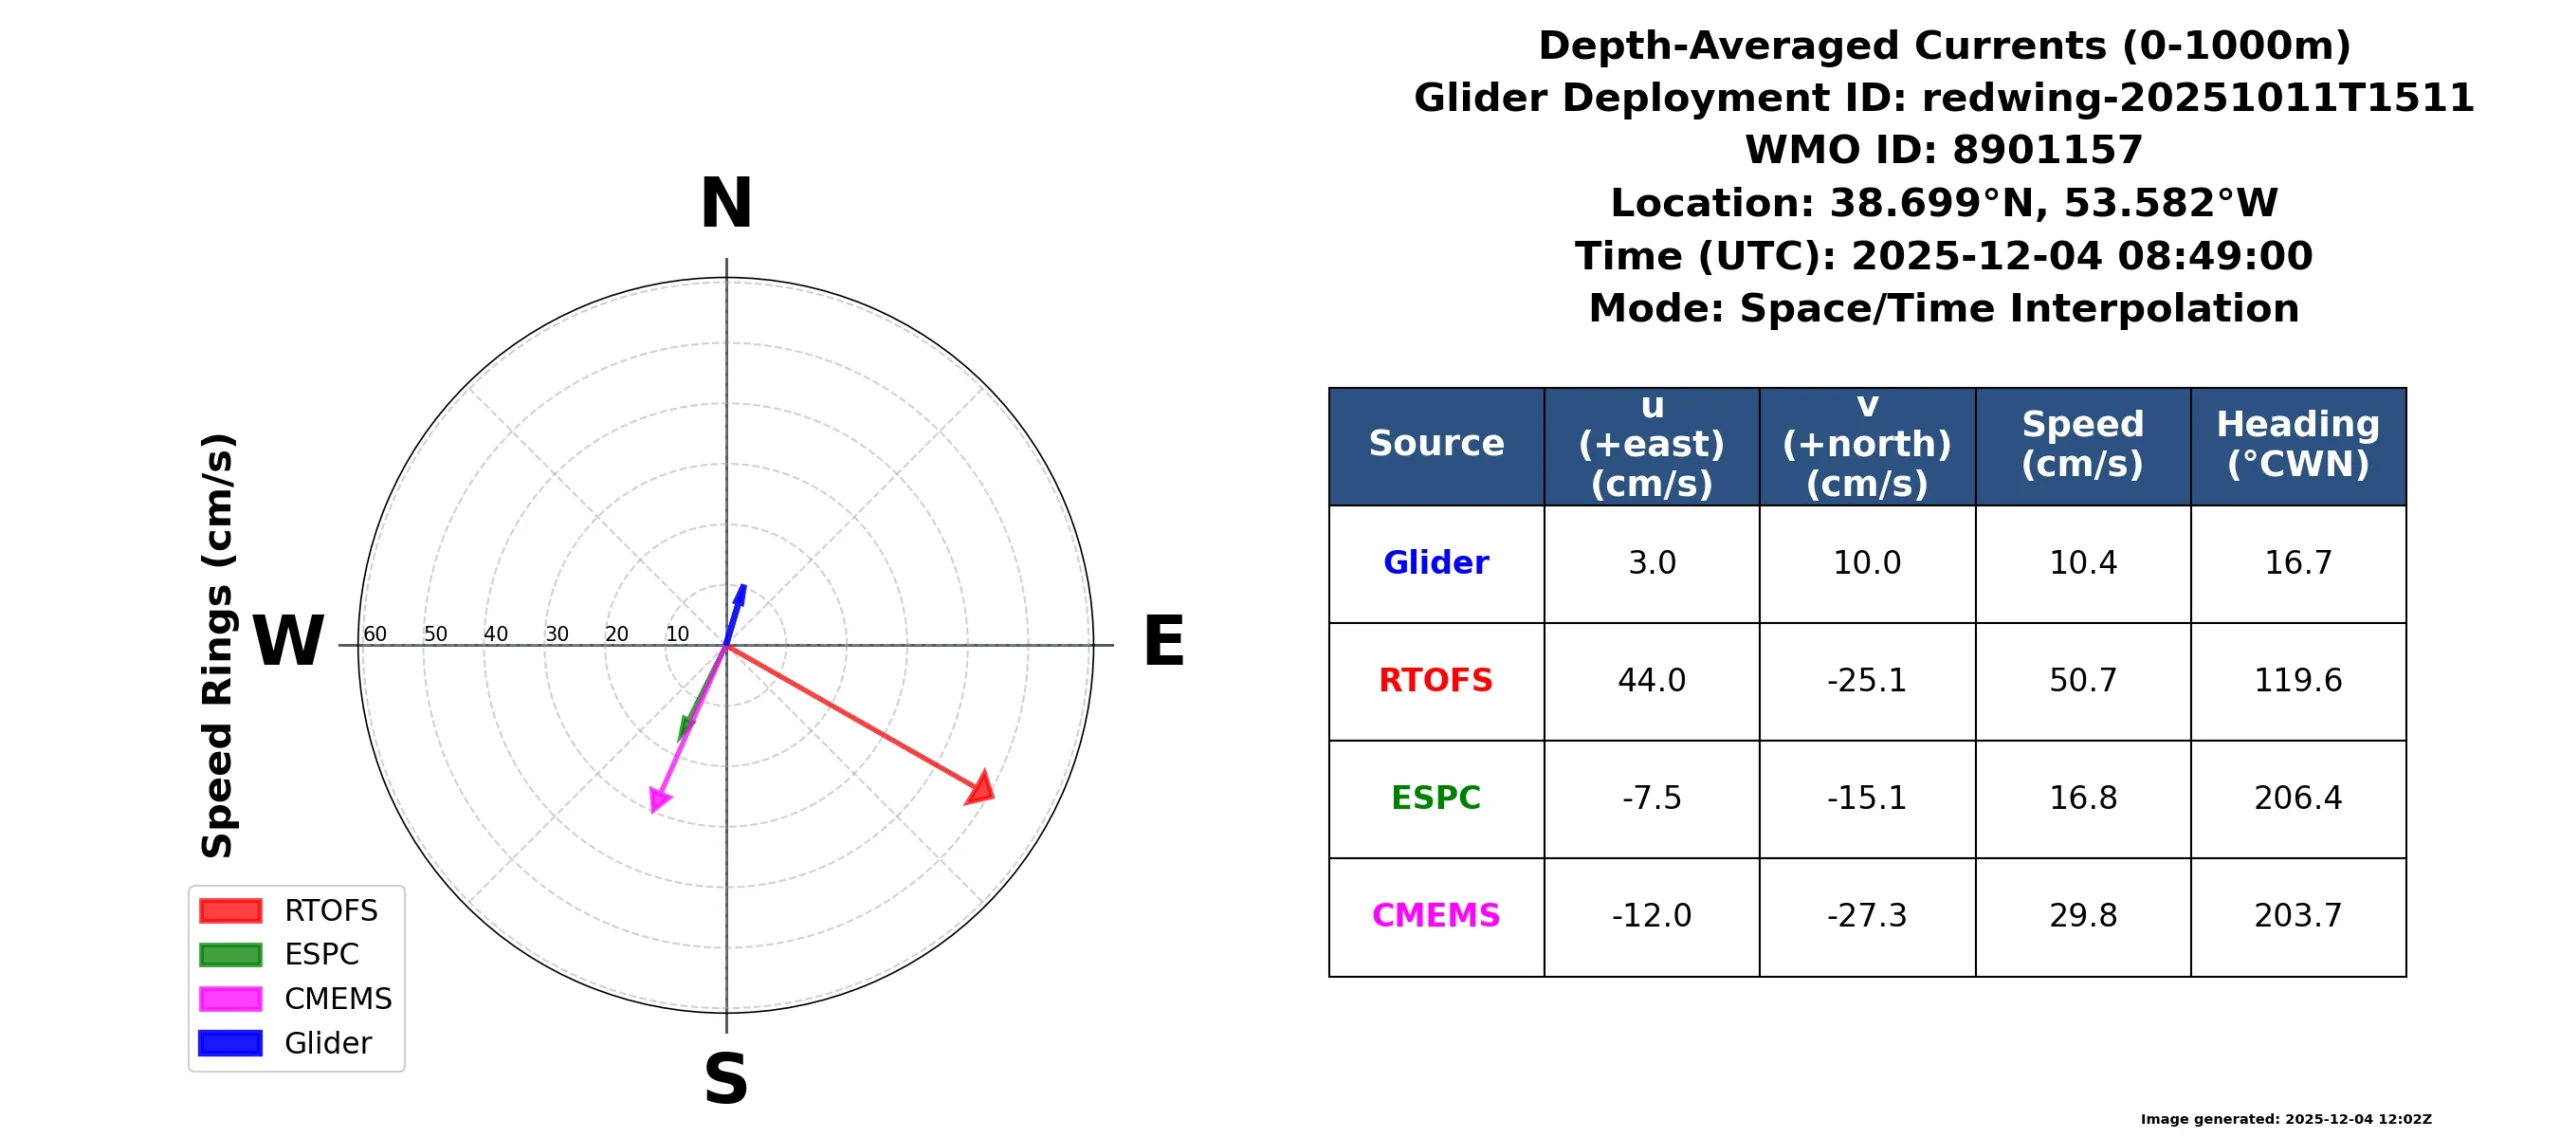
Good Monday morning Glider Pilots:
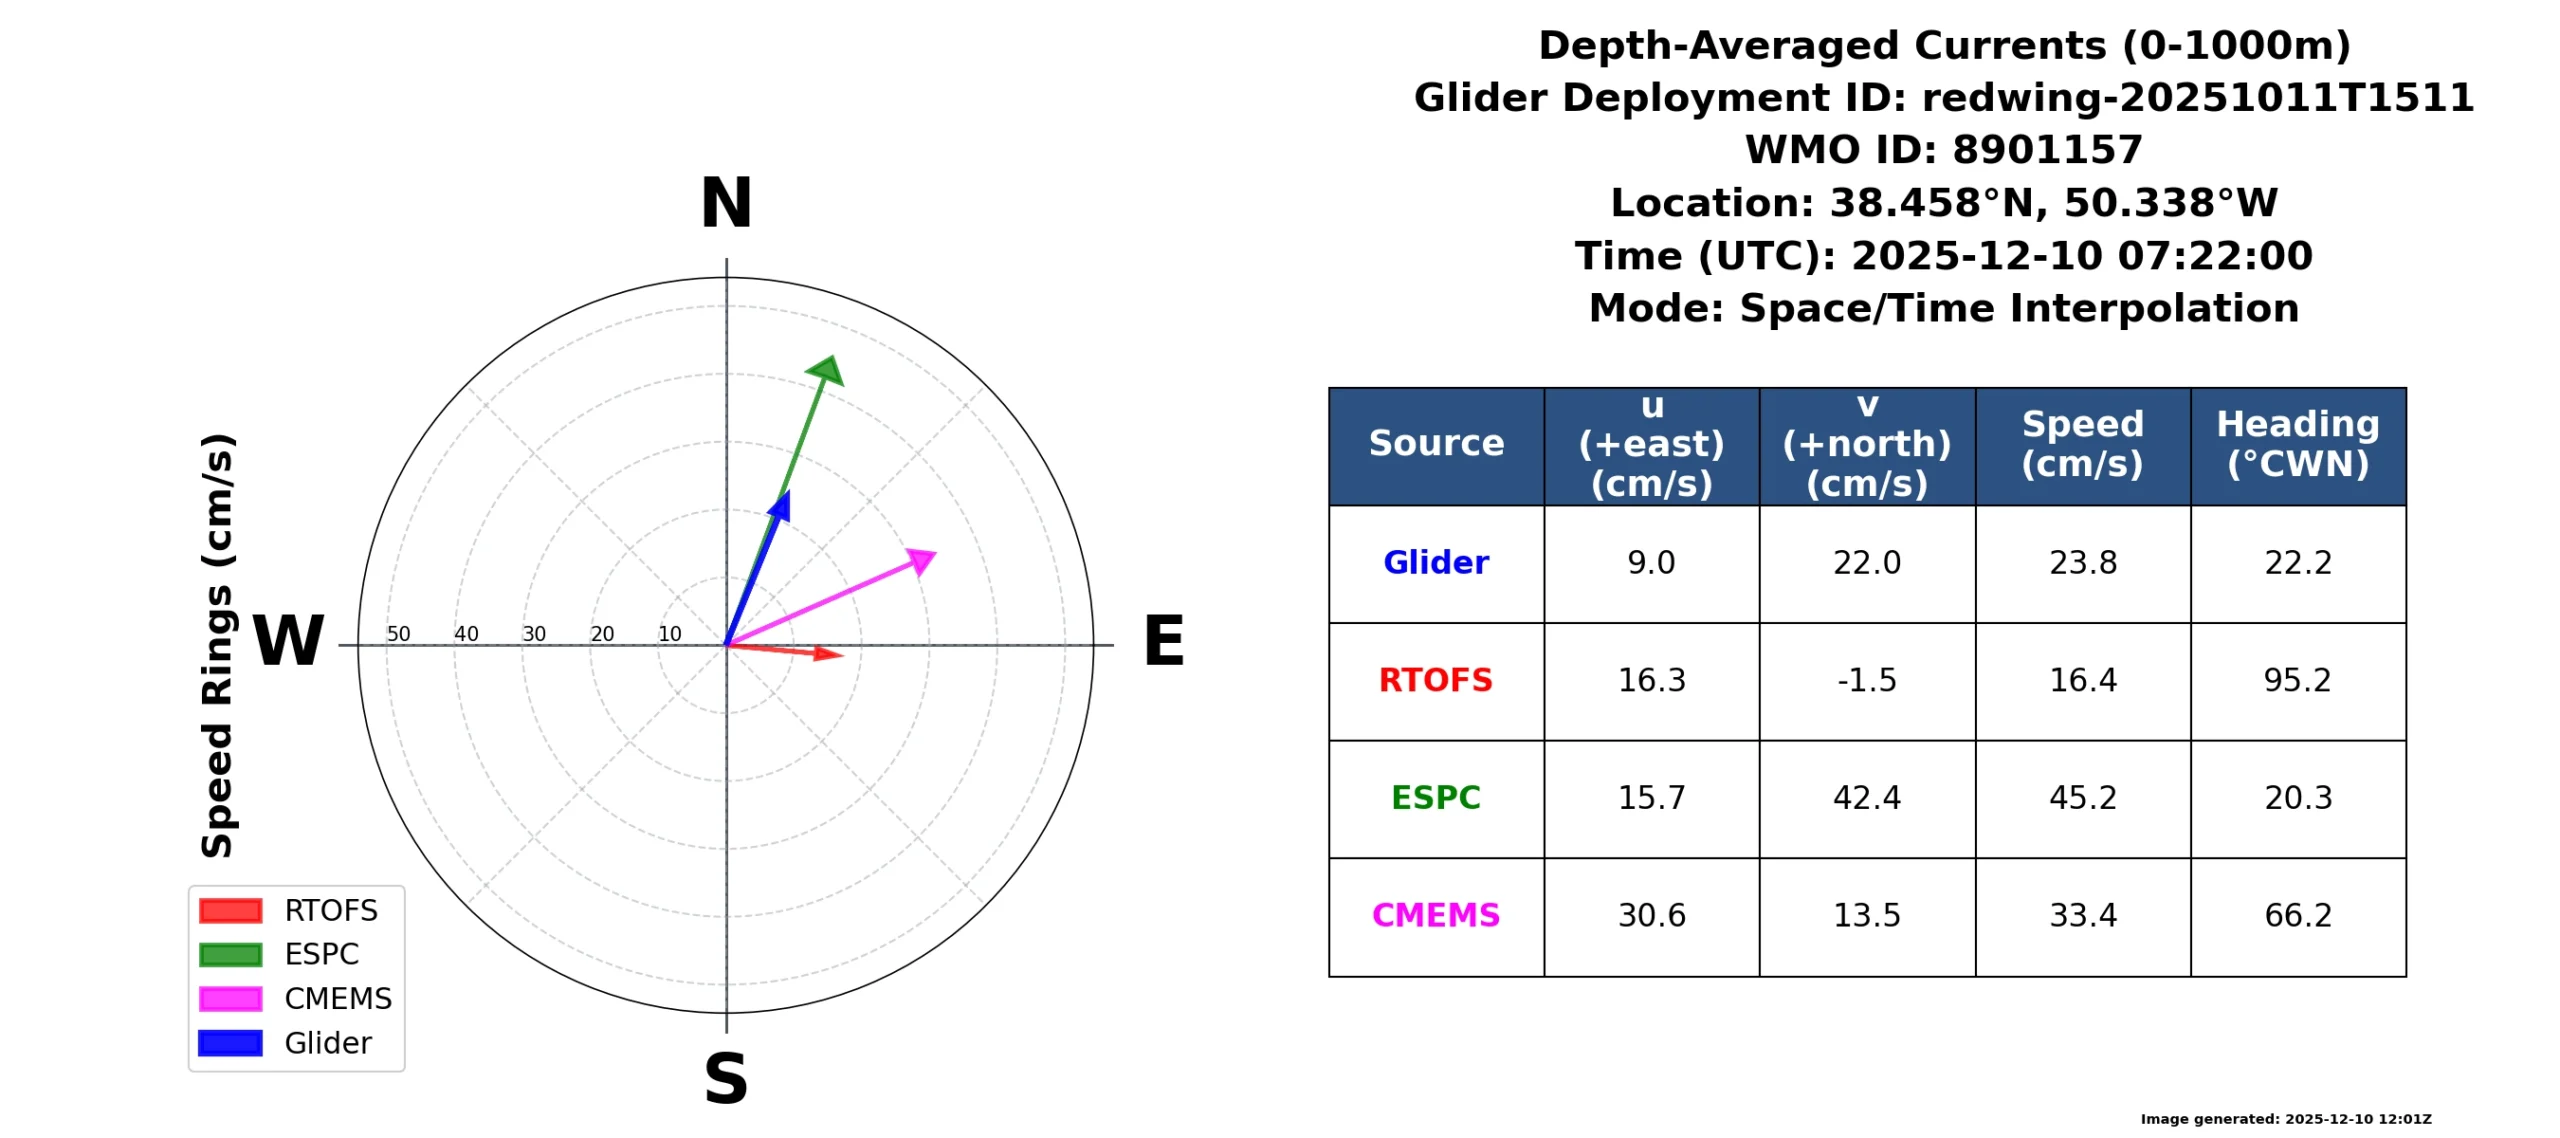
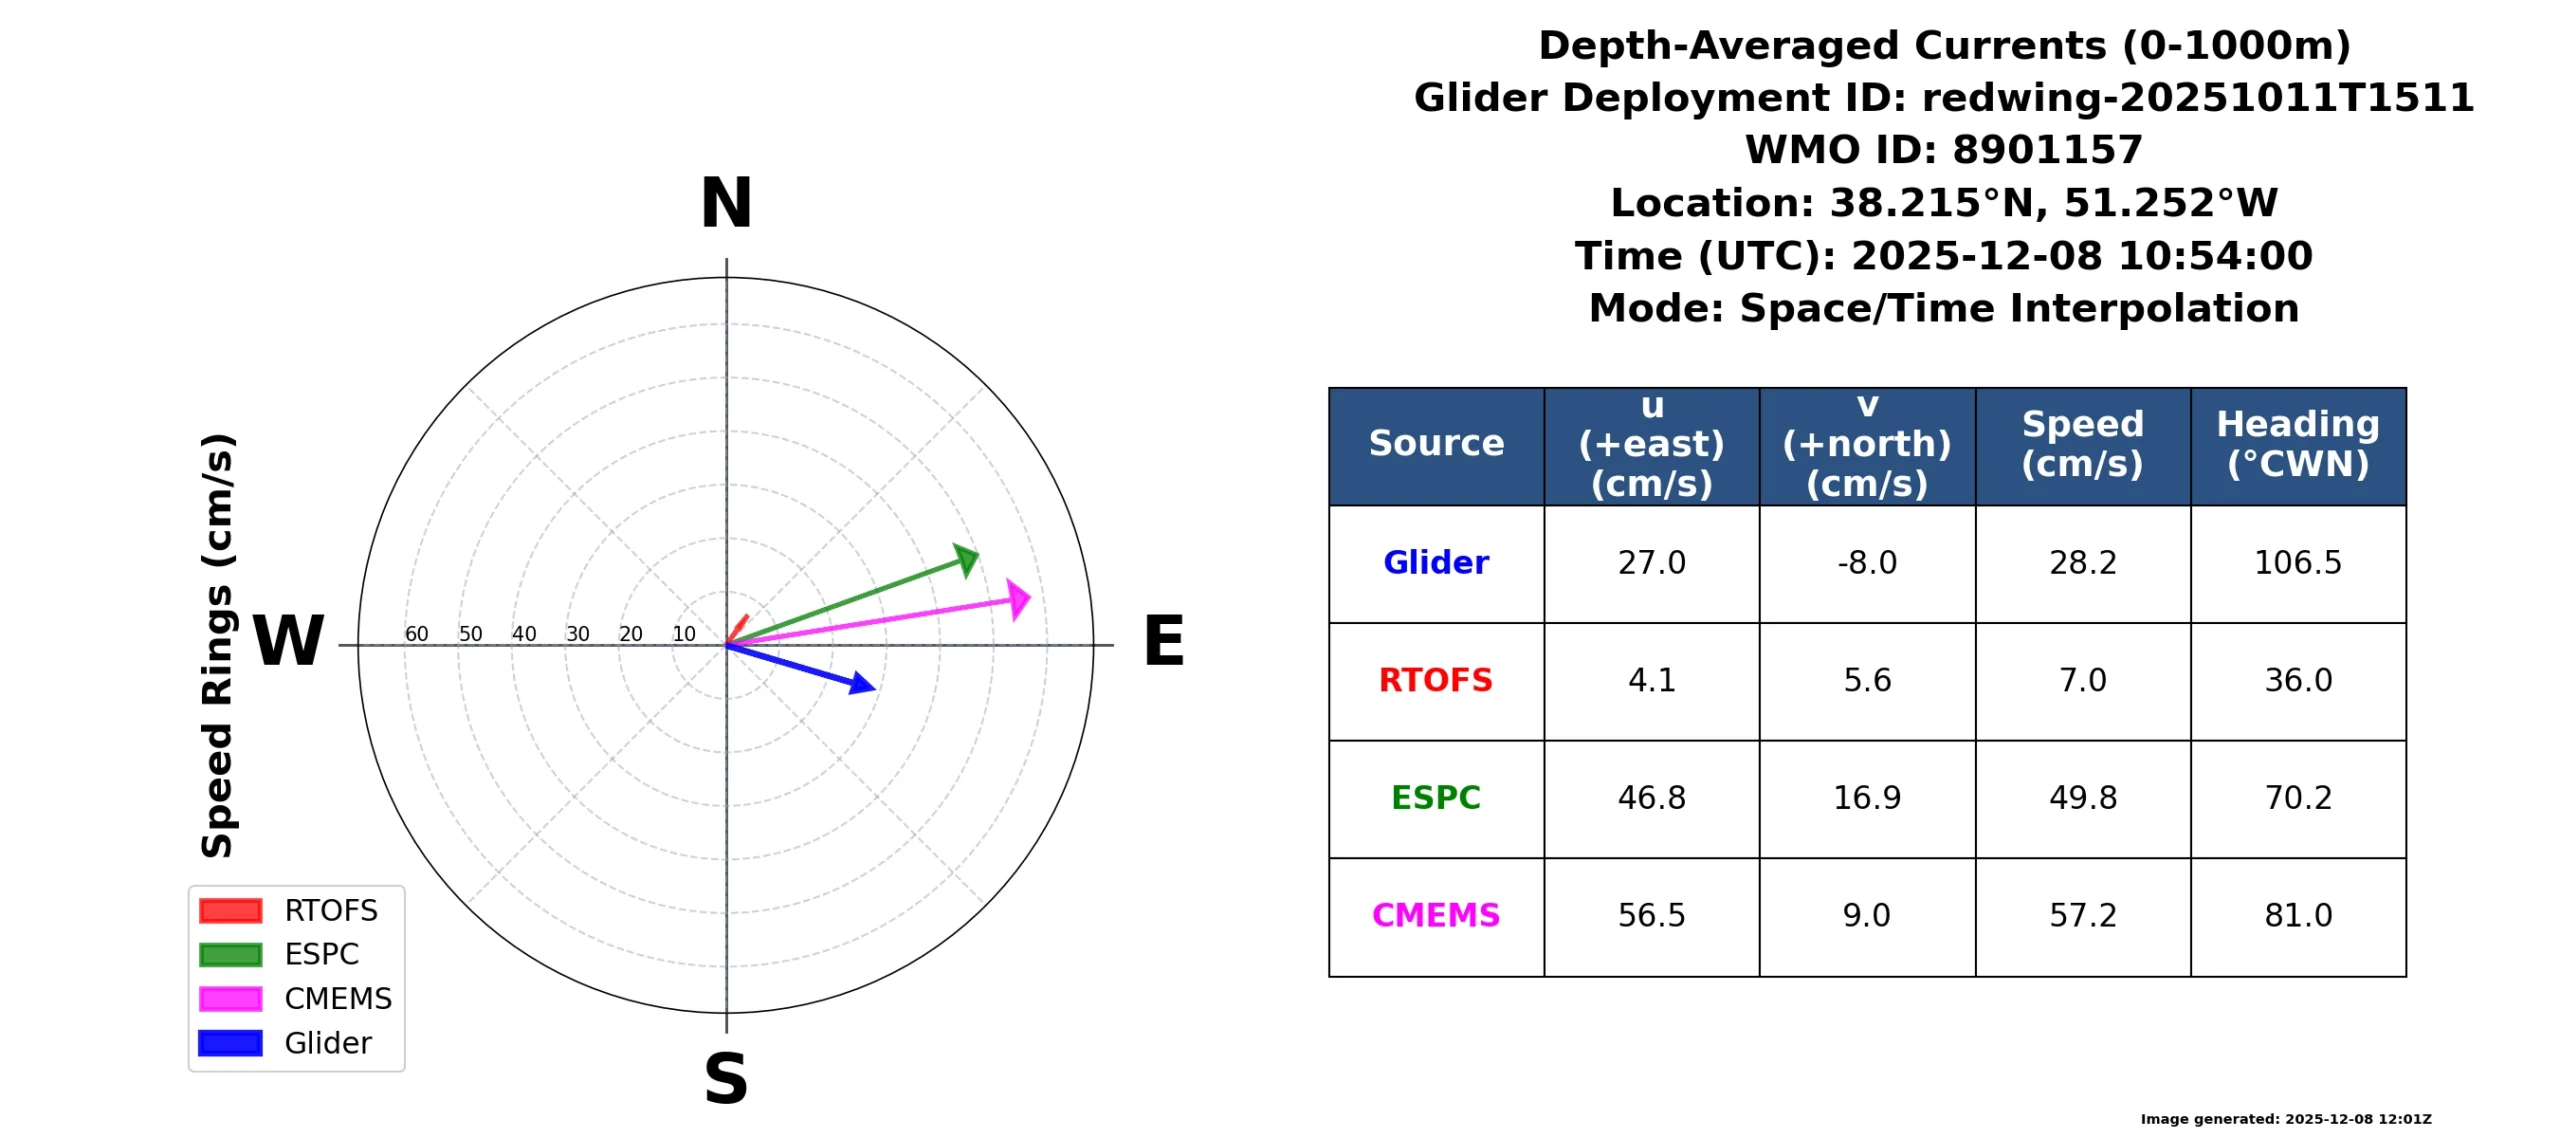
Redwing is reporting strong currents almost exactly to the northeast. 58 cm/sec to east (vx). 56 cm/sec to north (vy).
From Redwing’s latest surface dialogue with shore:
sensor:m_water_vx(m/s)=0.580155698252686 145.273 secs ago
sensor:m_water_vy(m/s)=0.559698631362438 145.277 secs ago
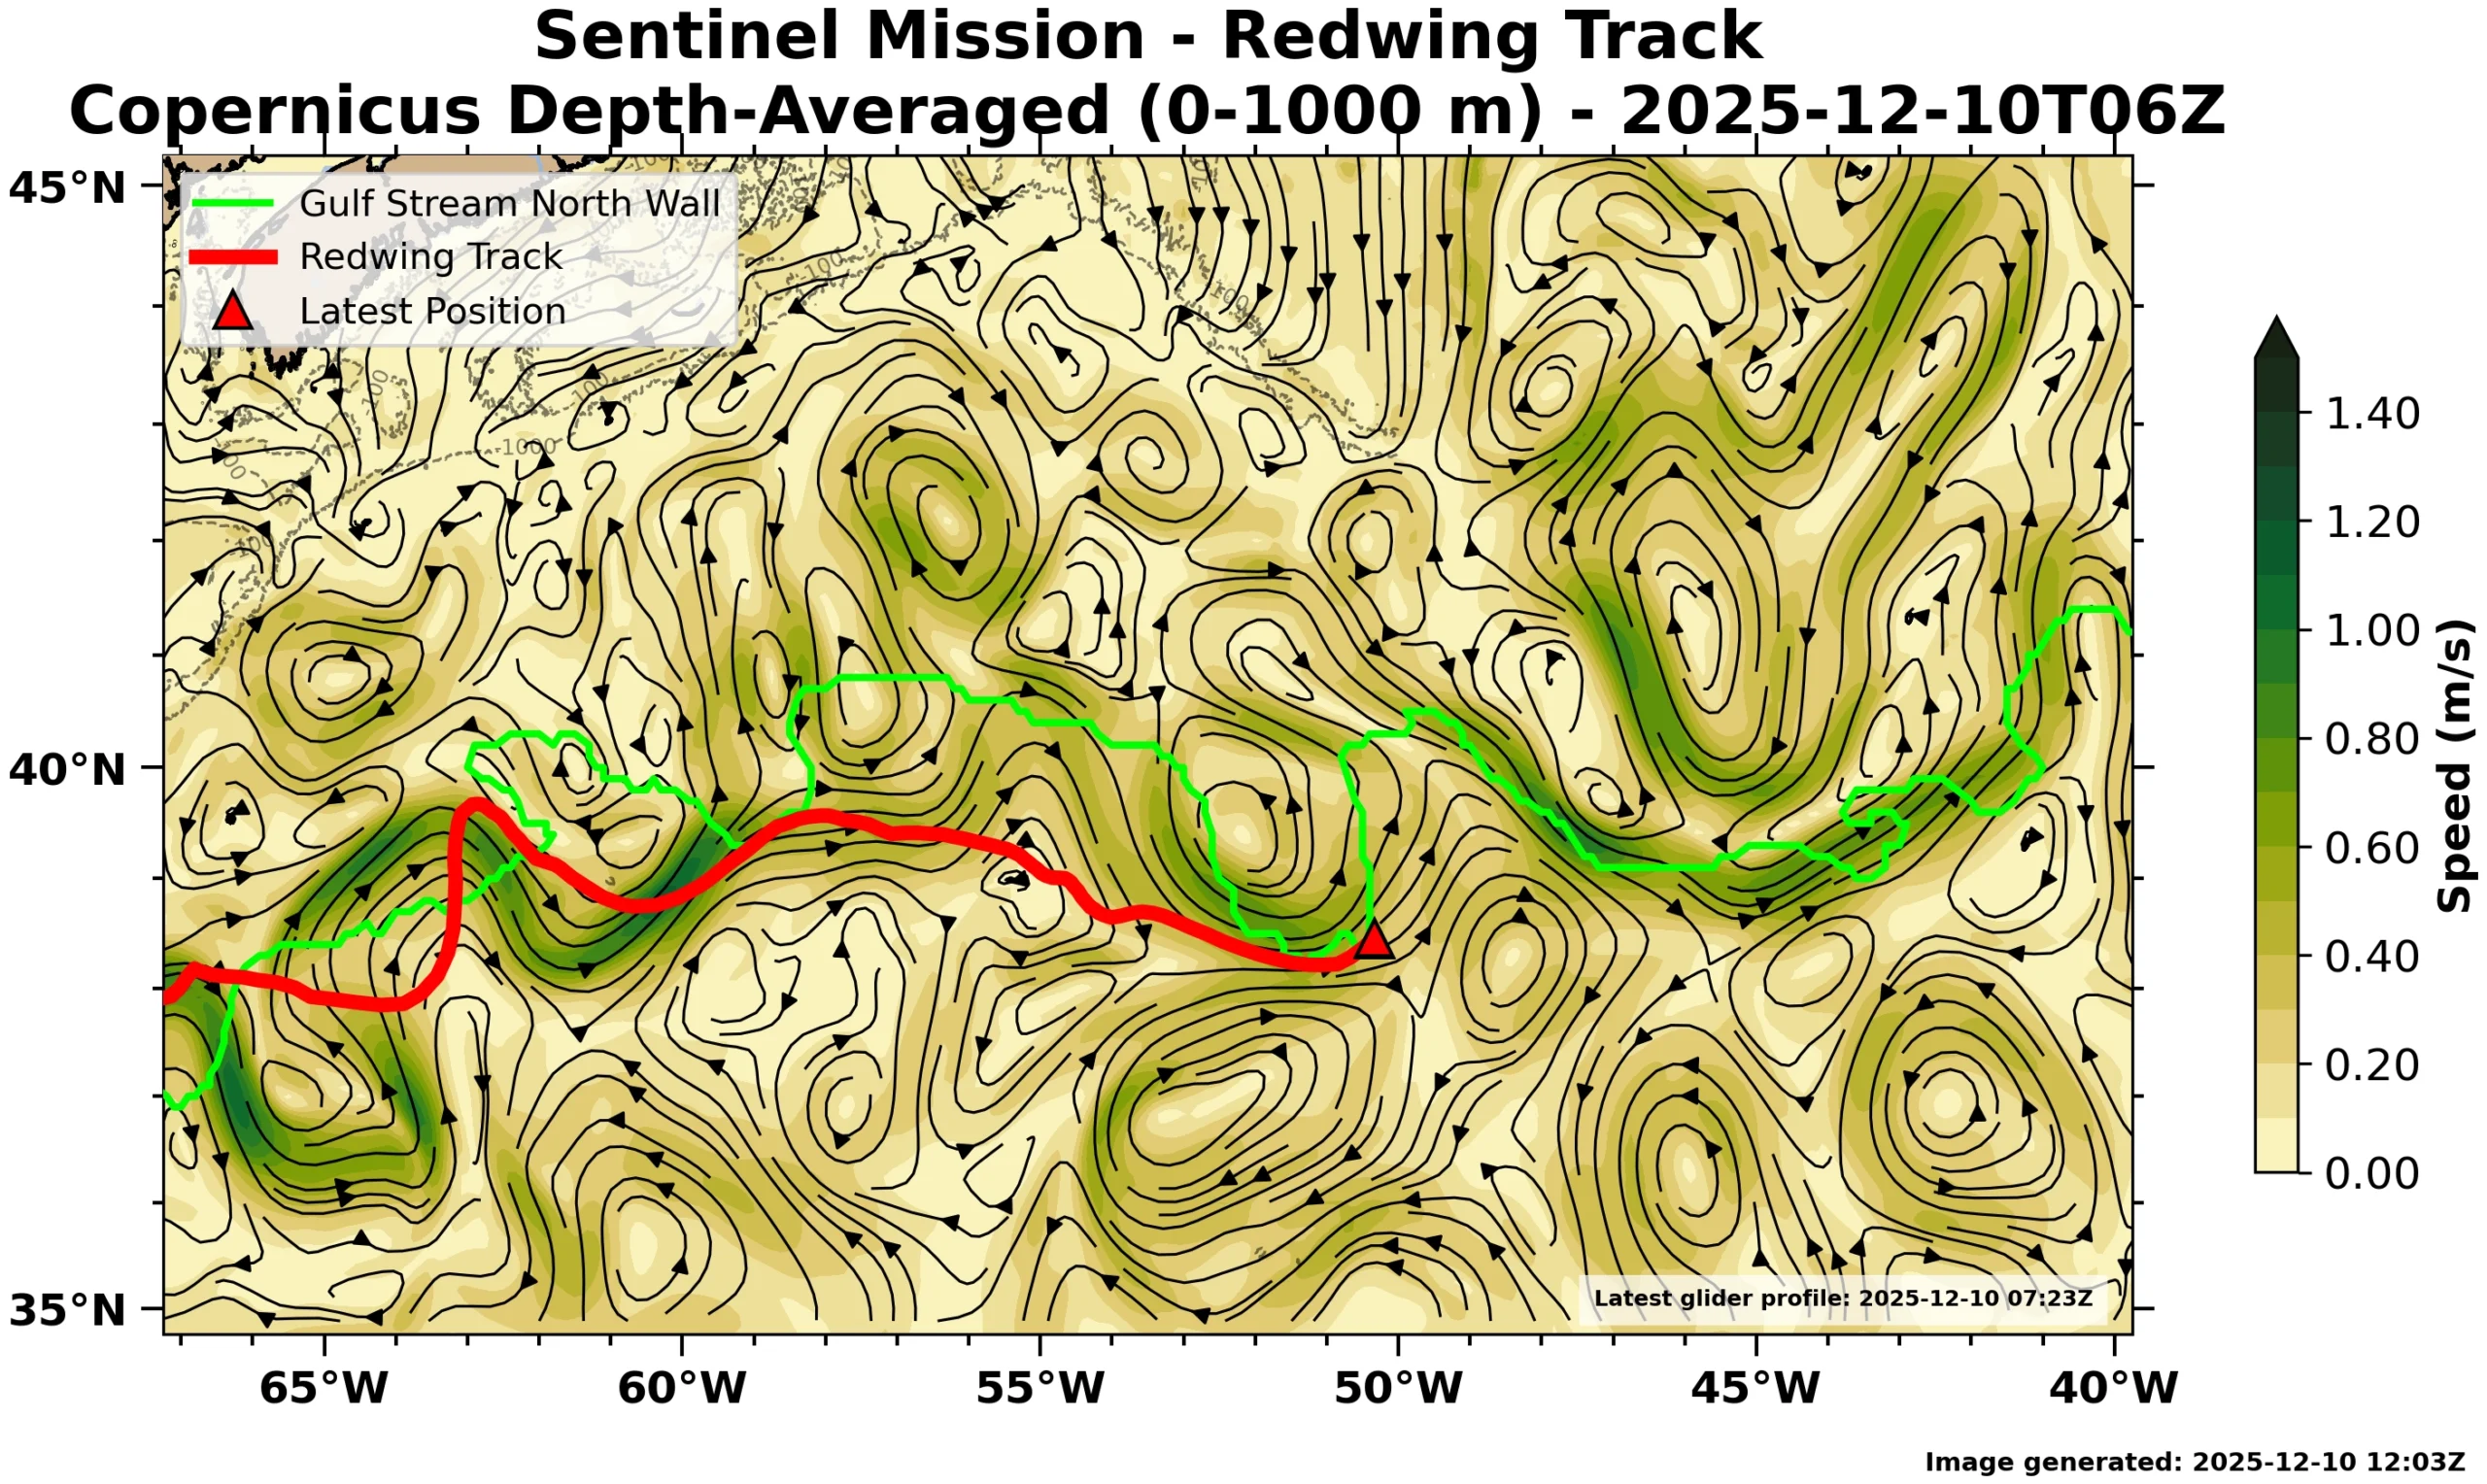
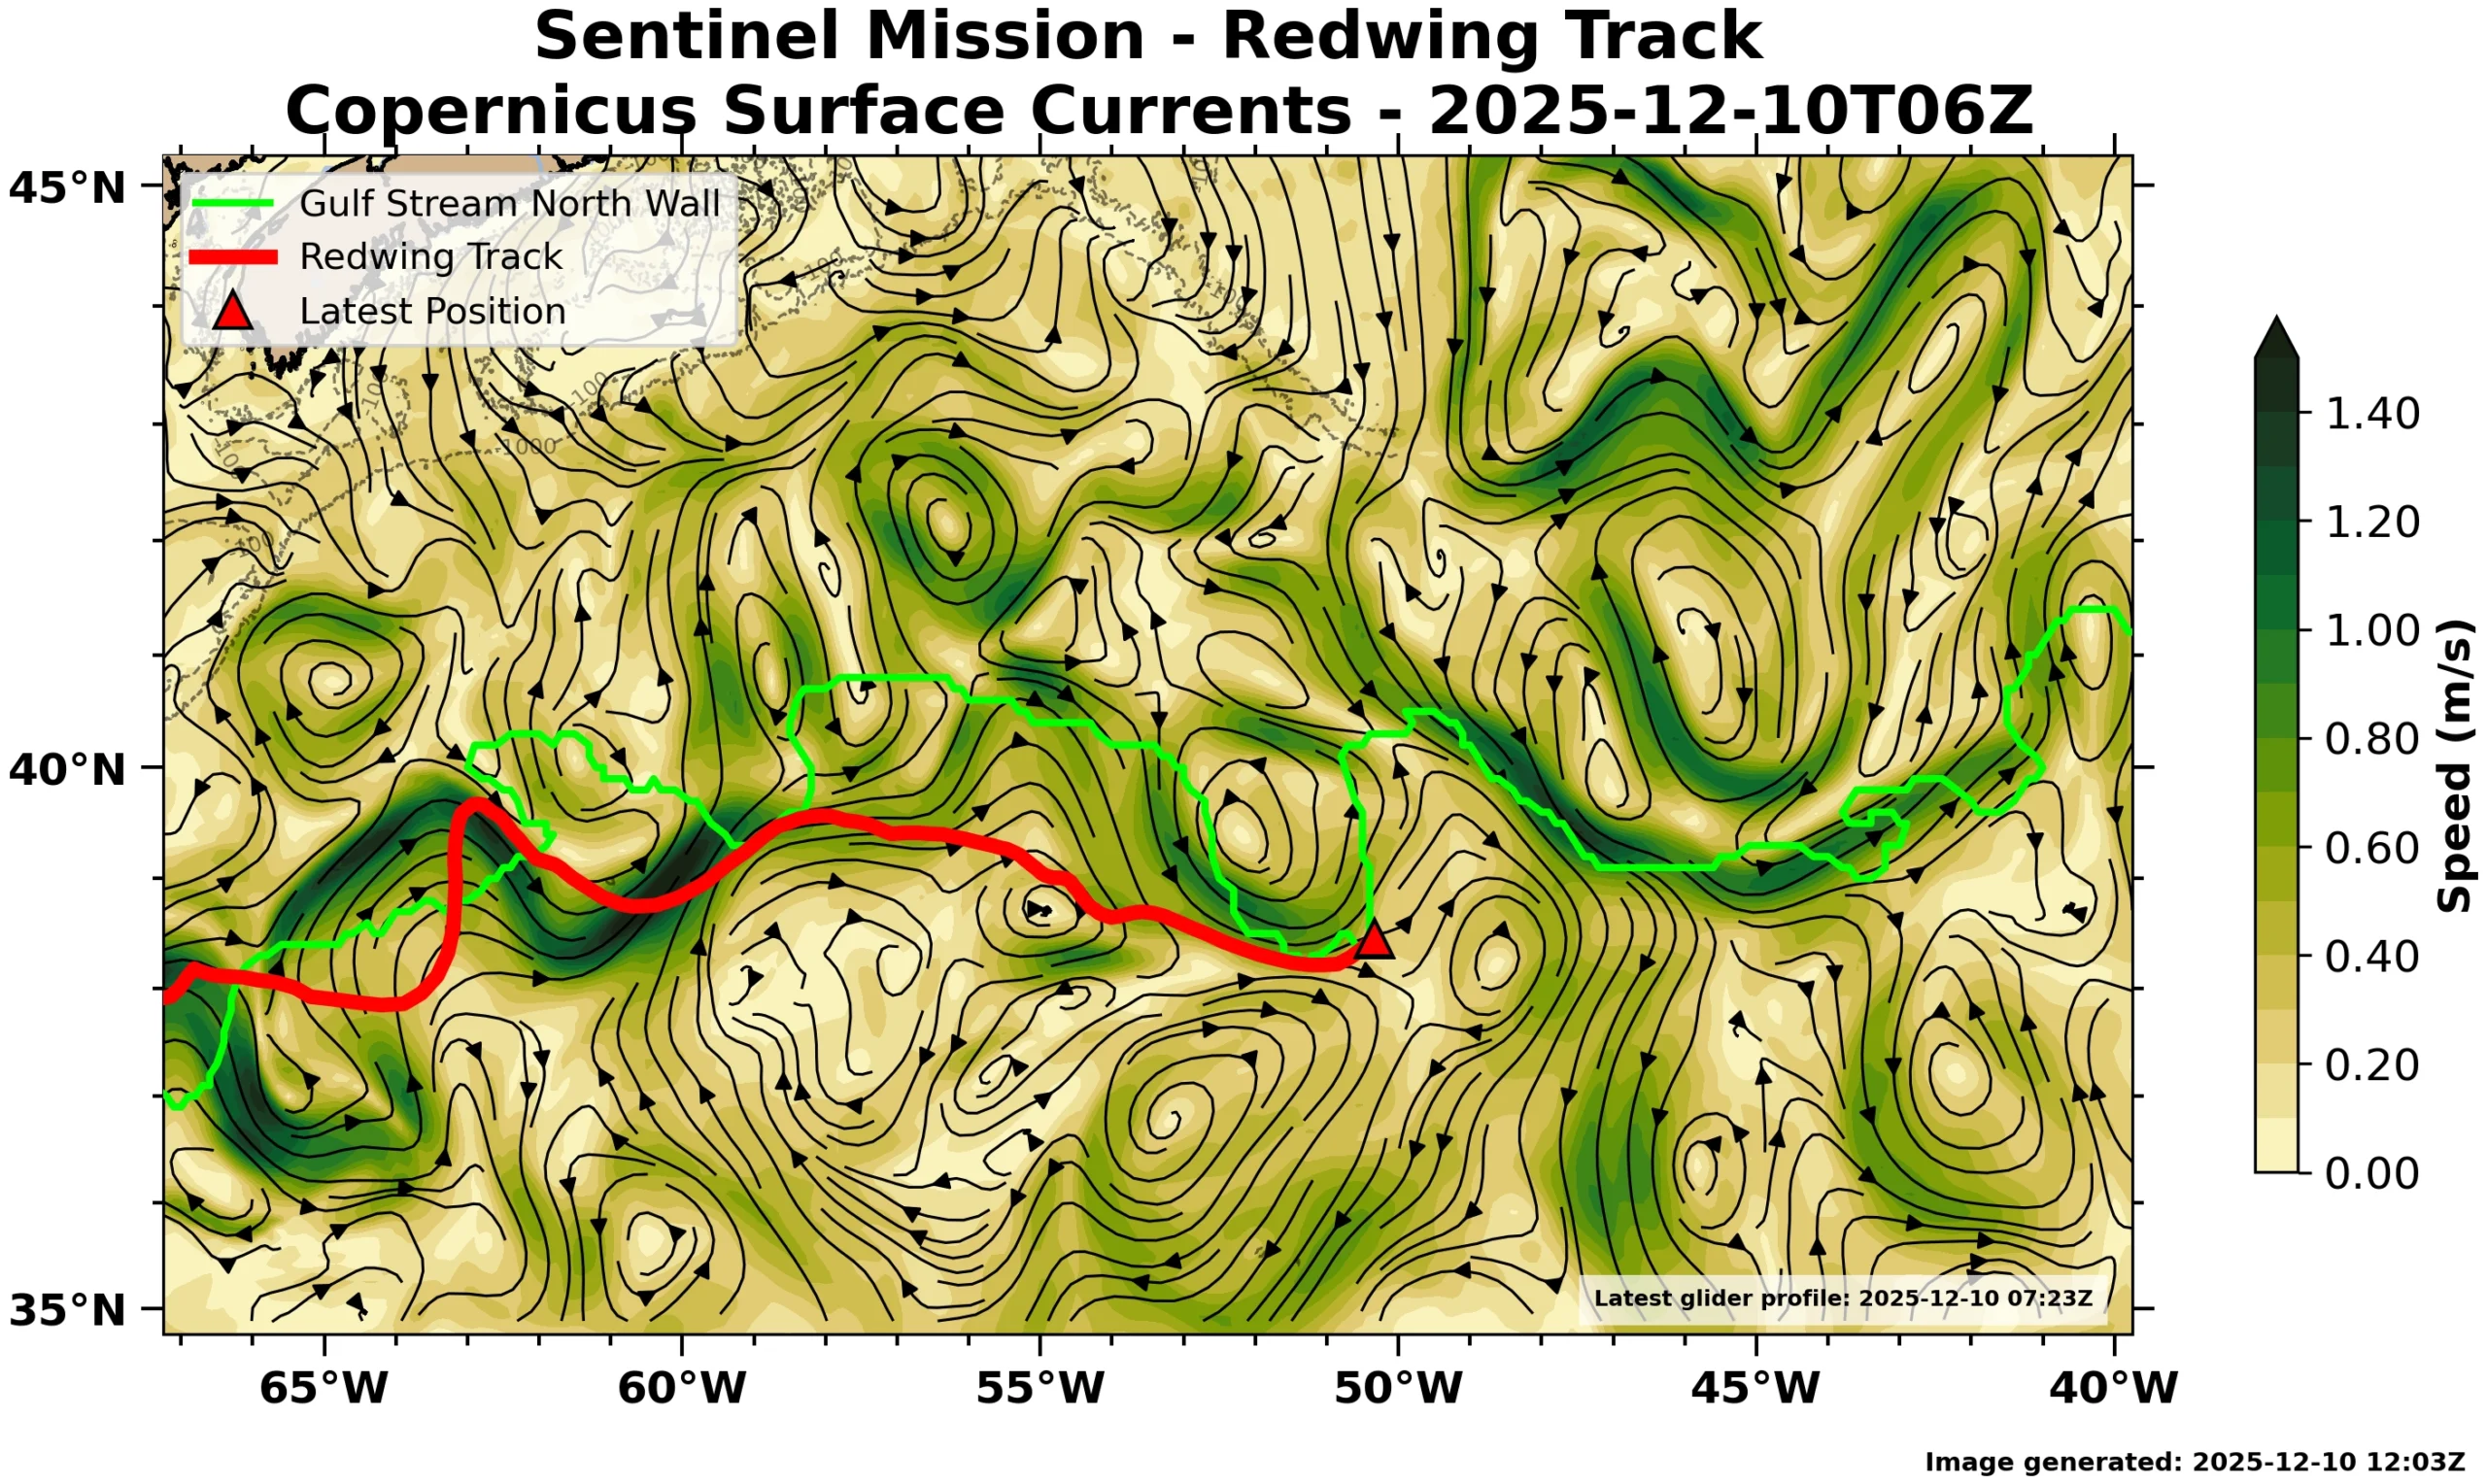
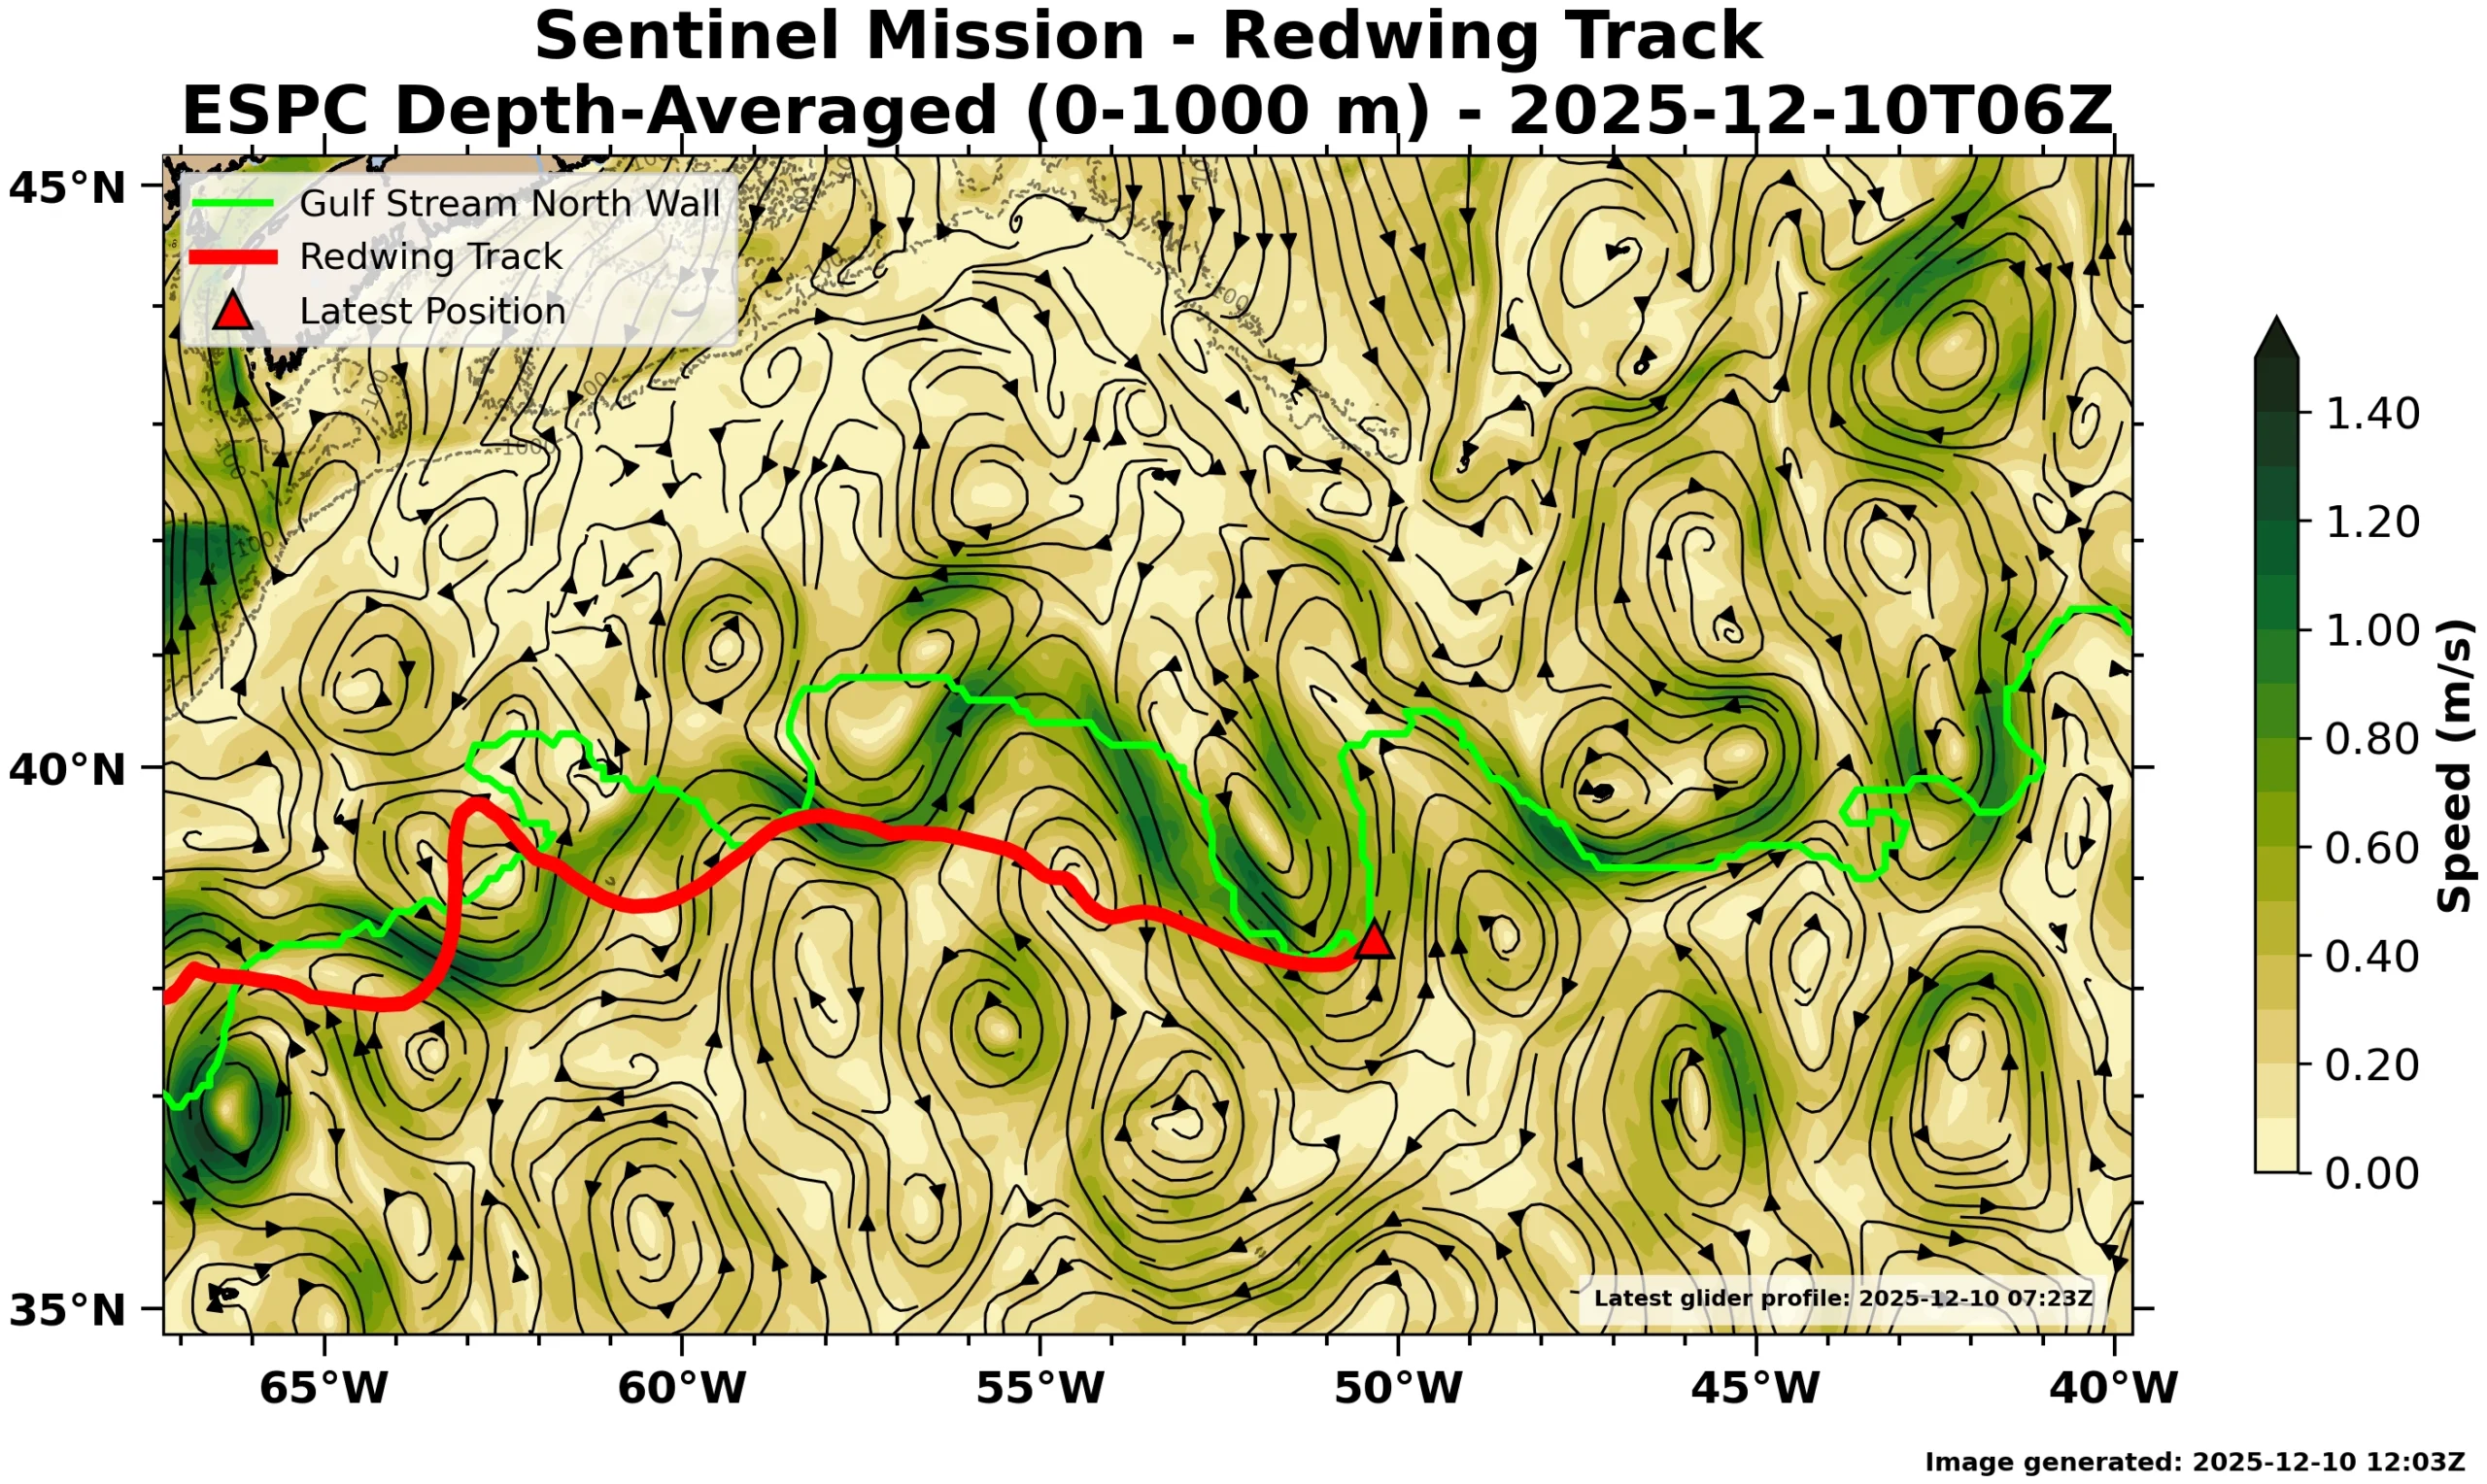
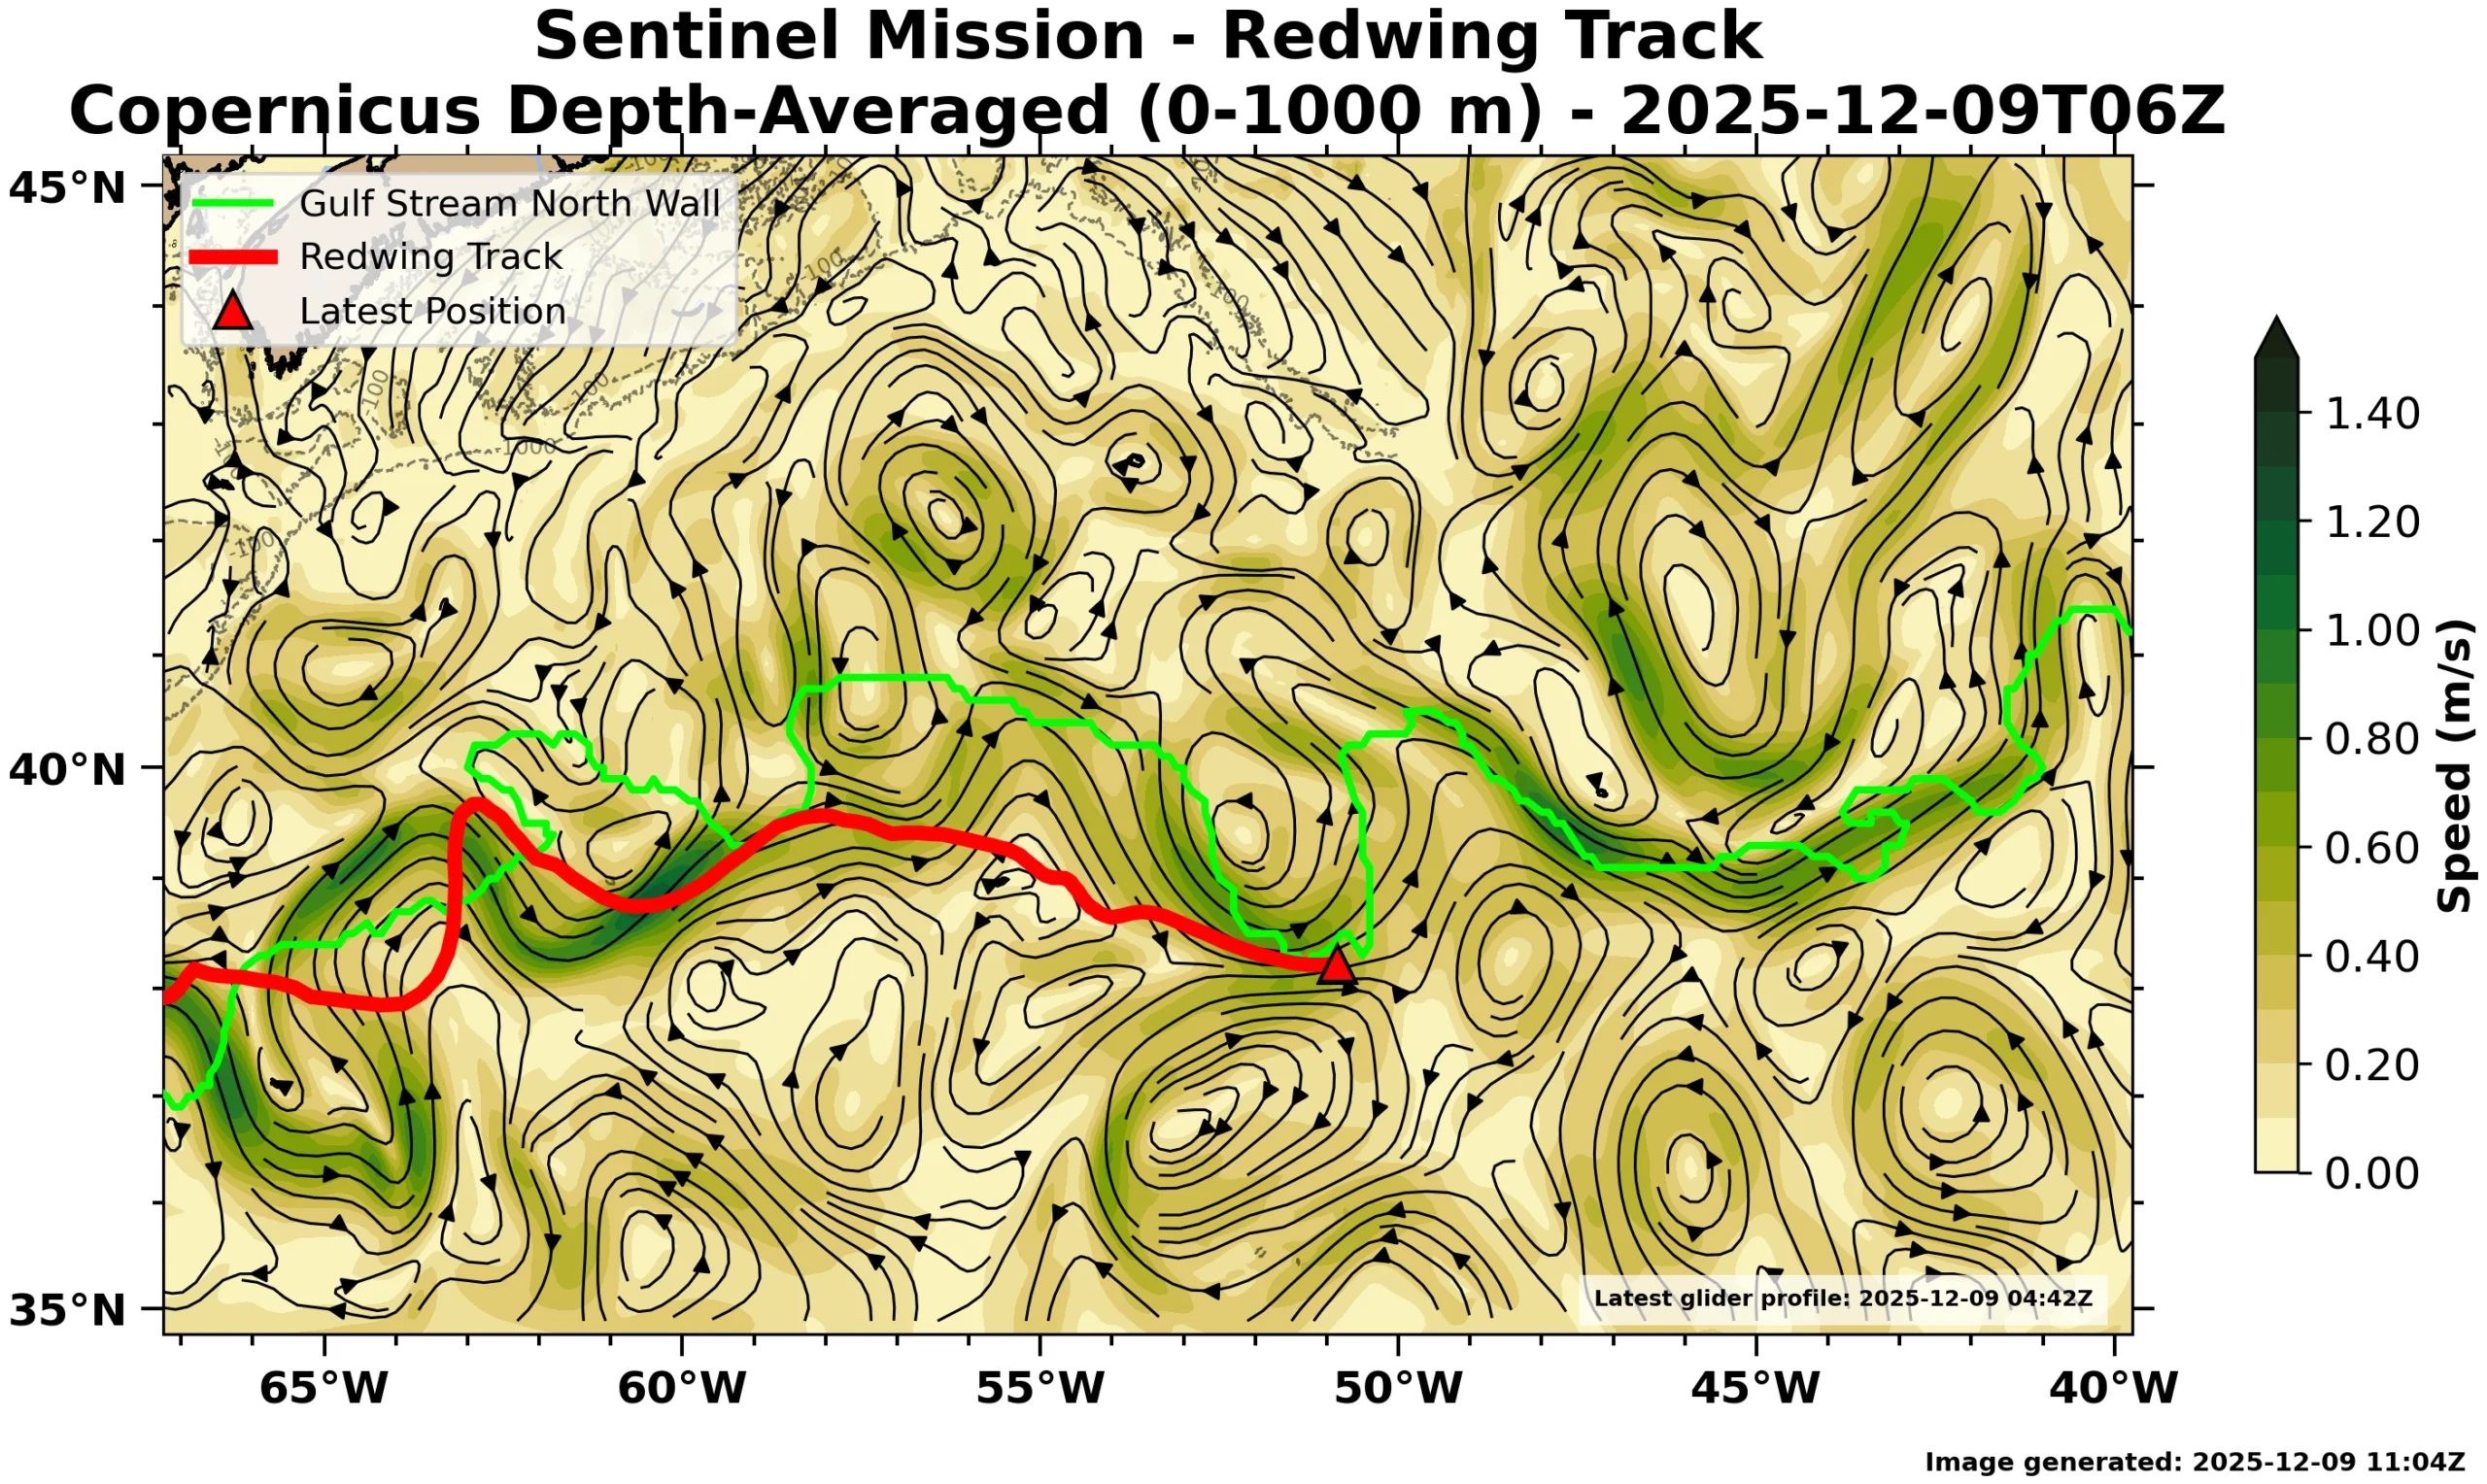
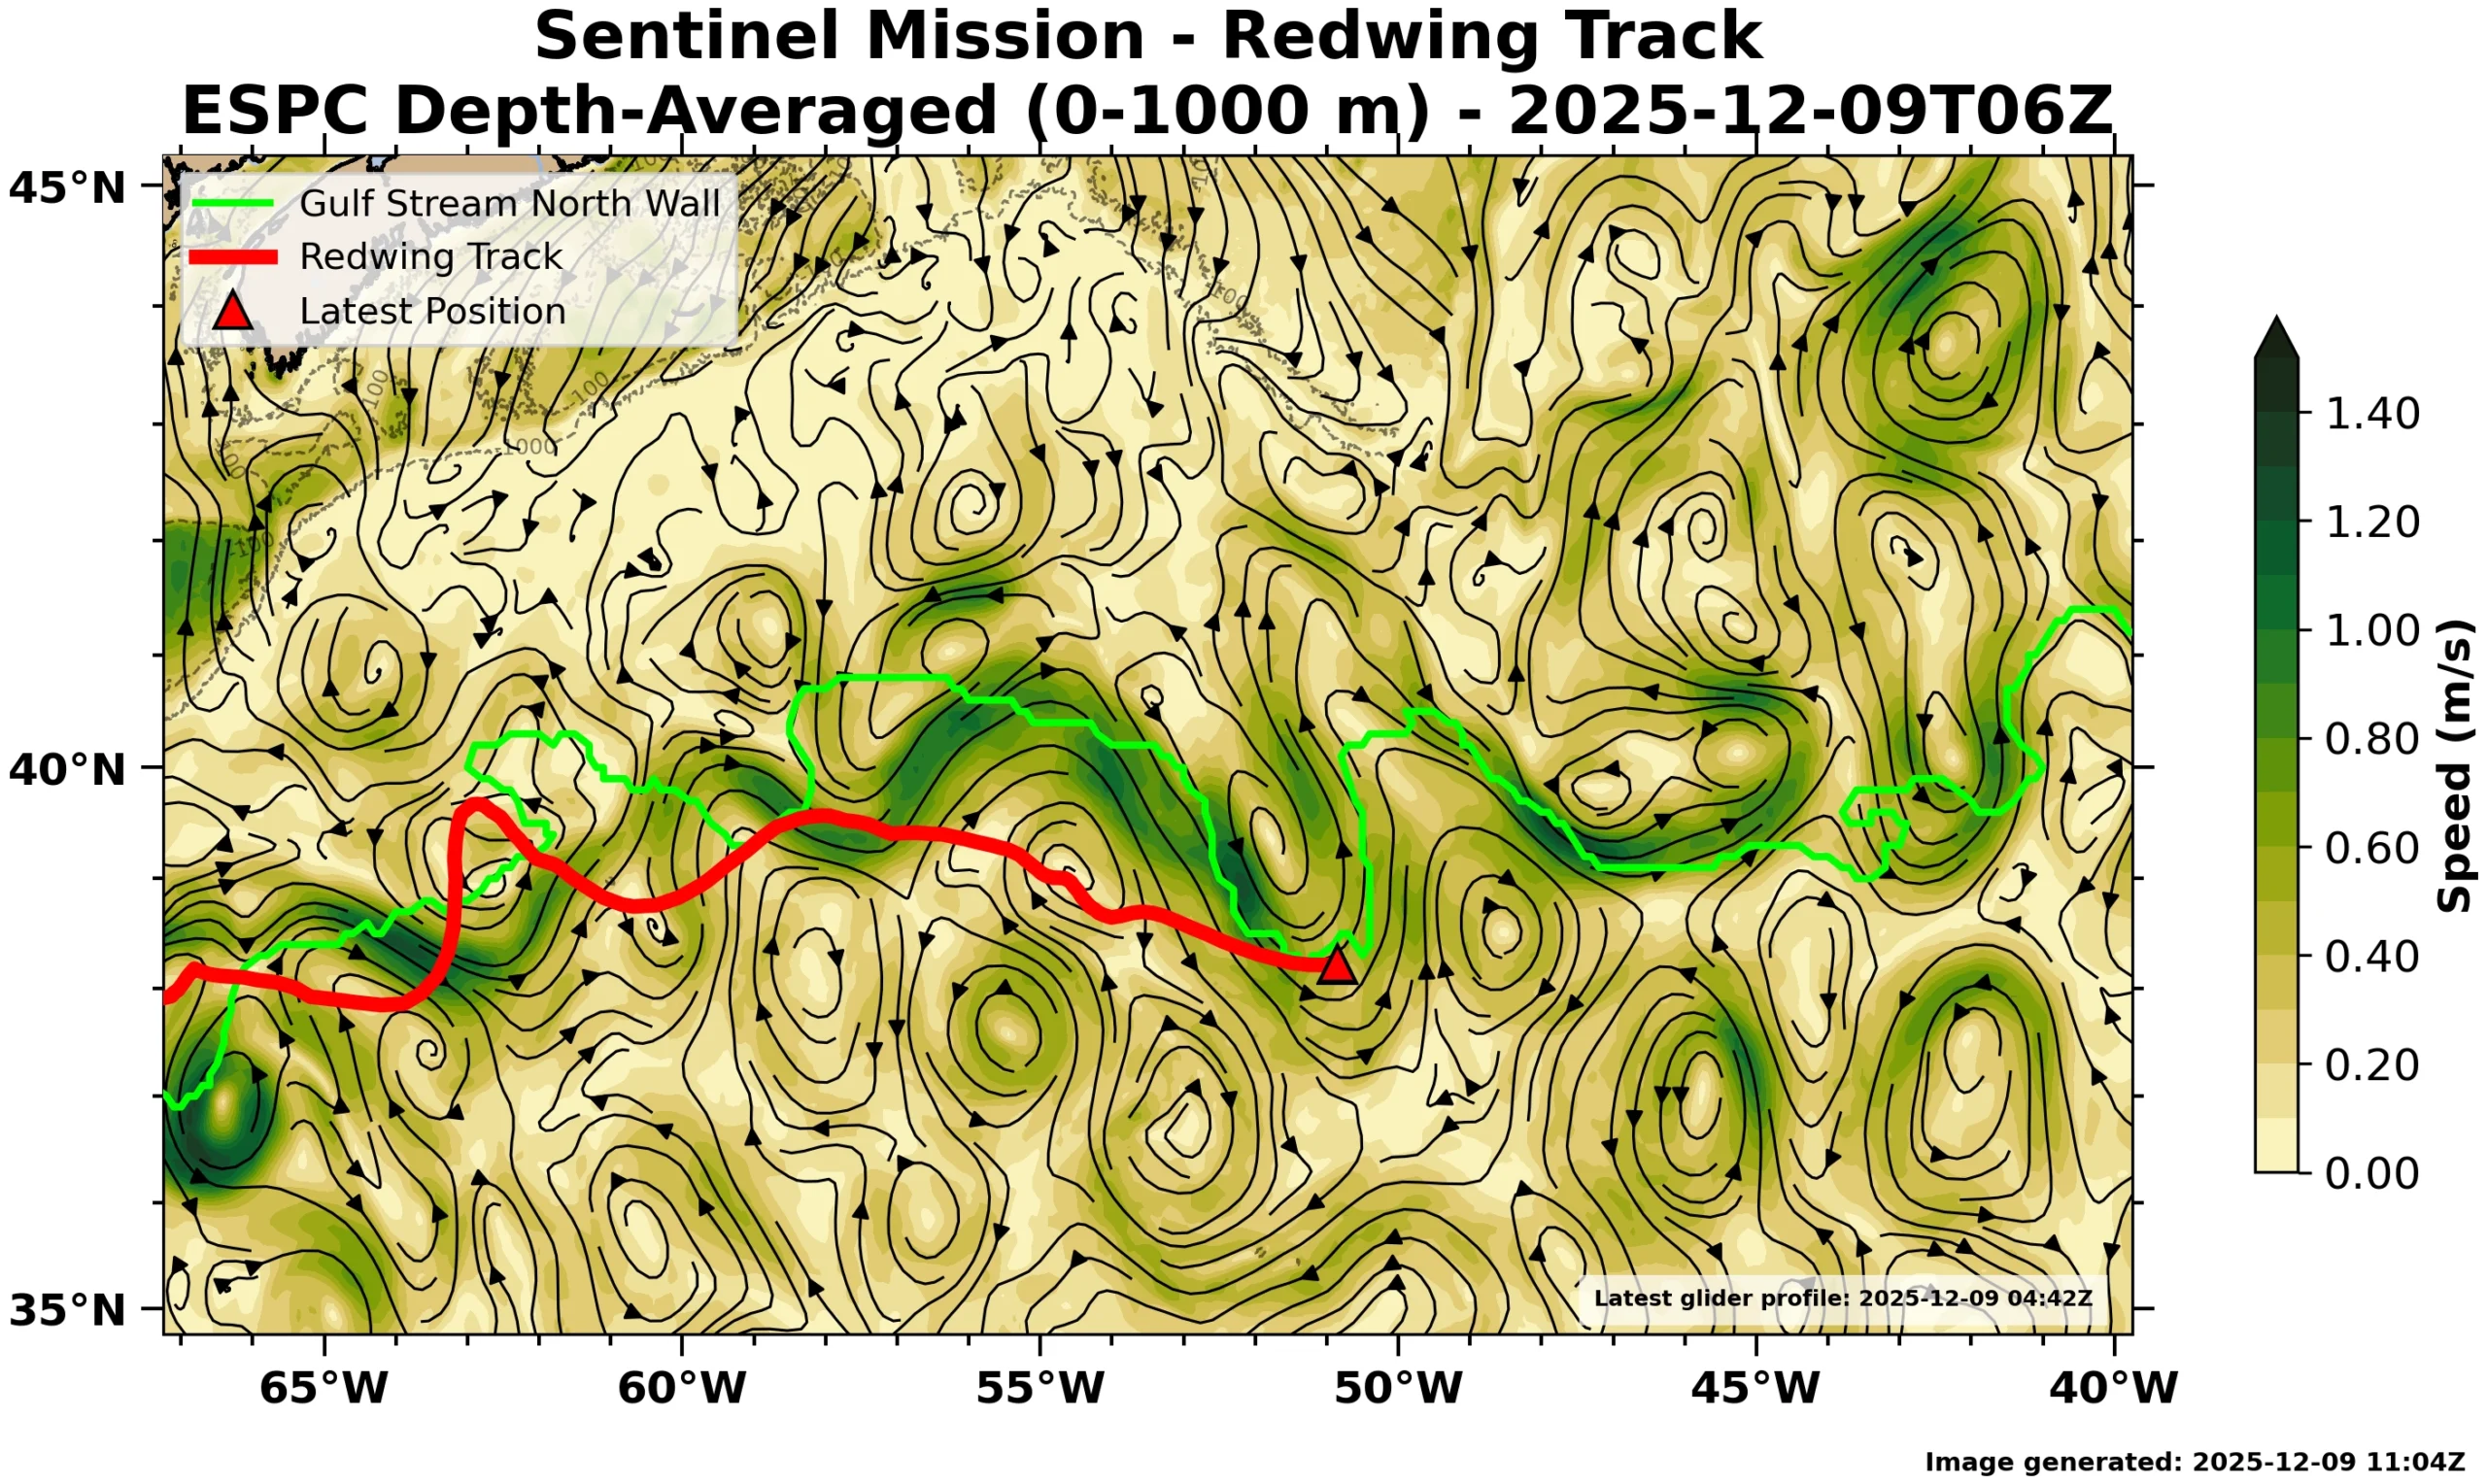
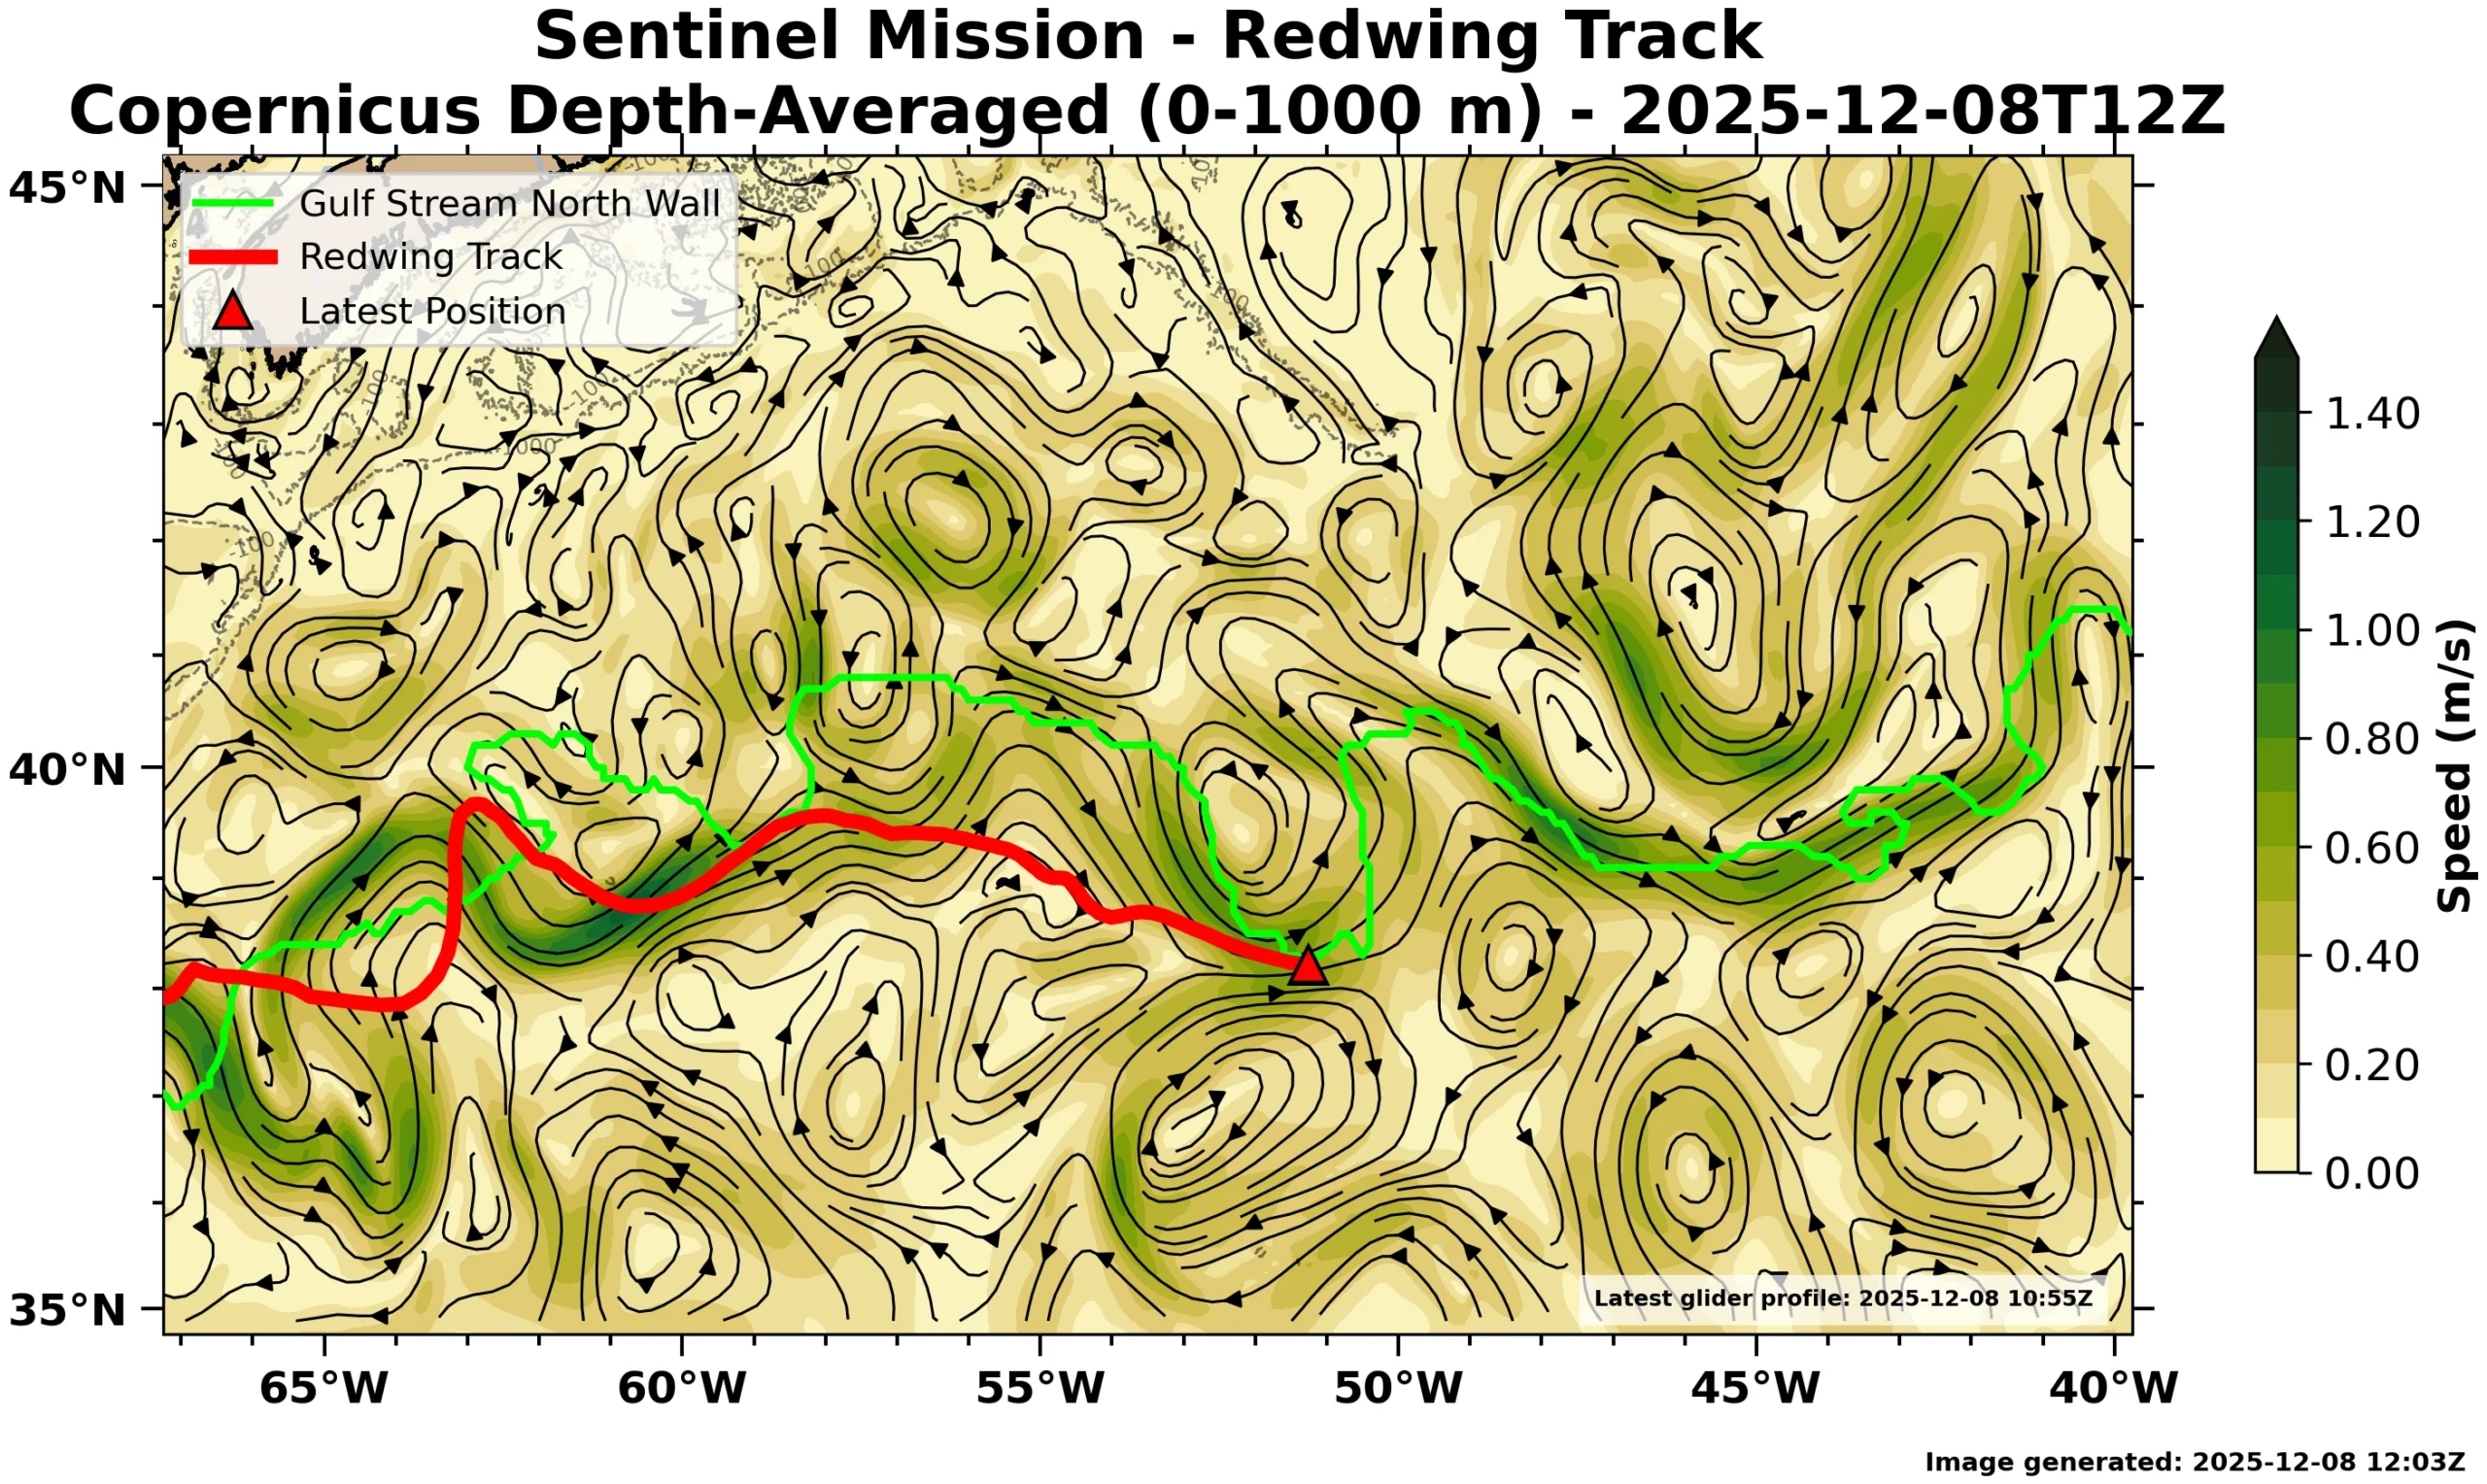
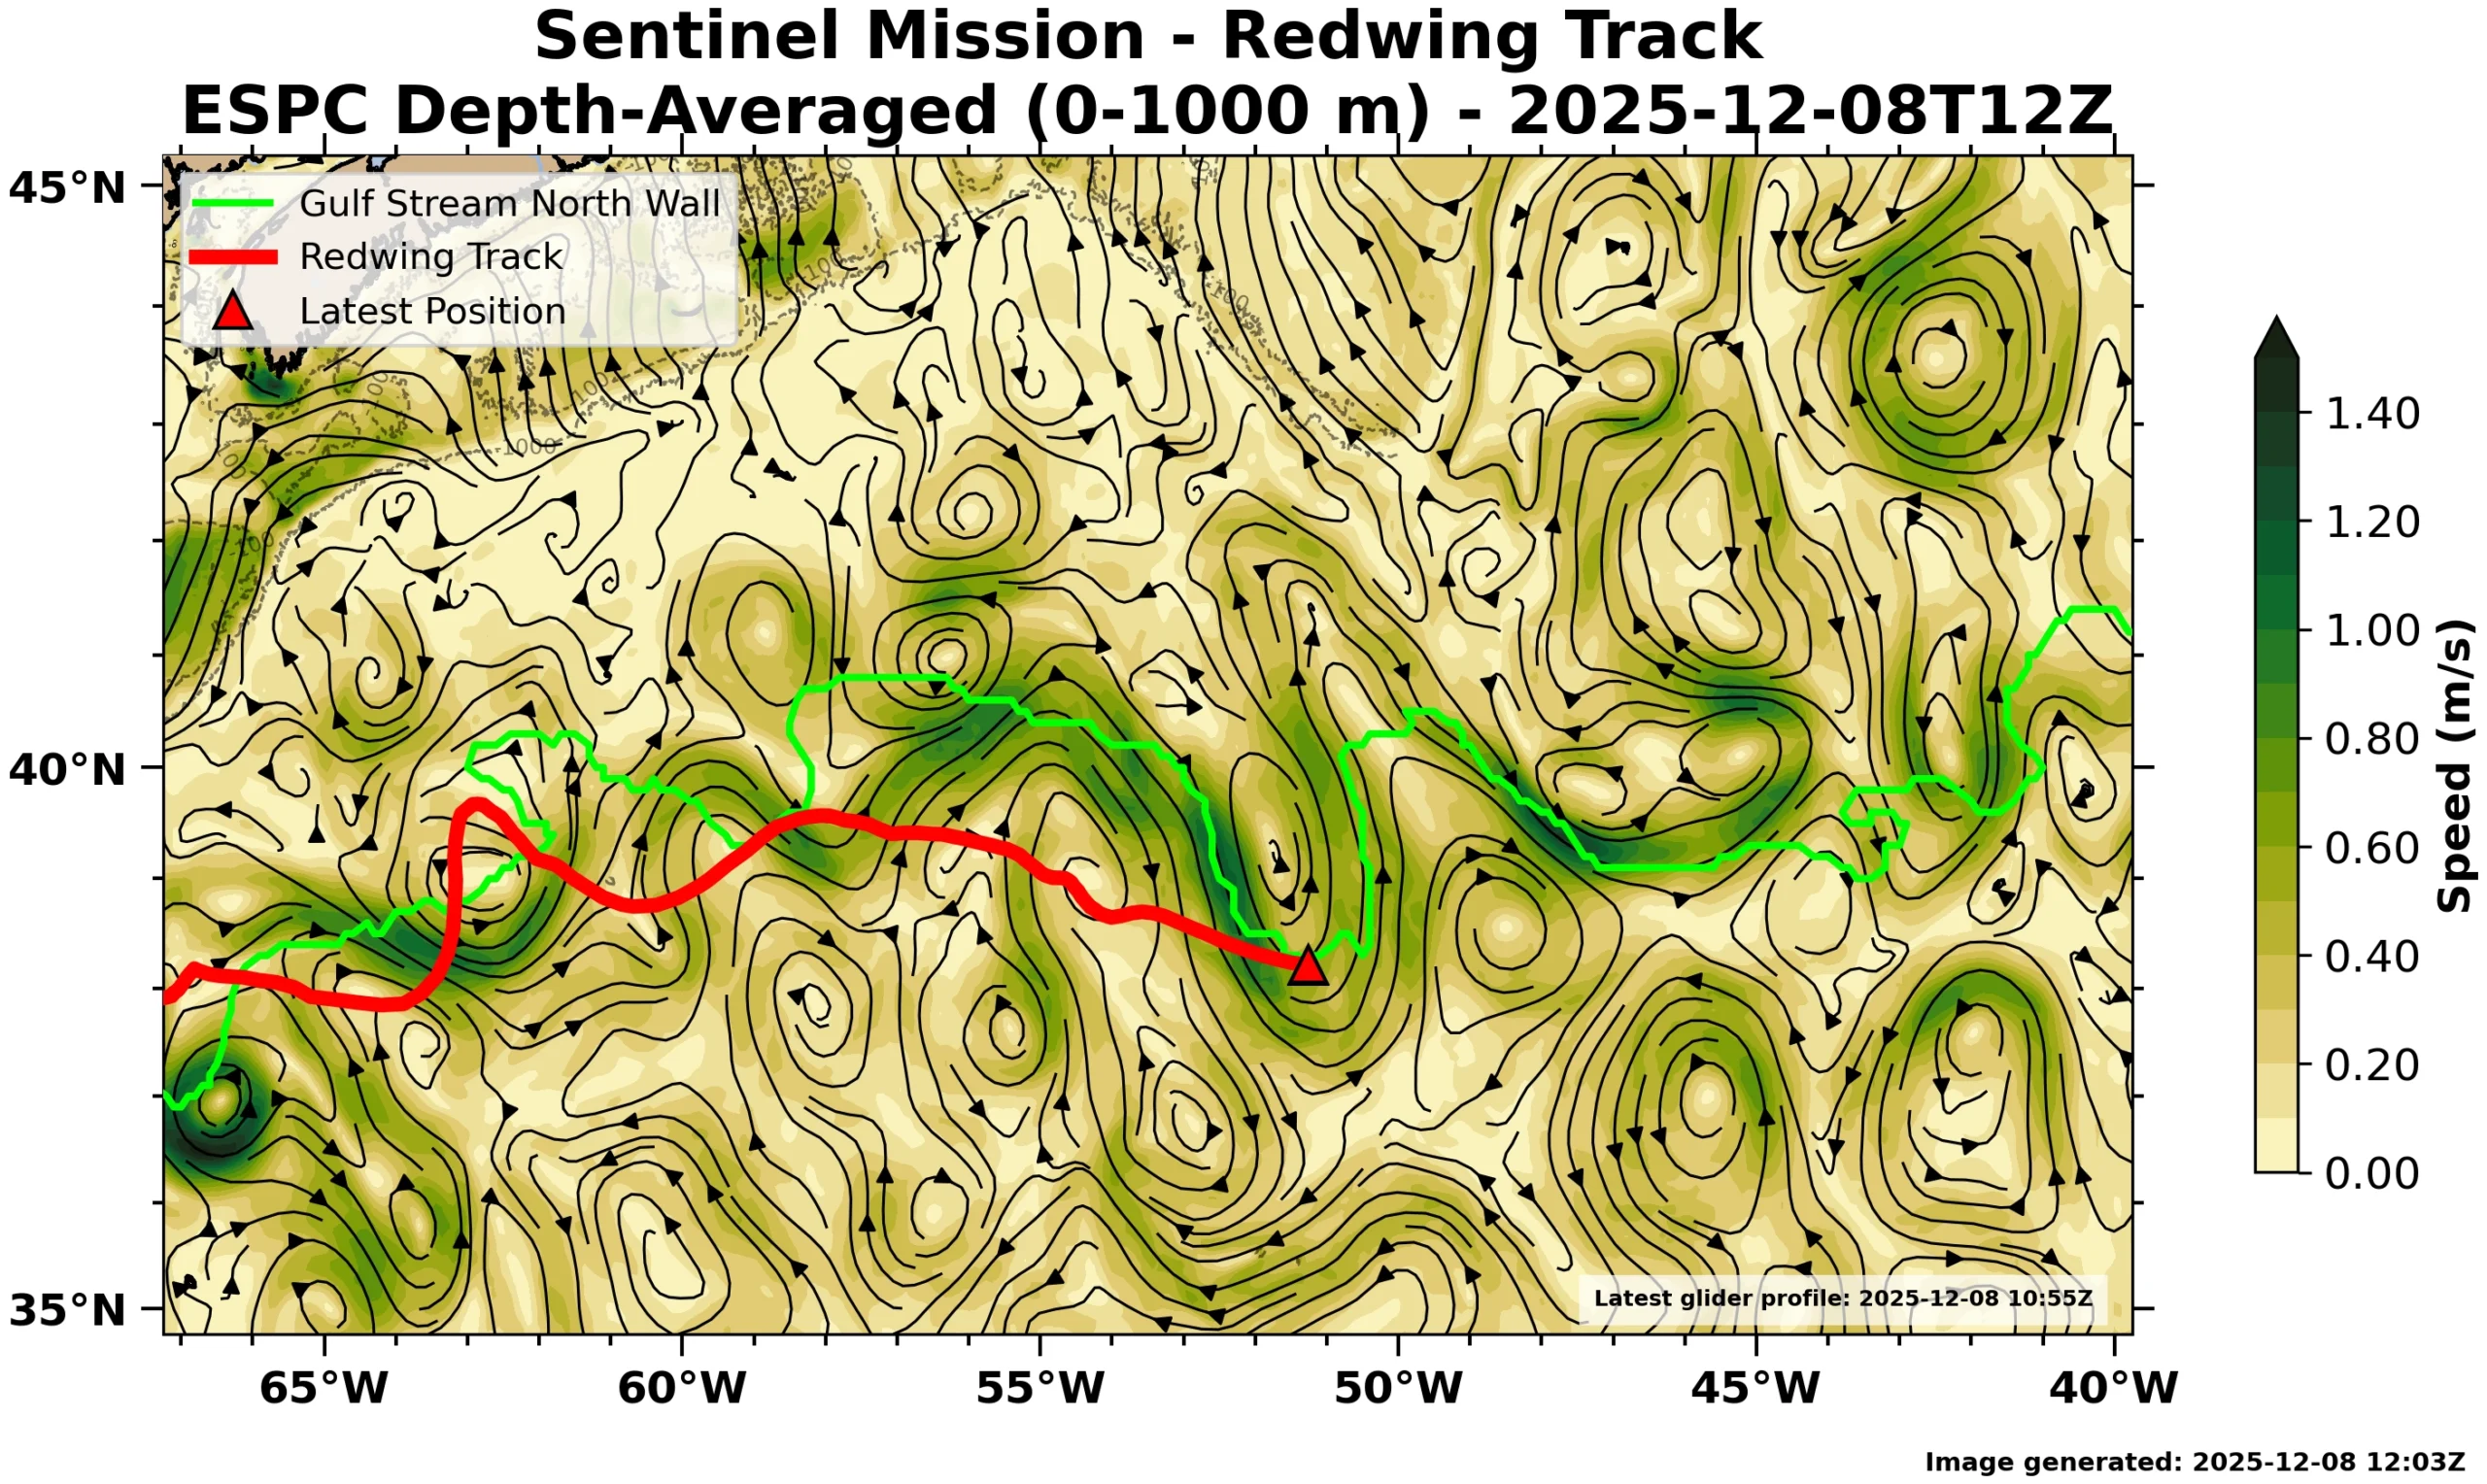
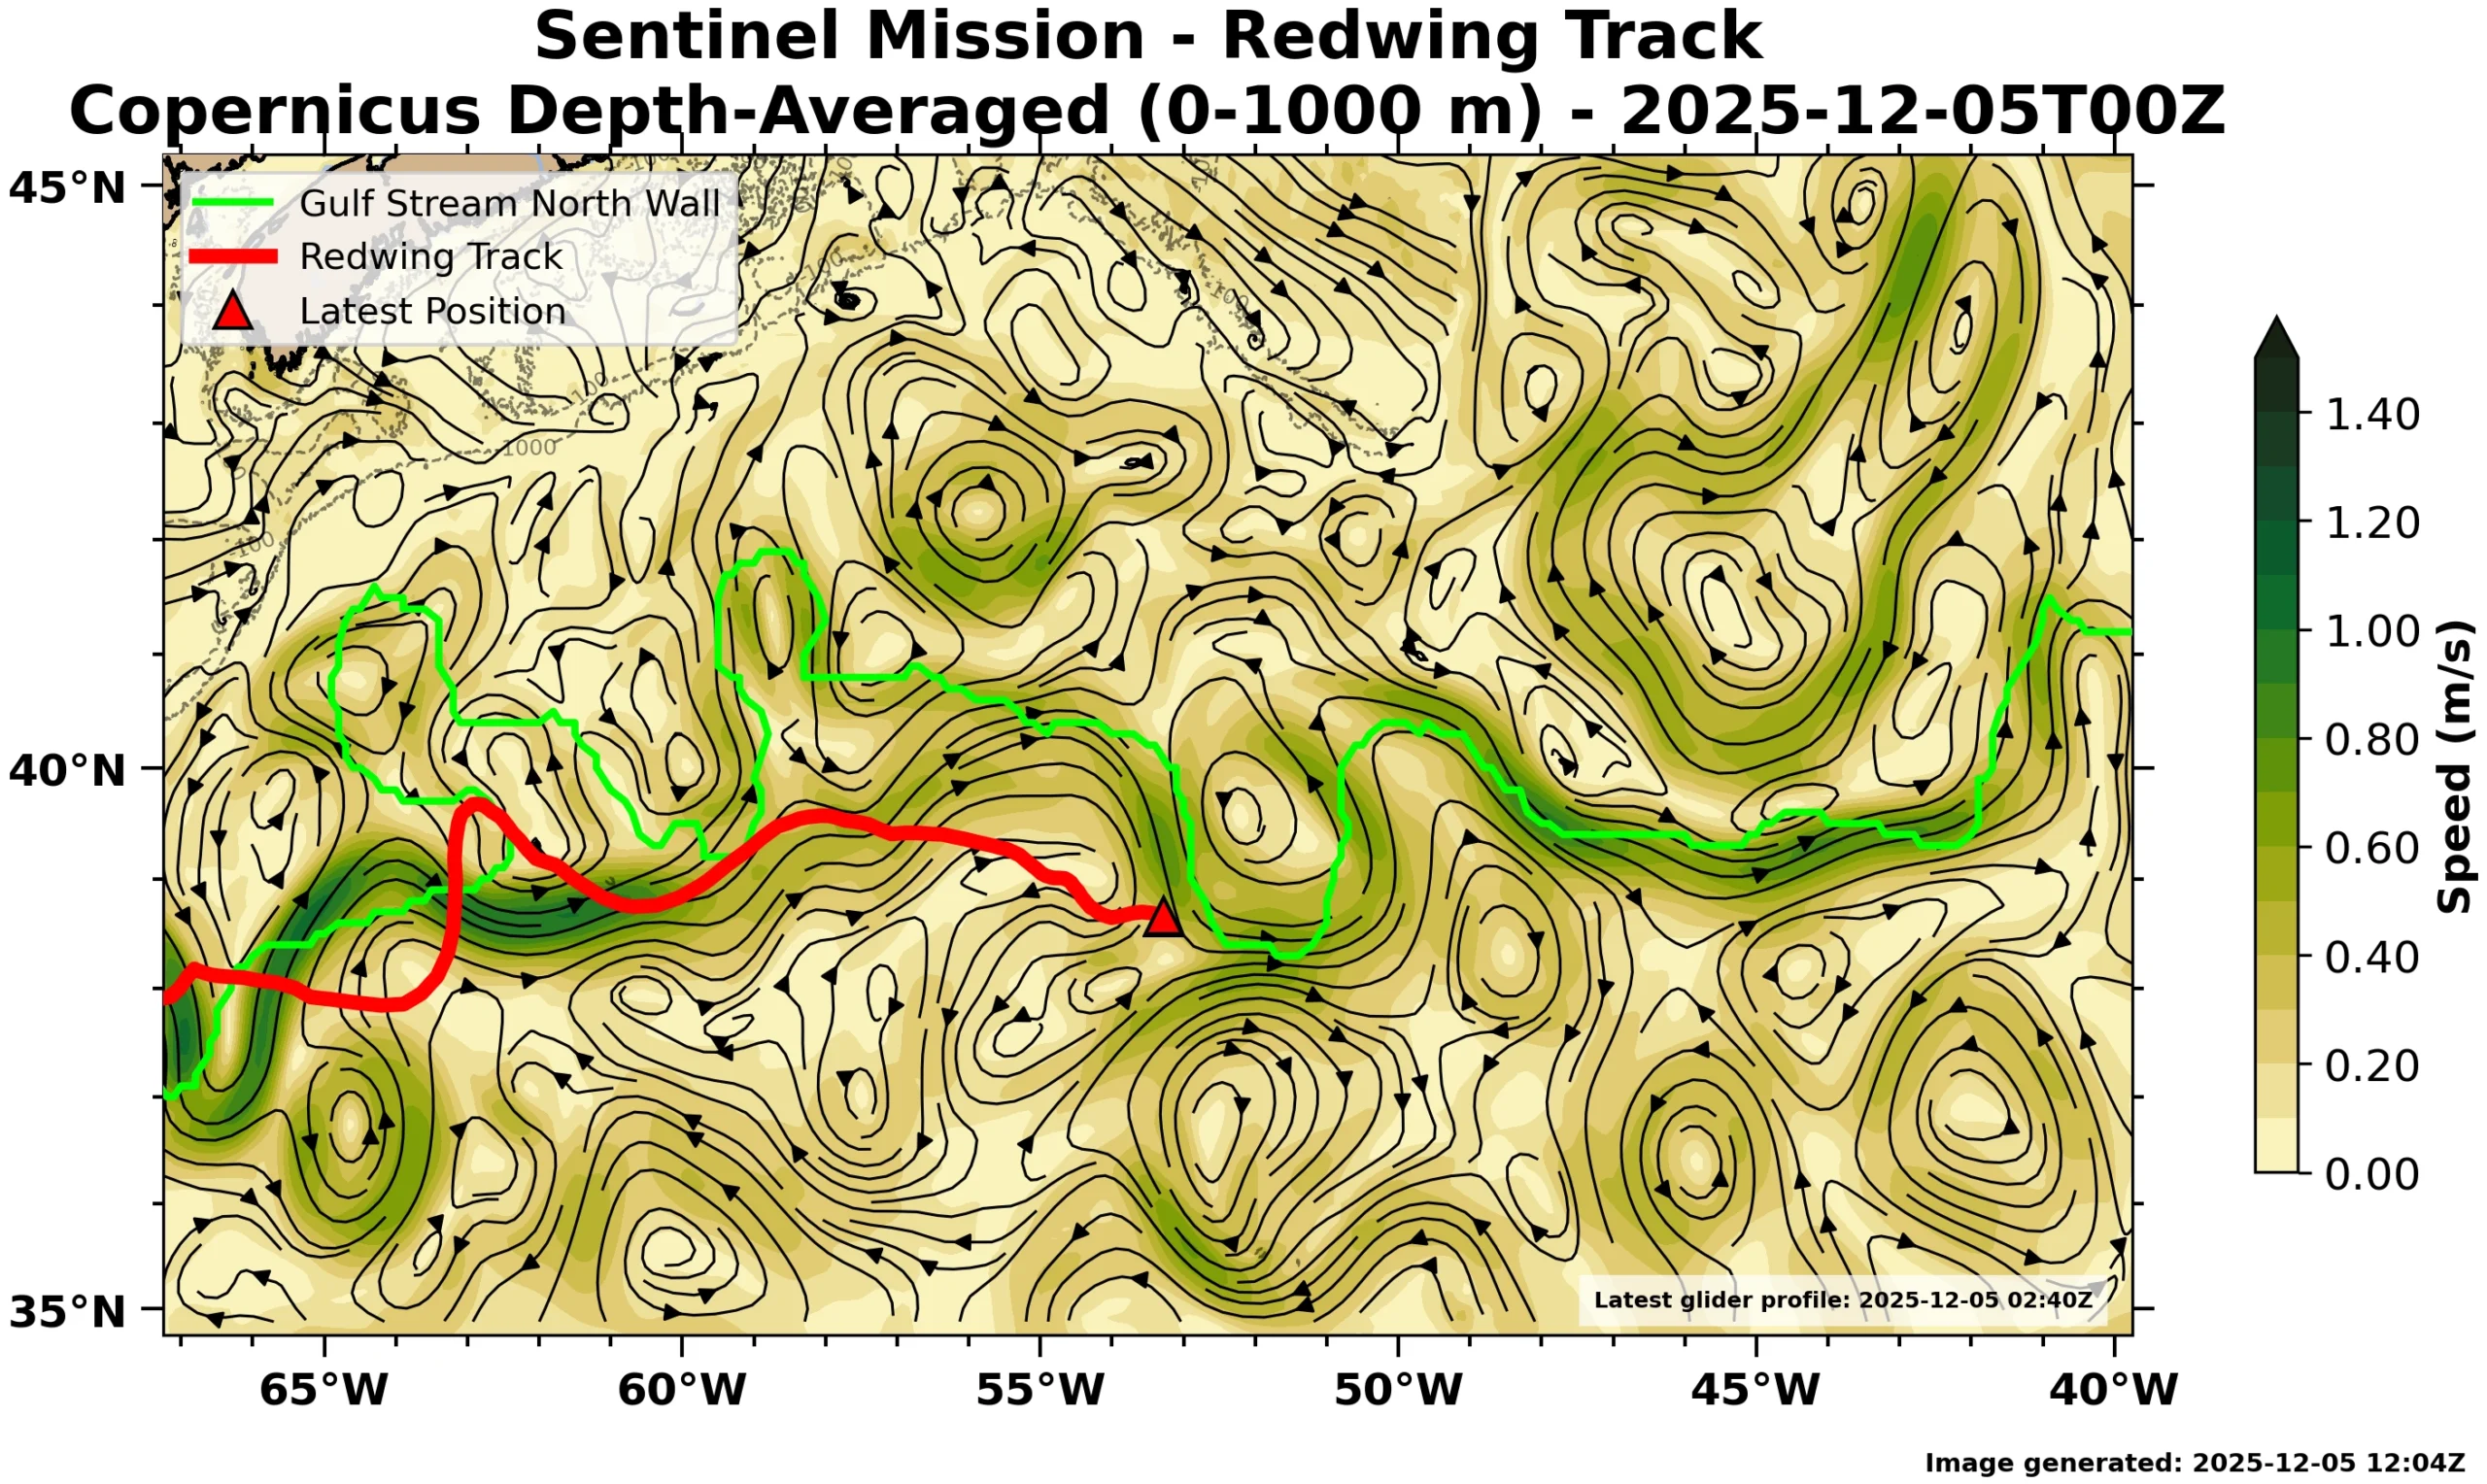
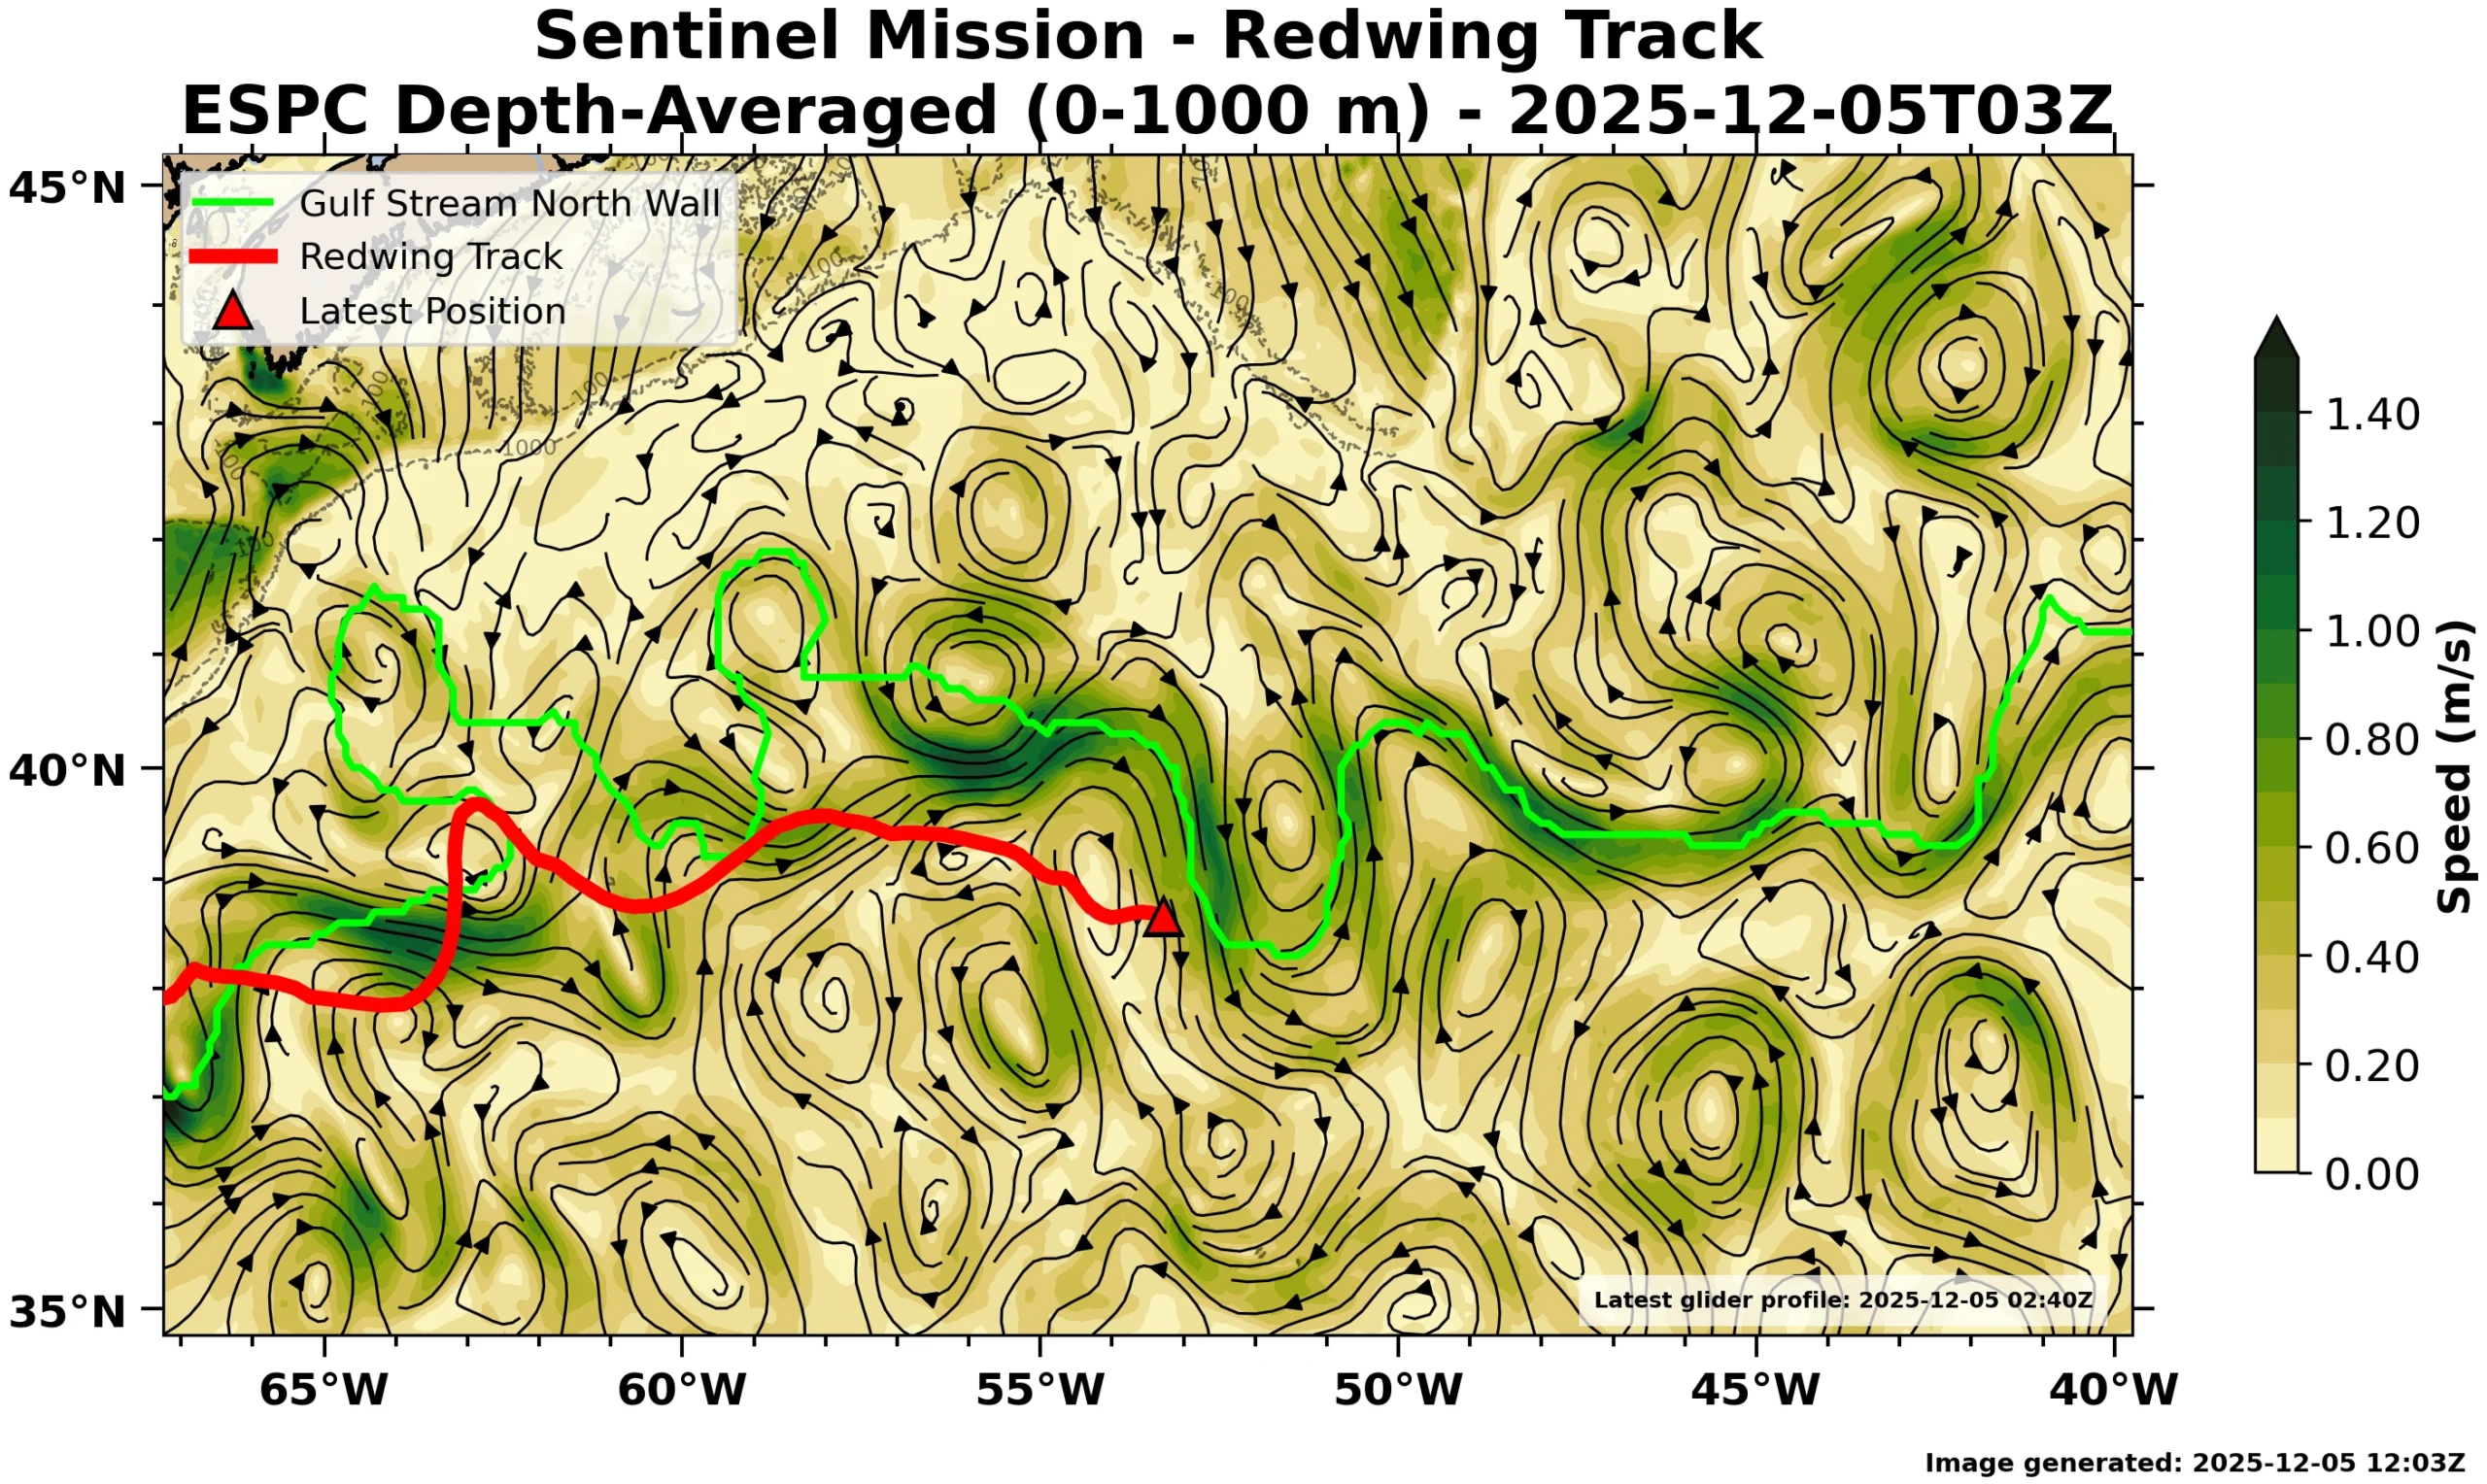
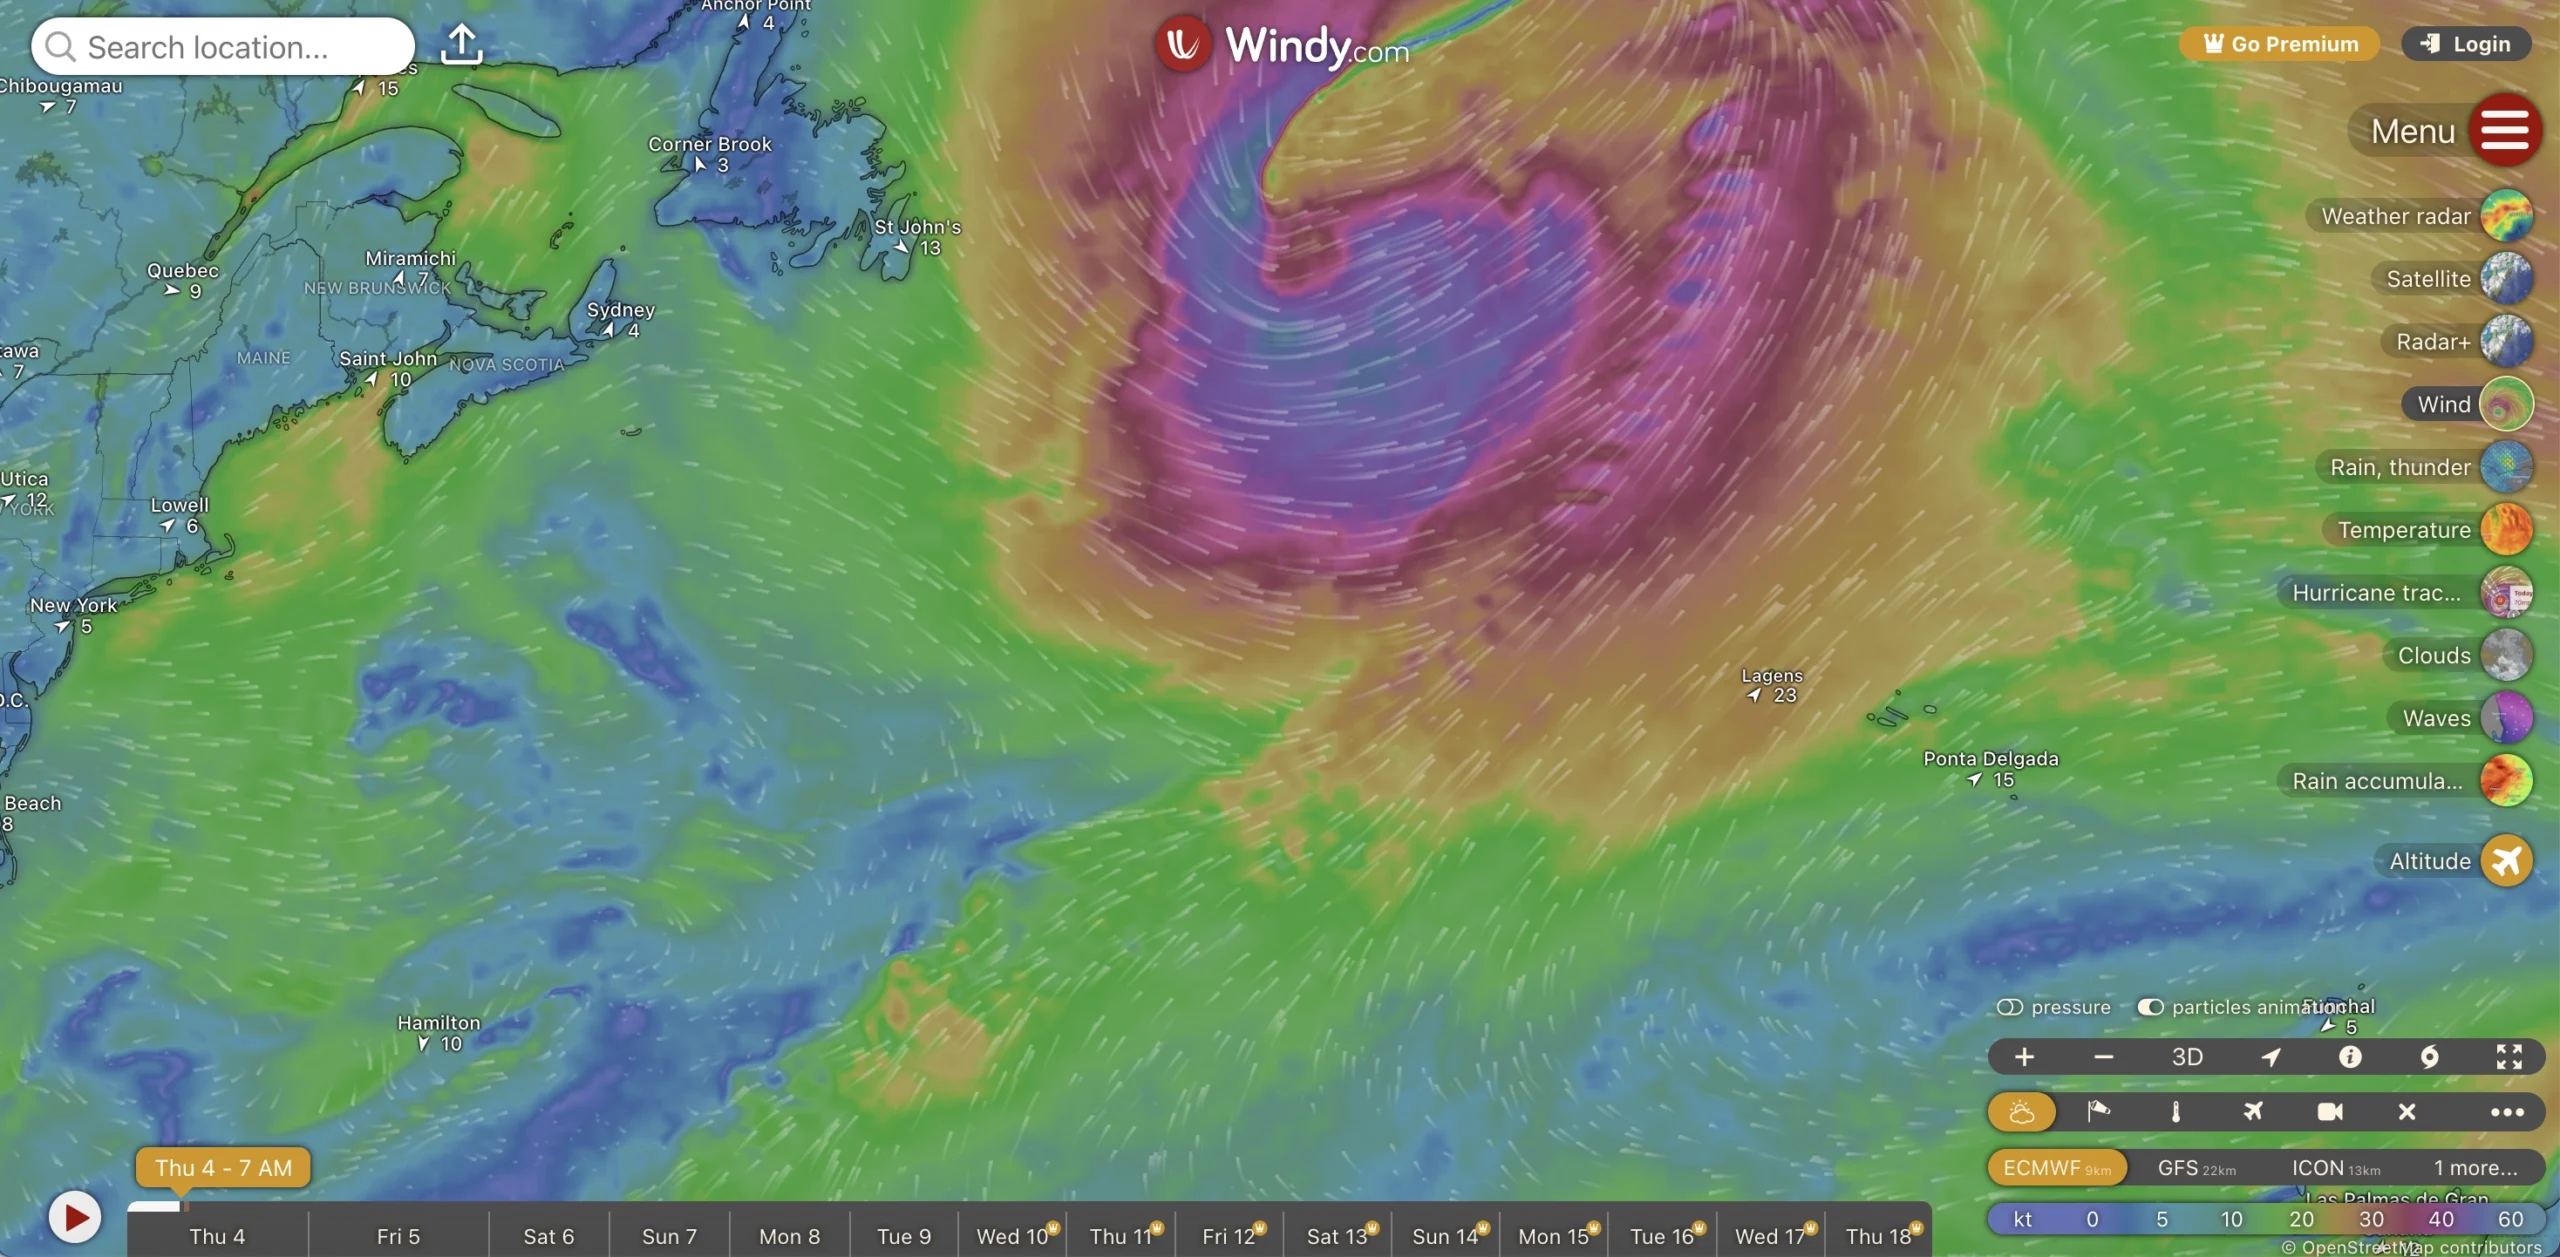
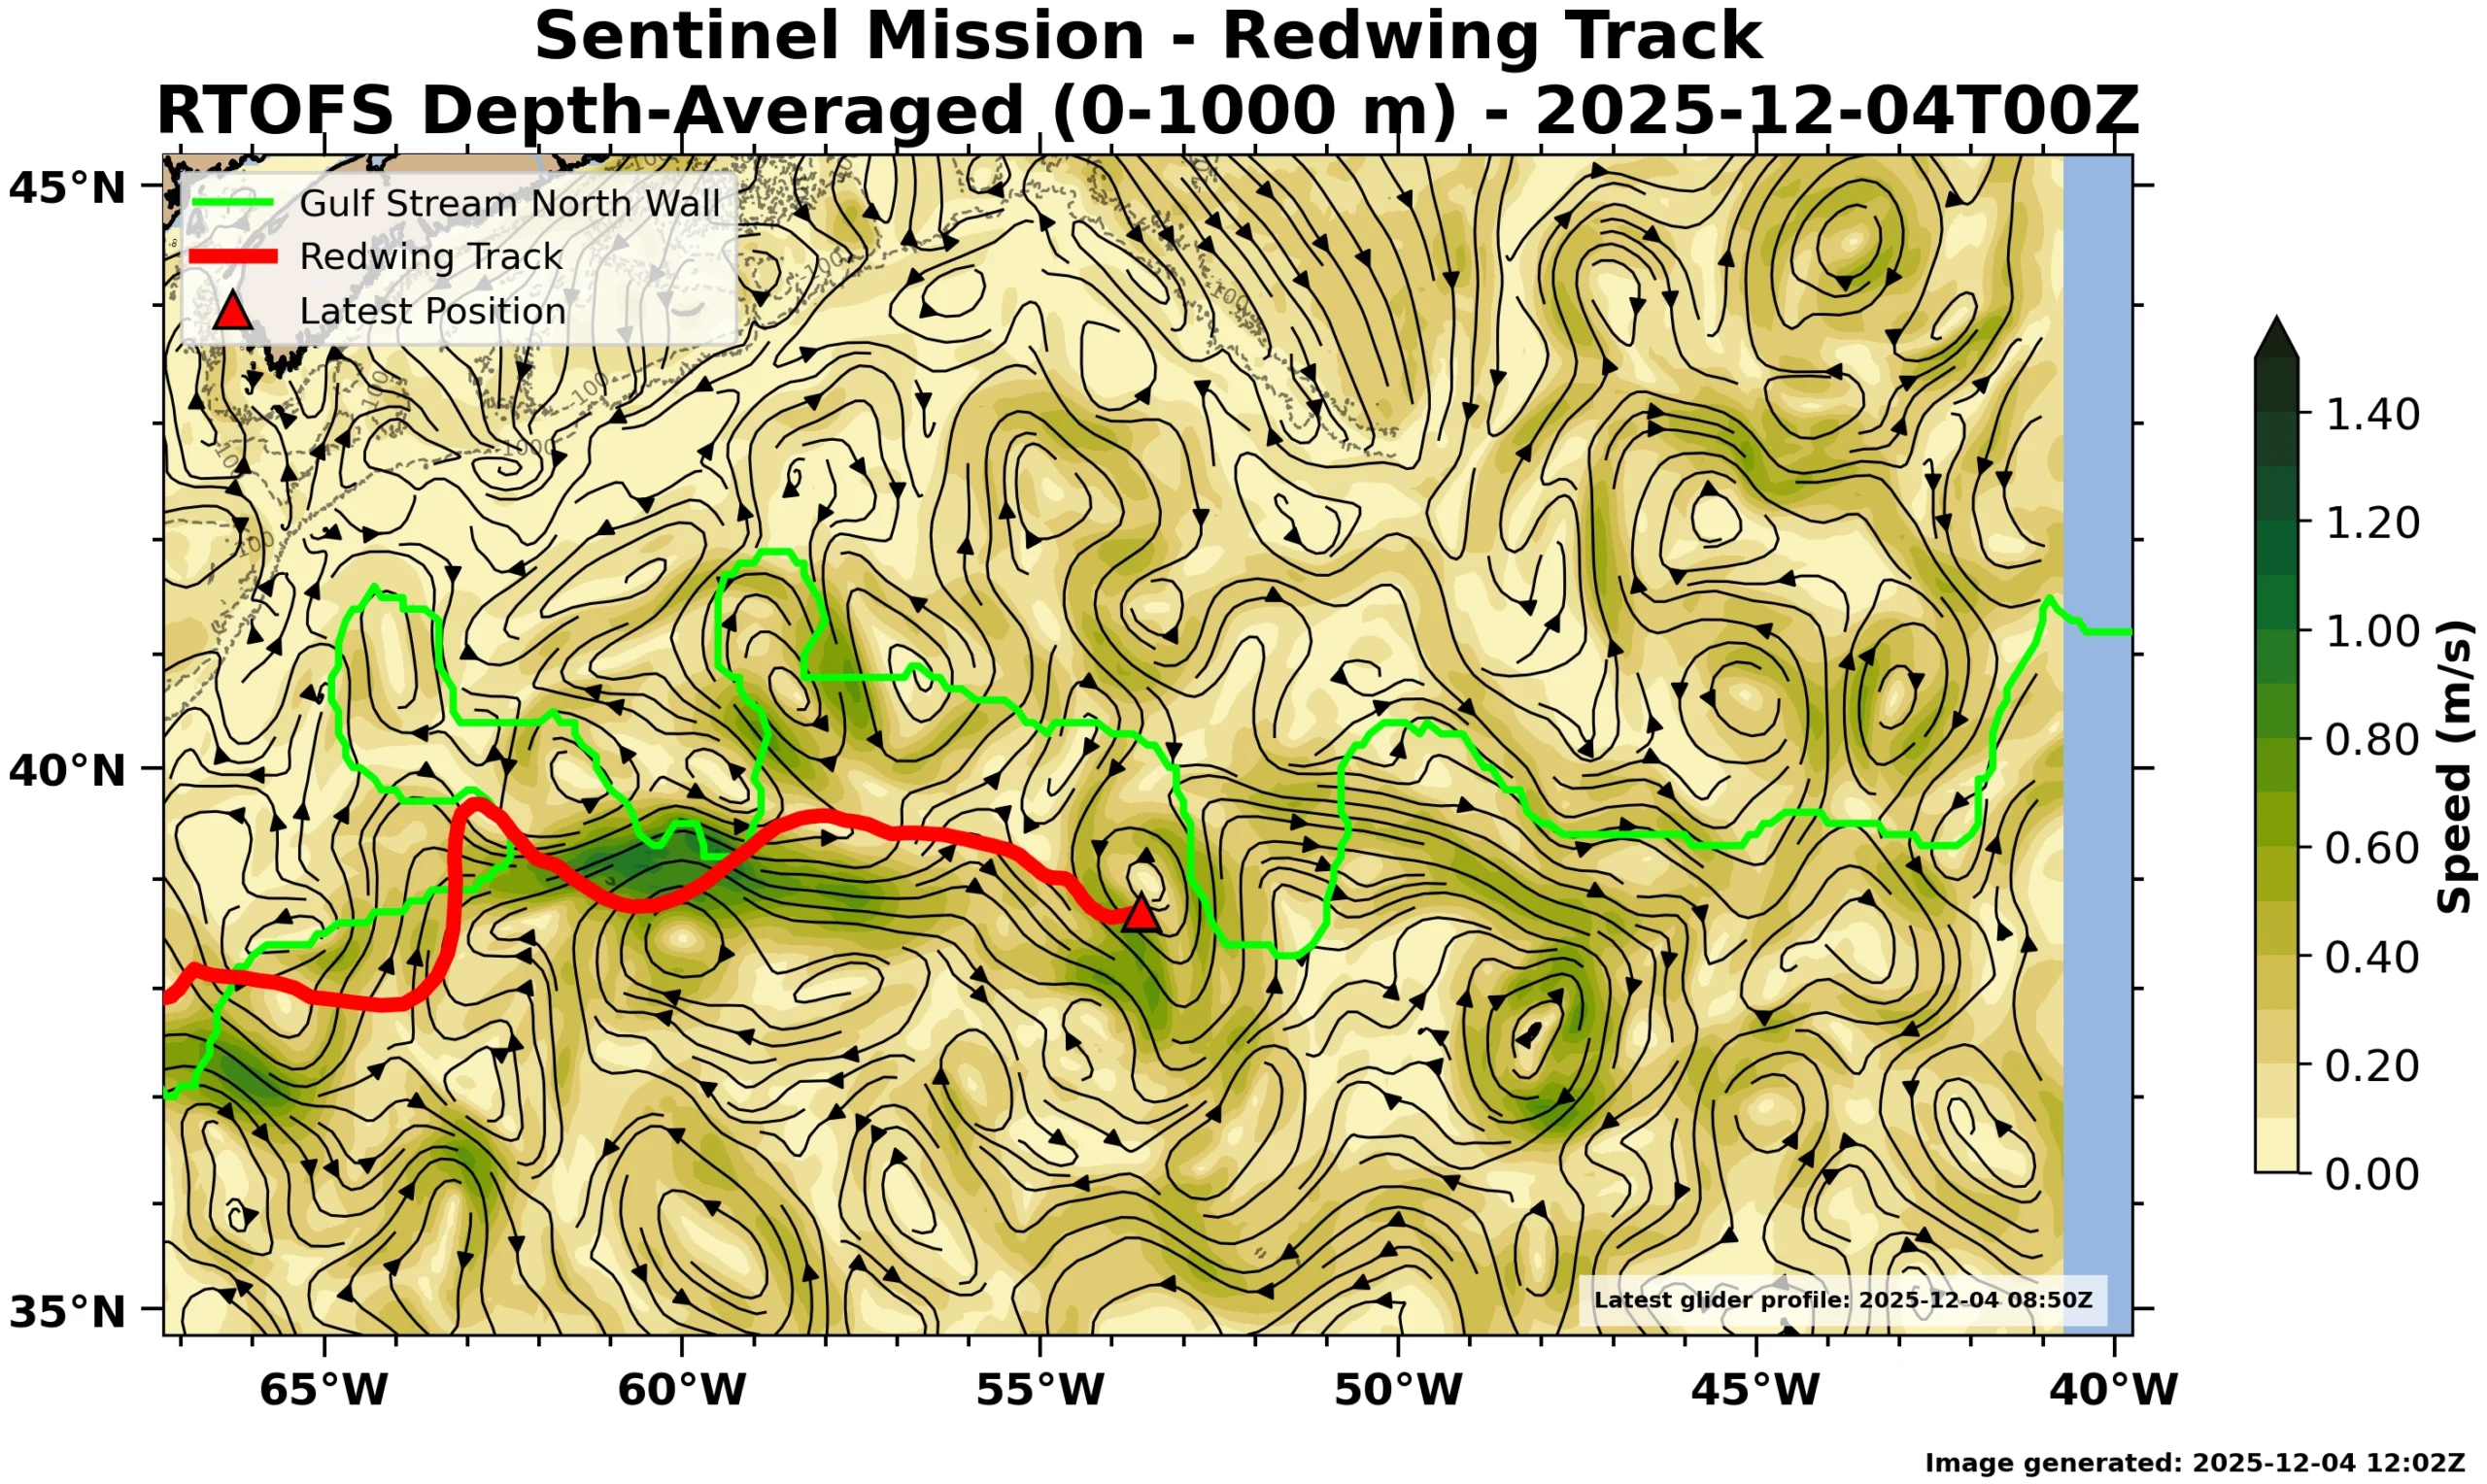
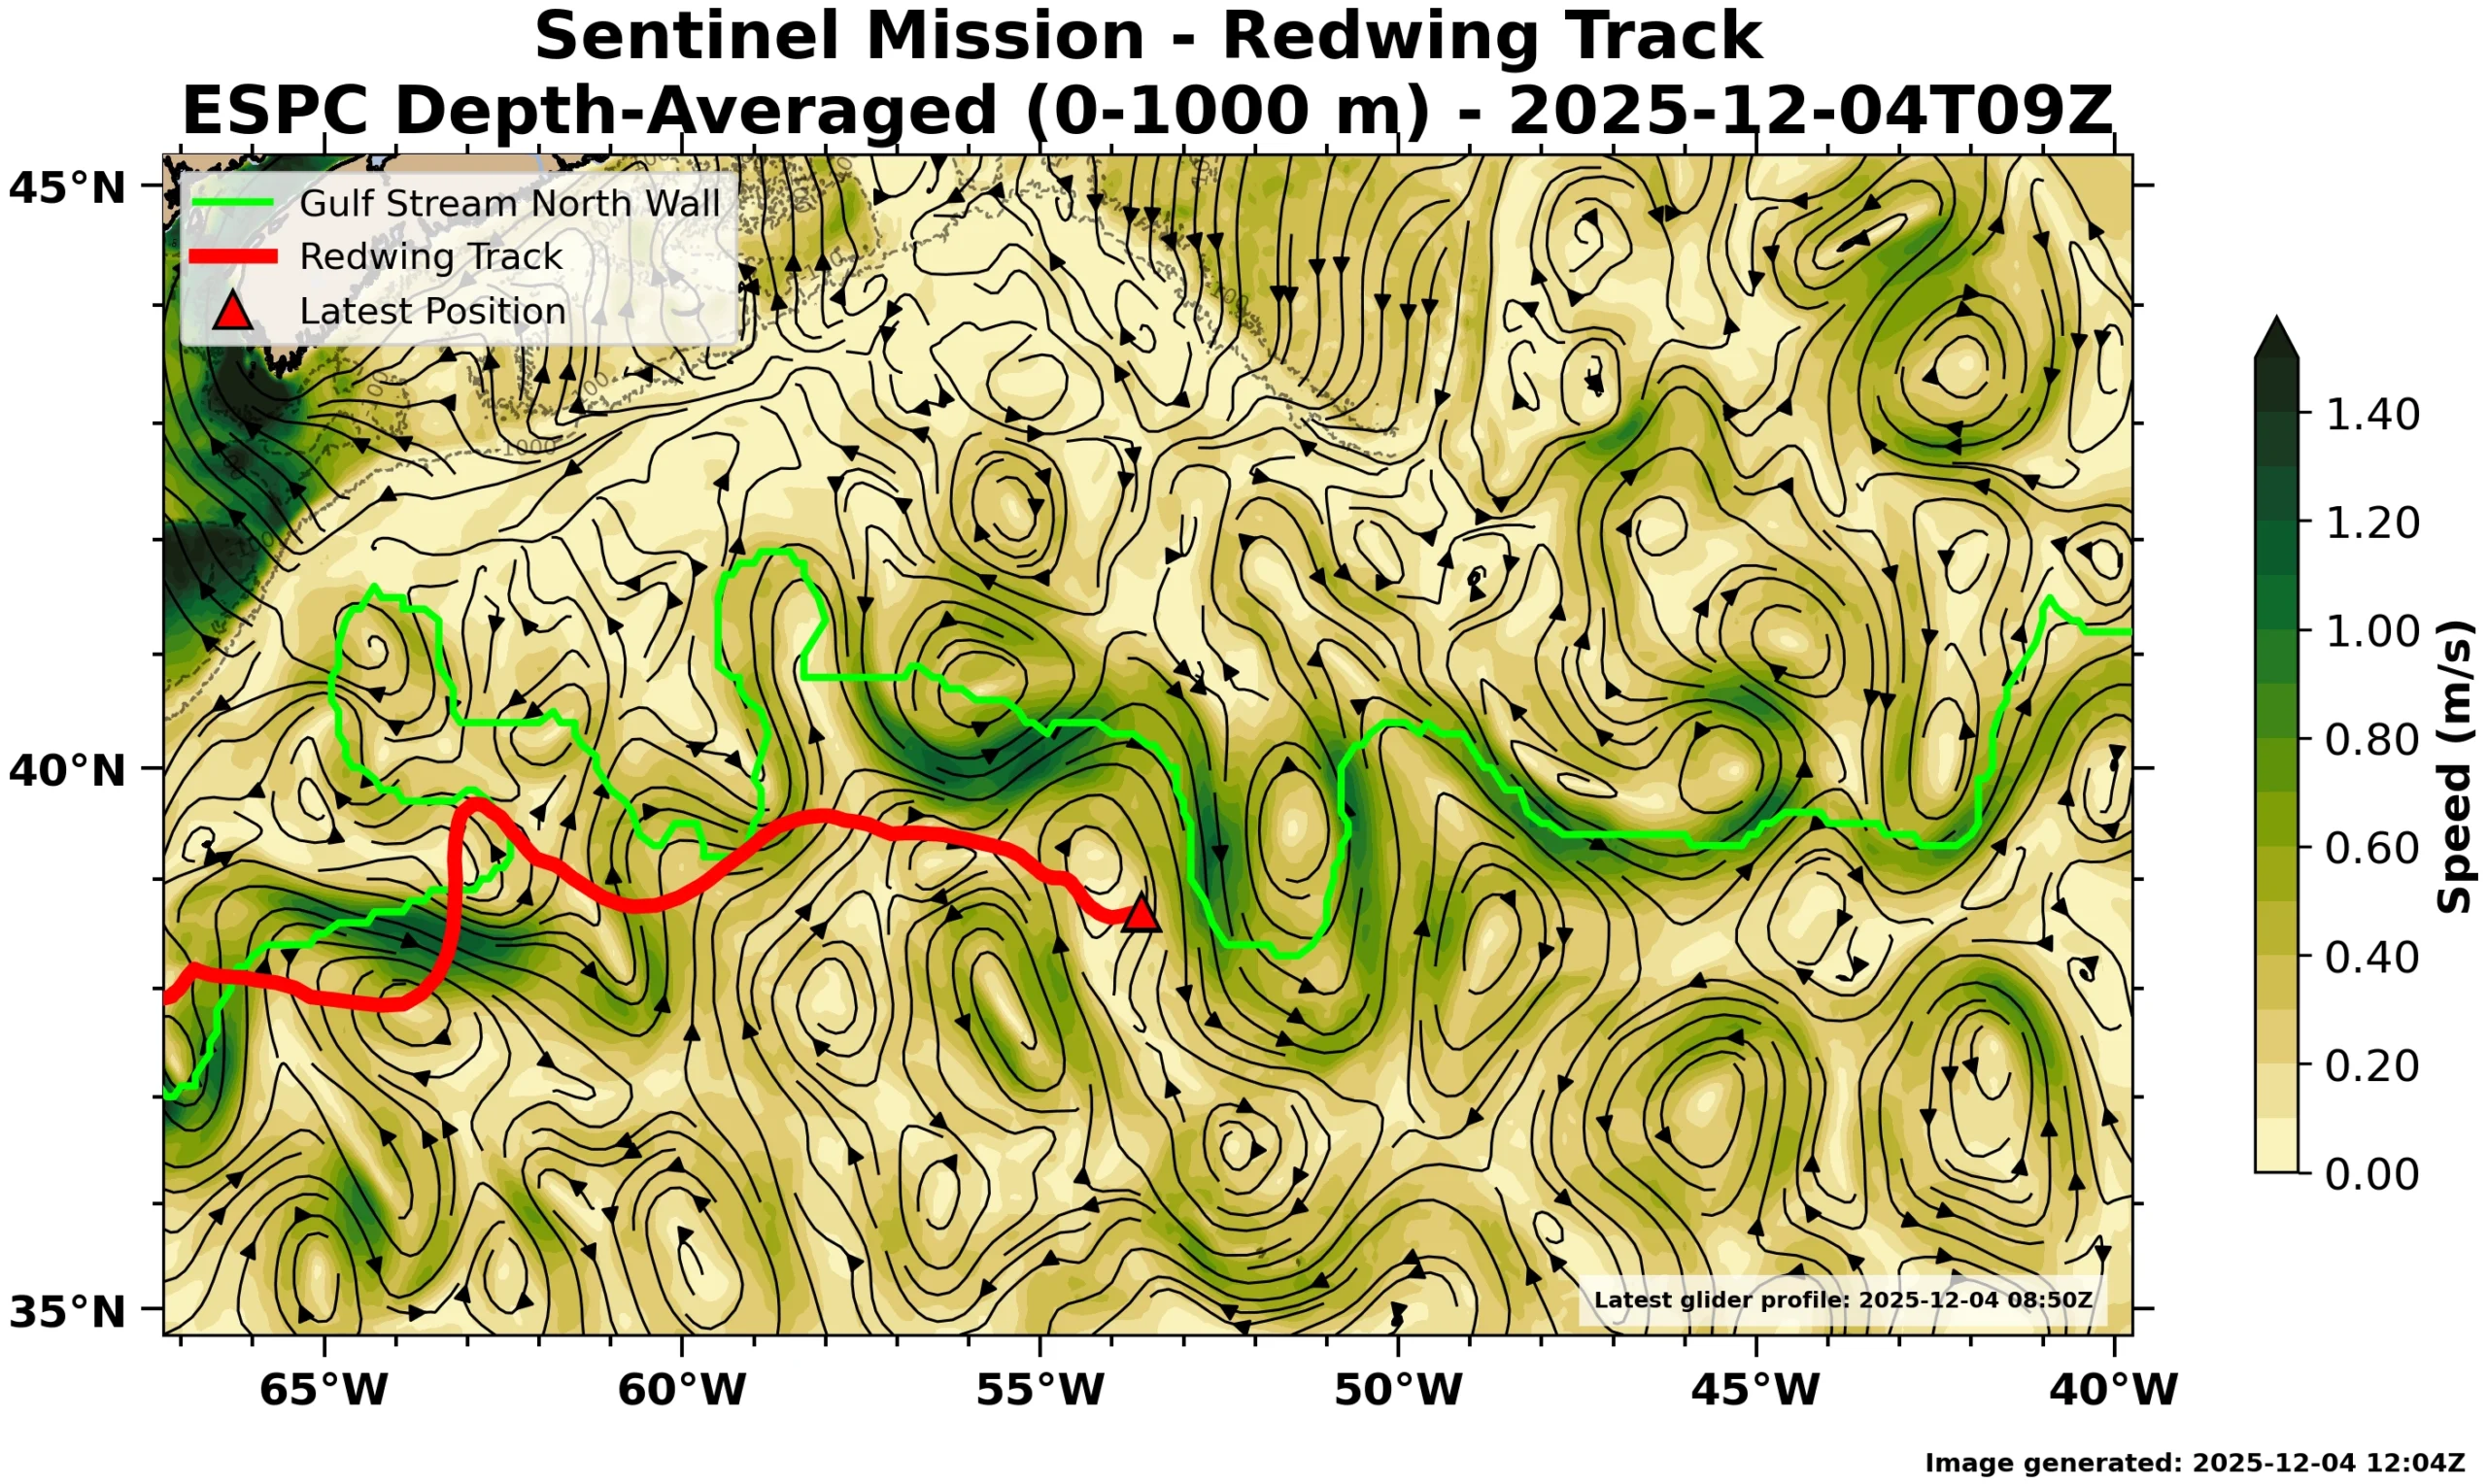
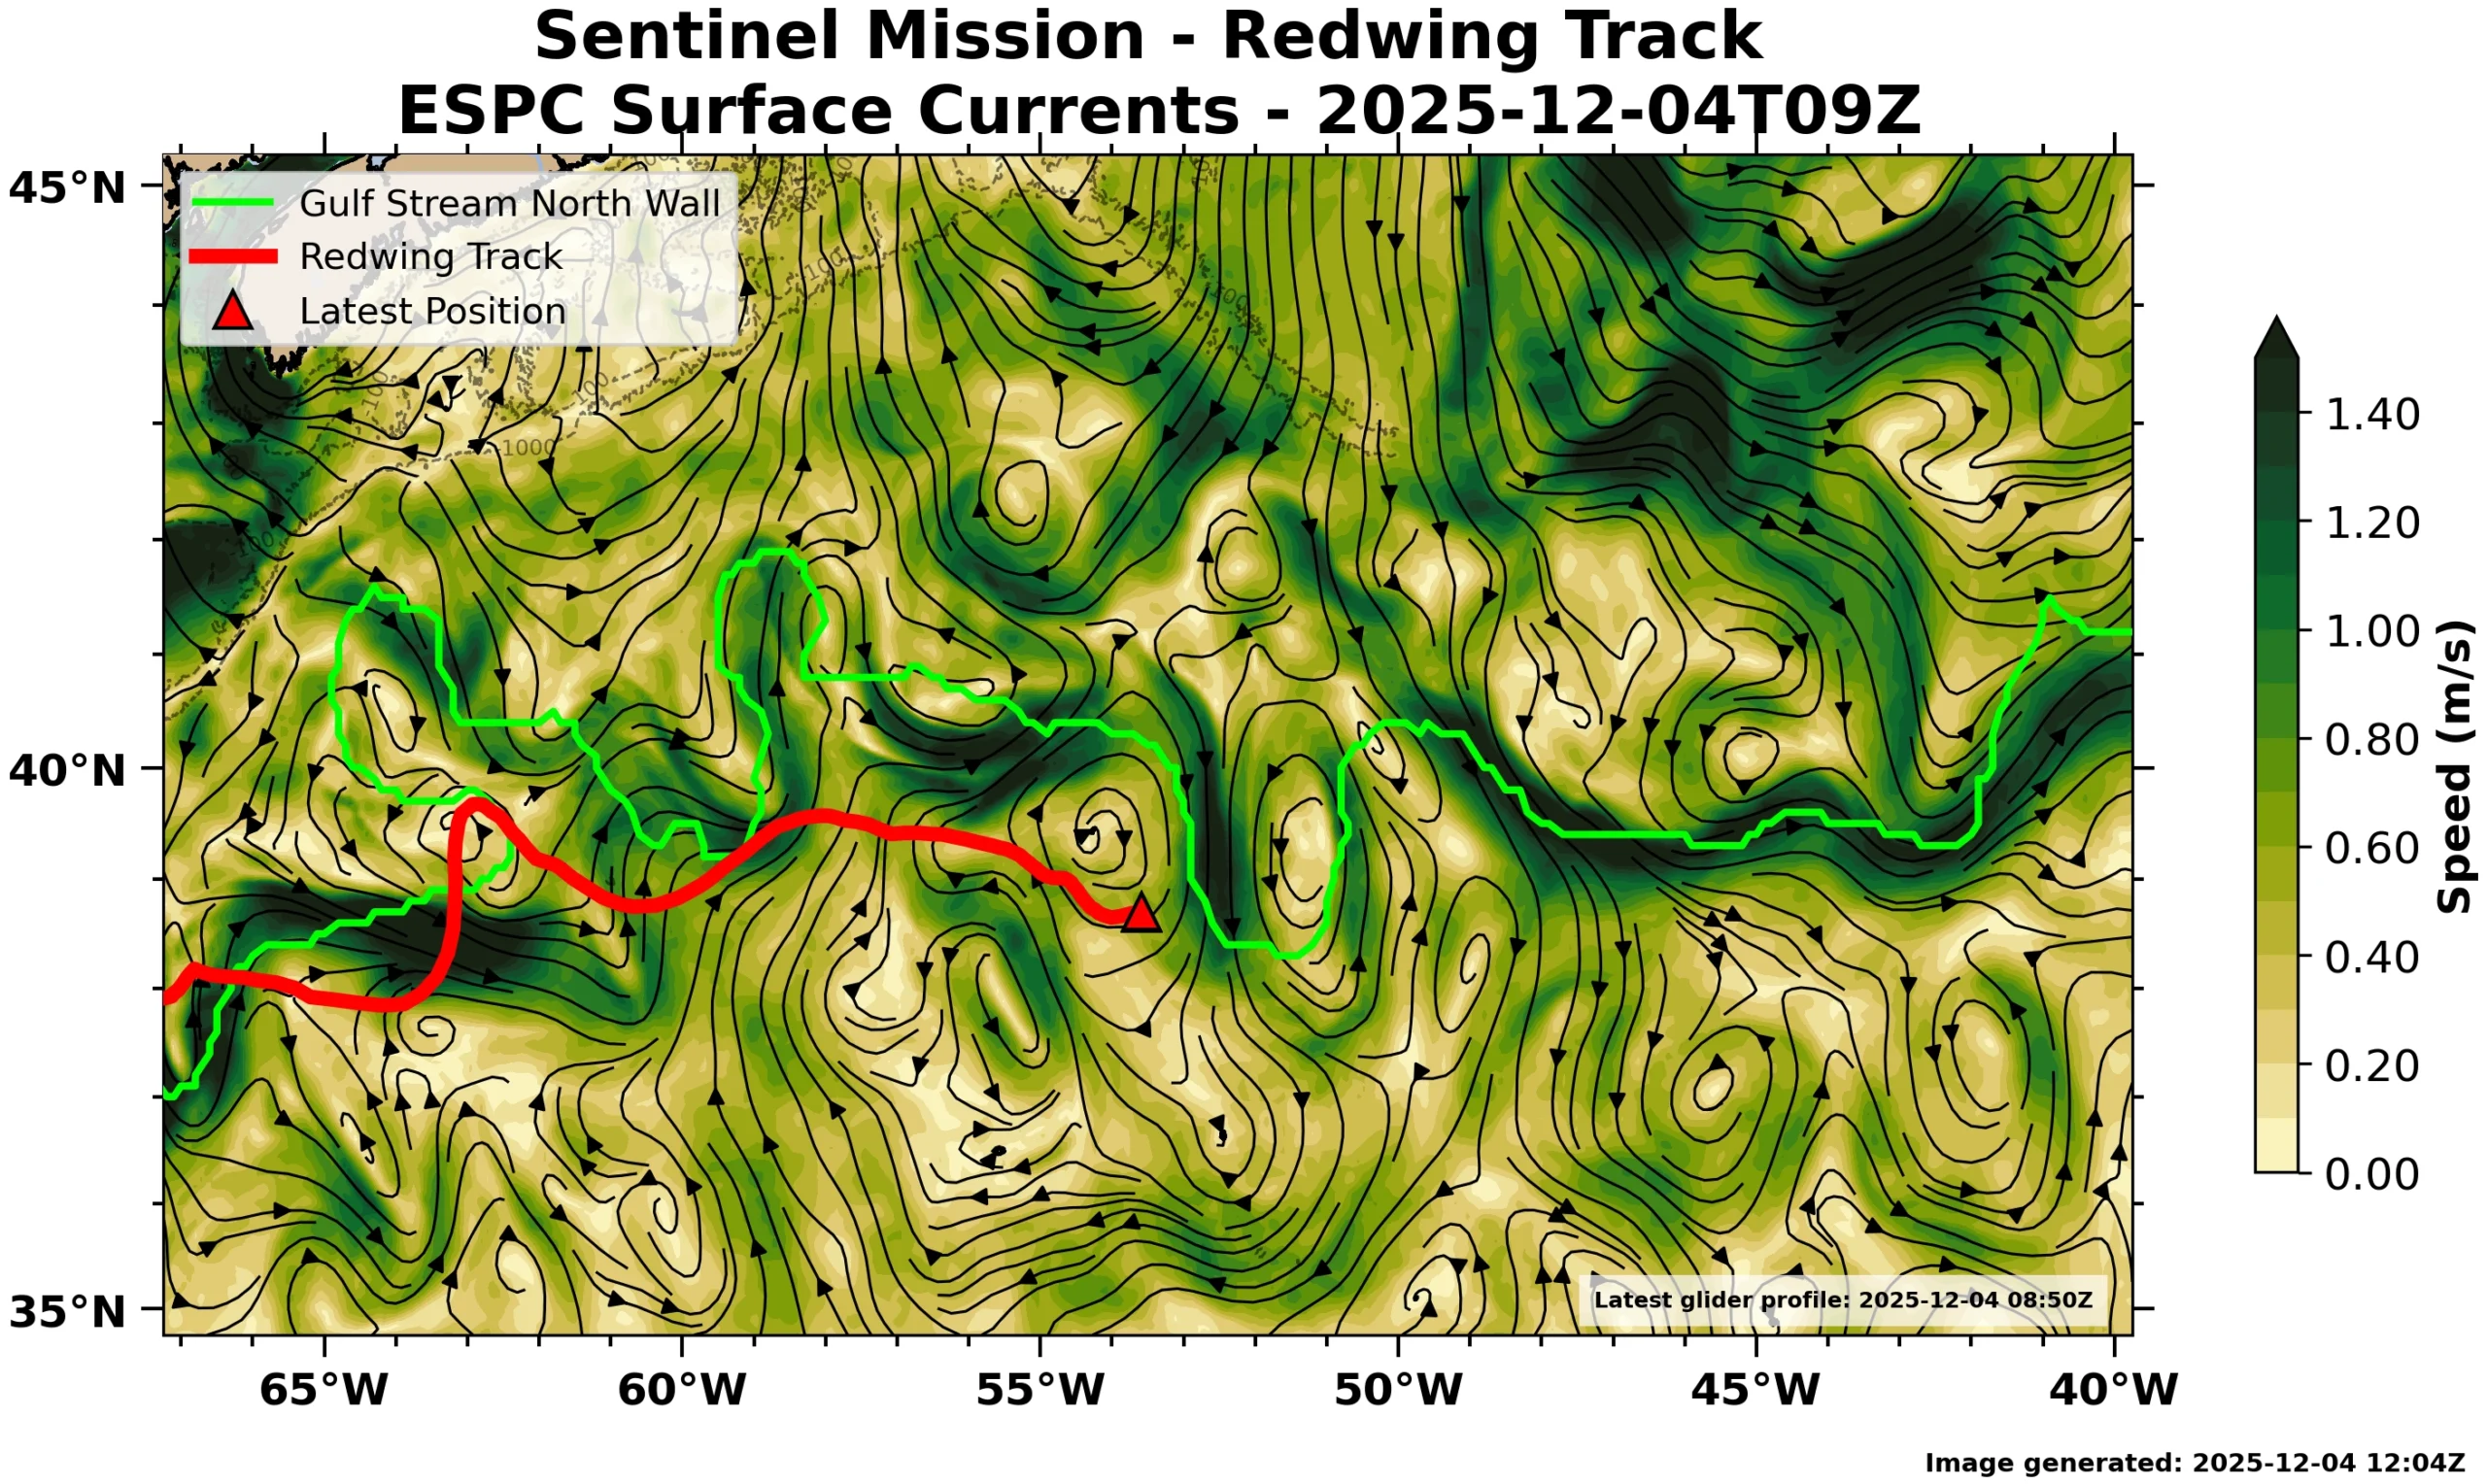
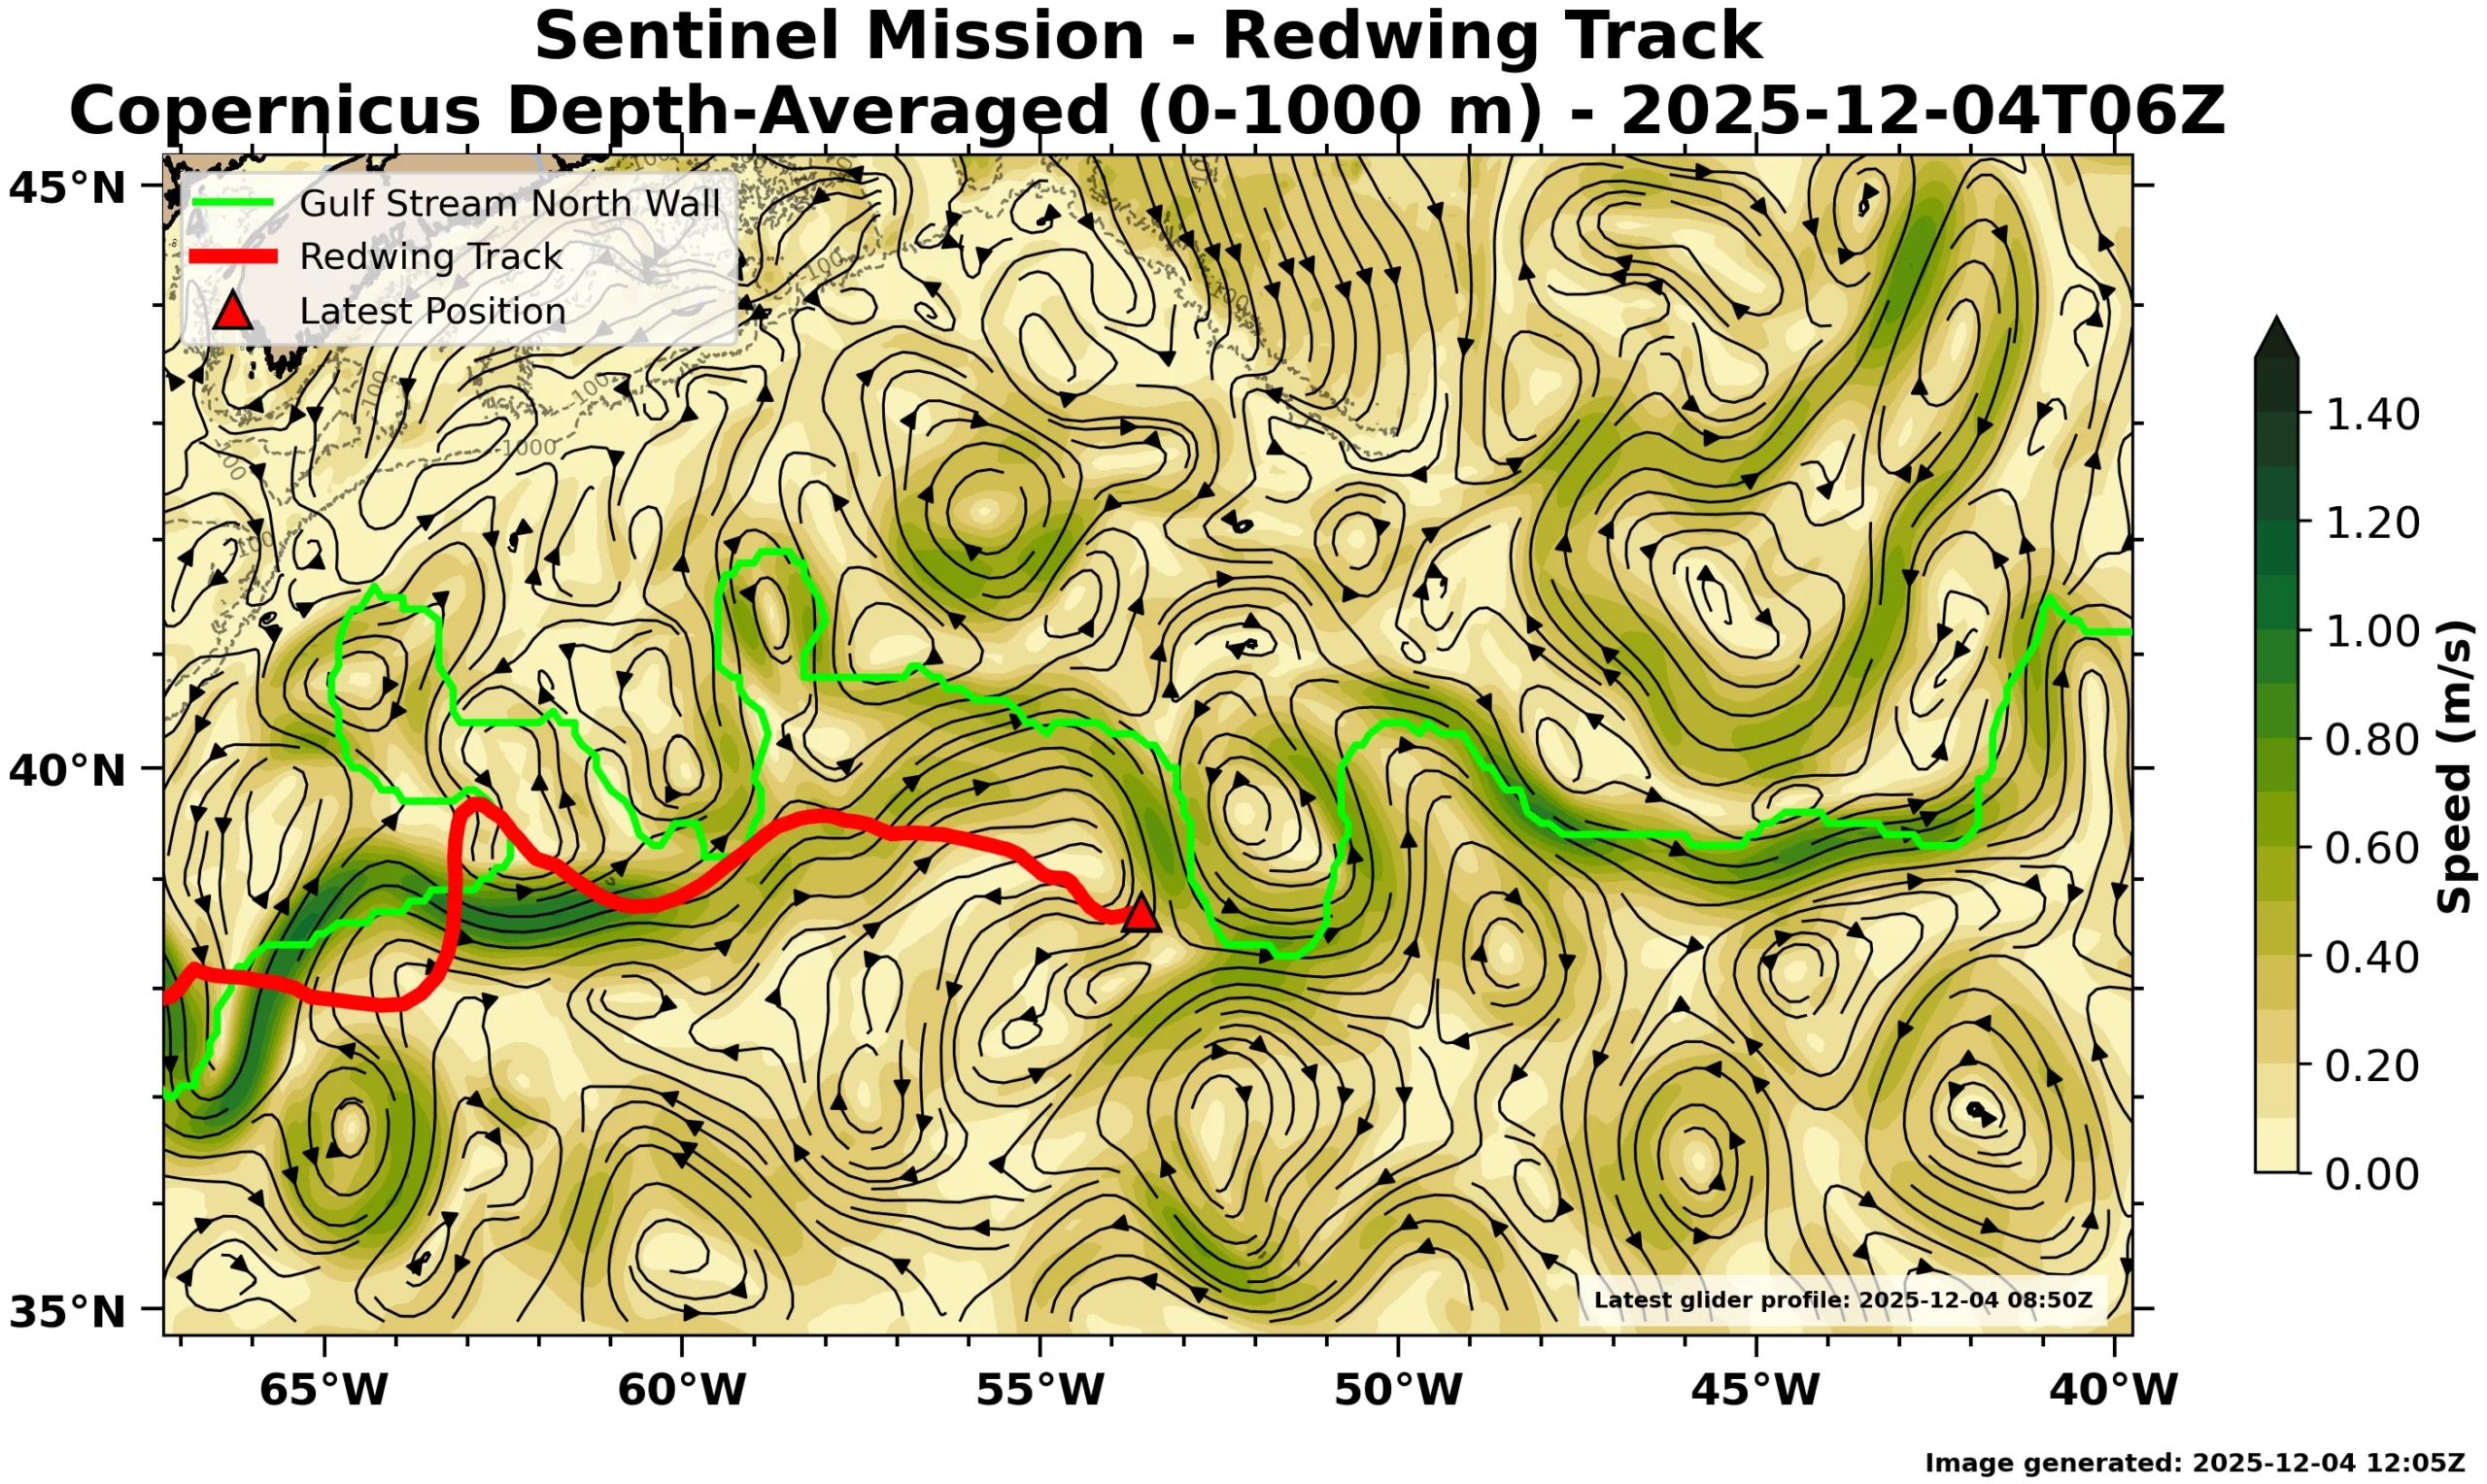
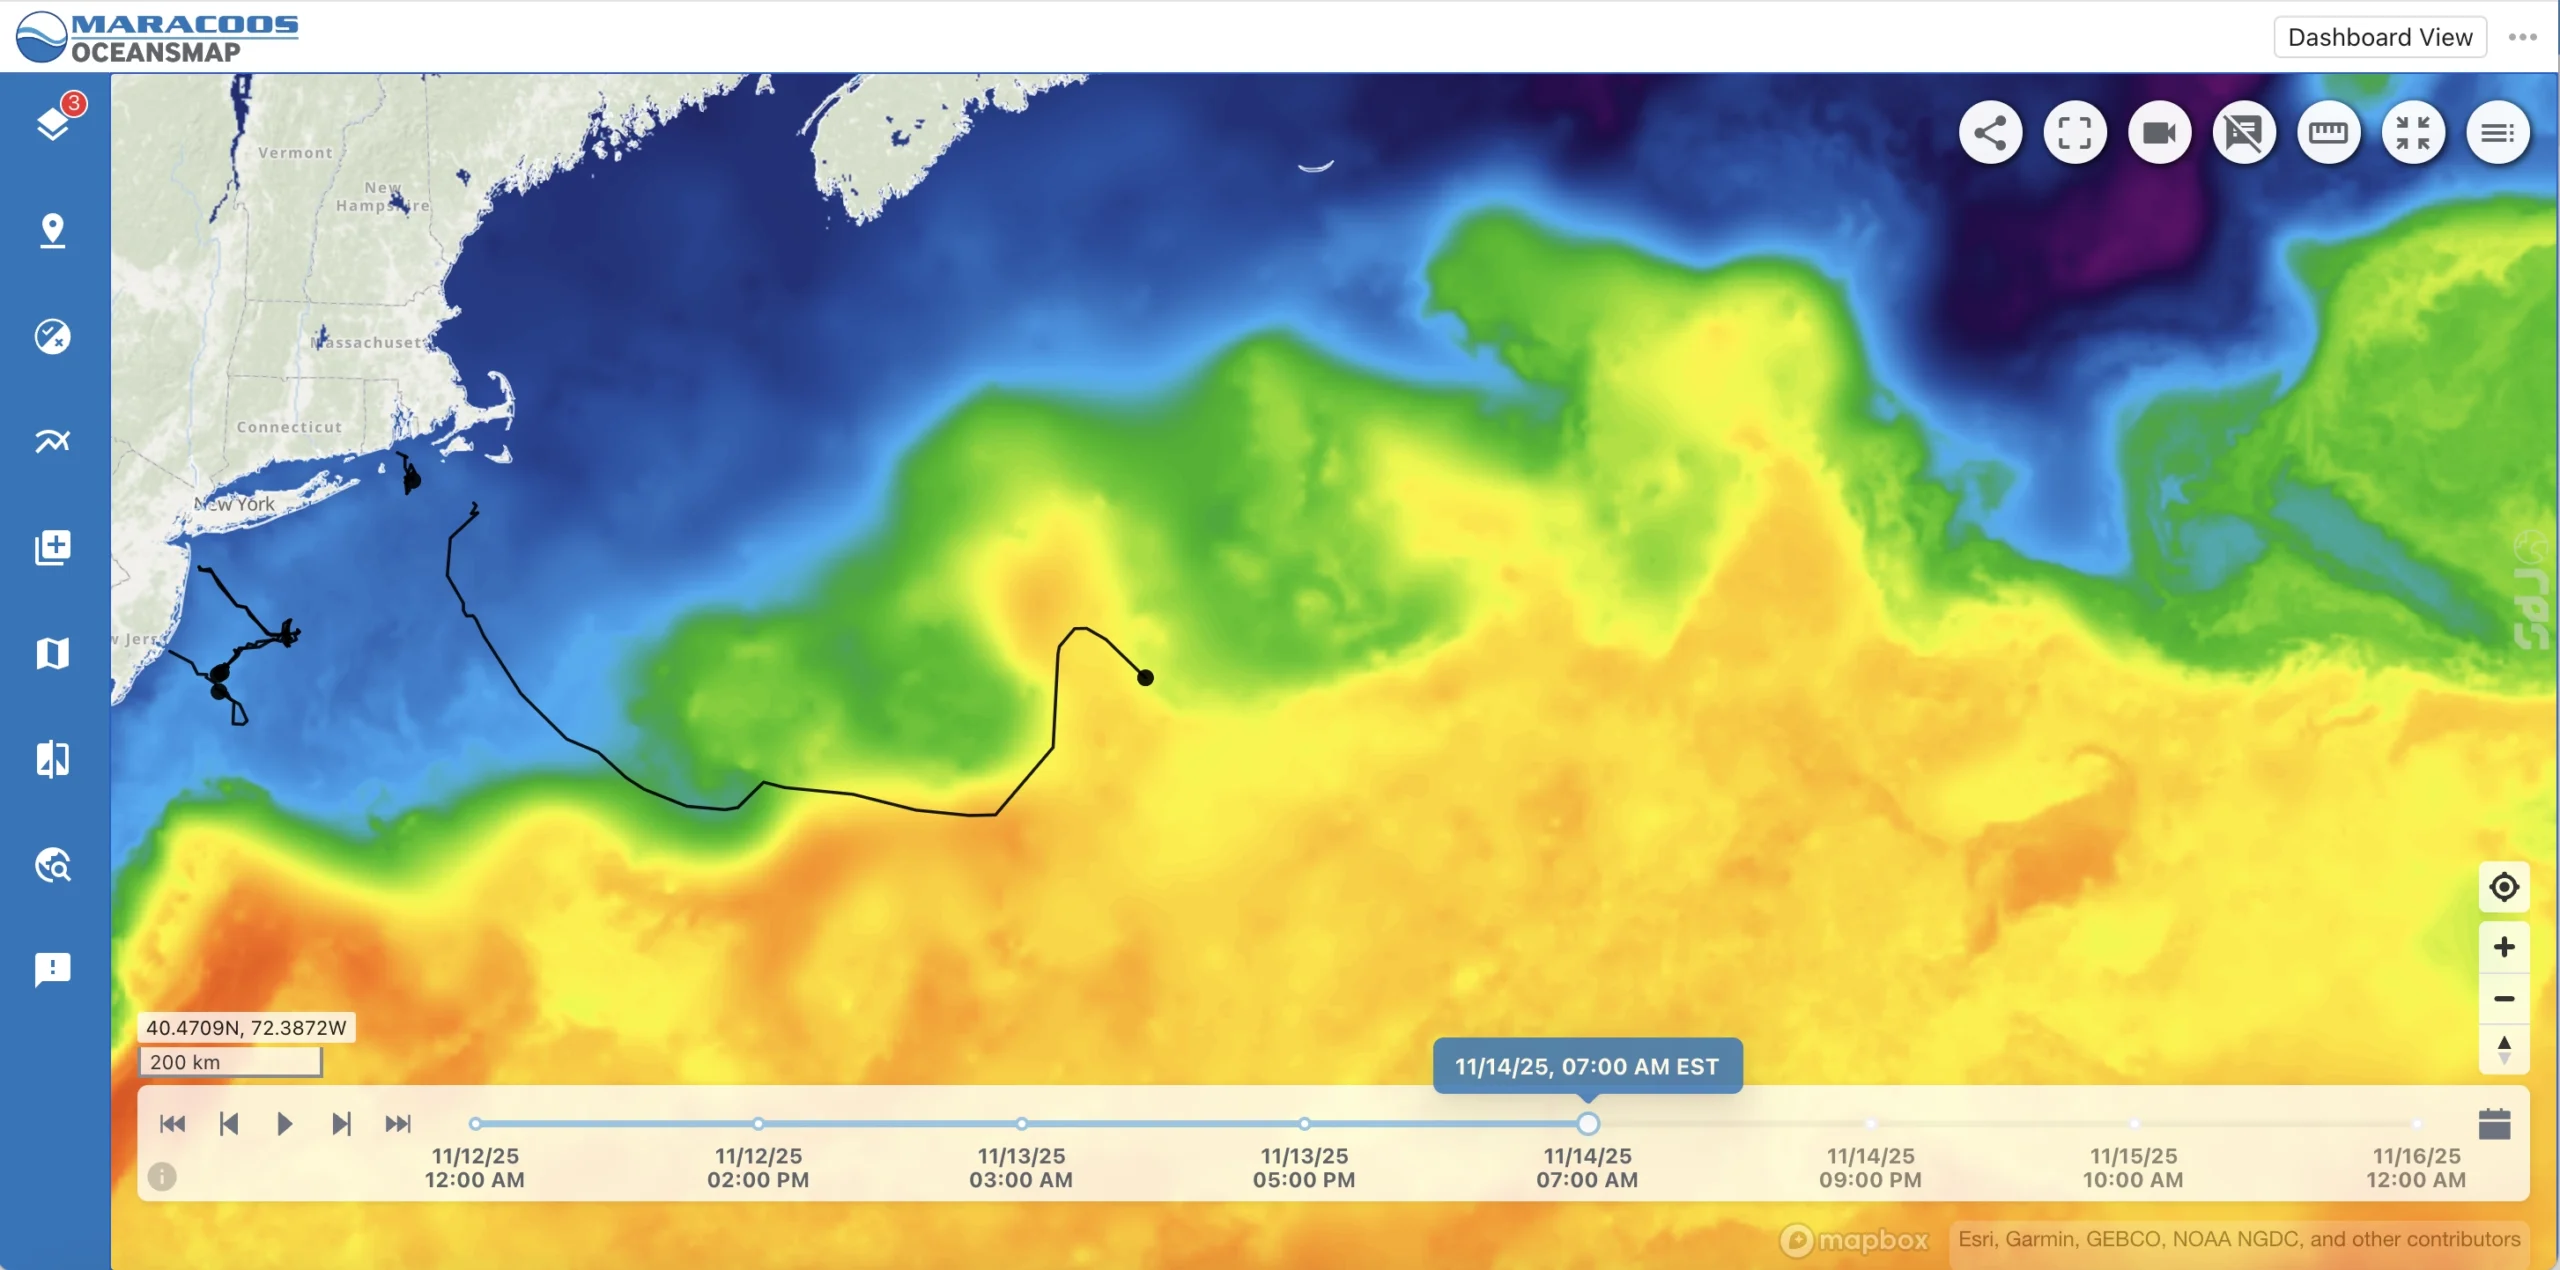
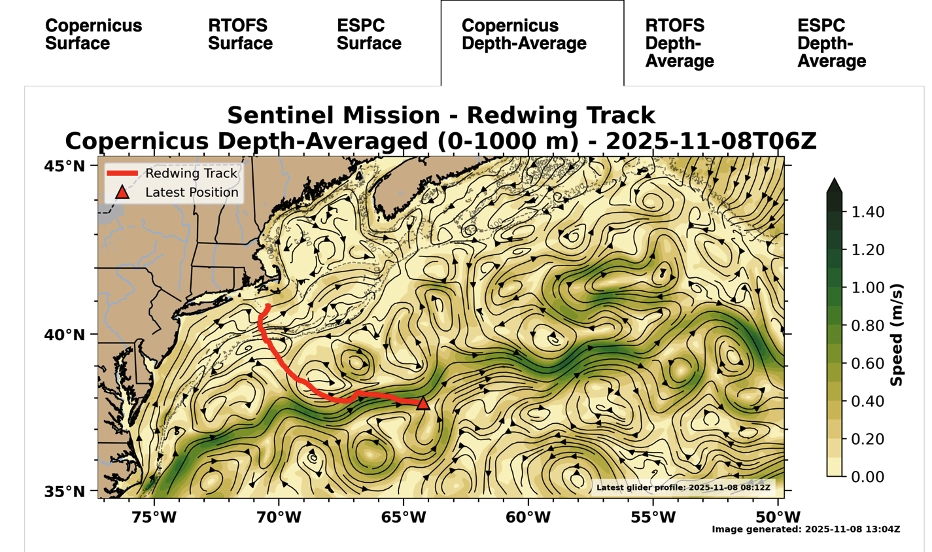
Looking at the model forecasts of depth averaged currents, the choice is between ESPC (Figure 1) and Copernicus (Figure 2).
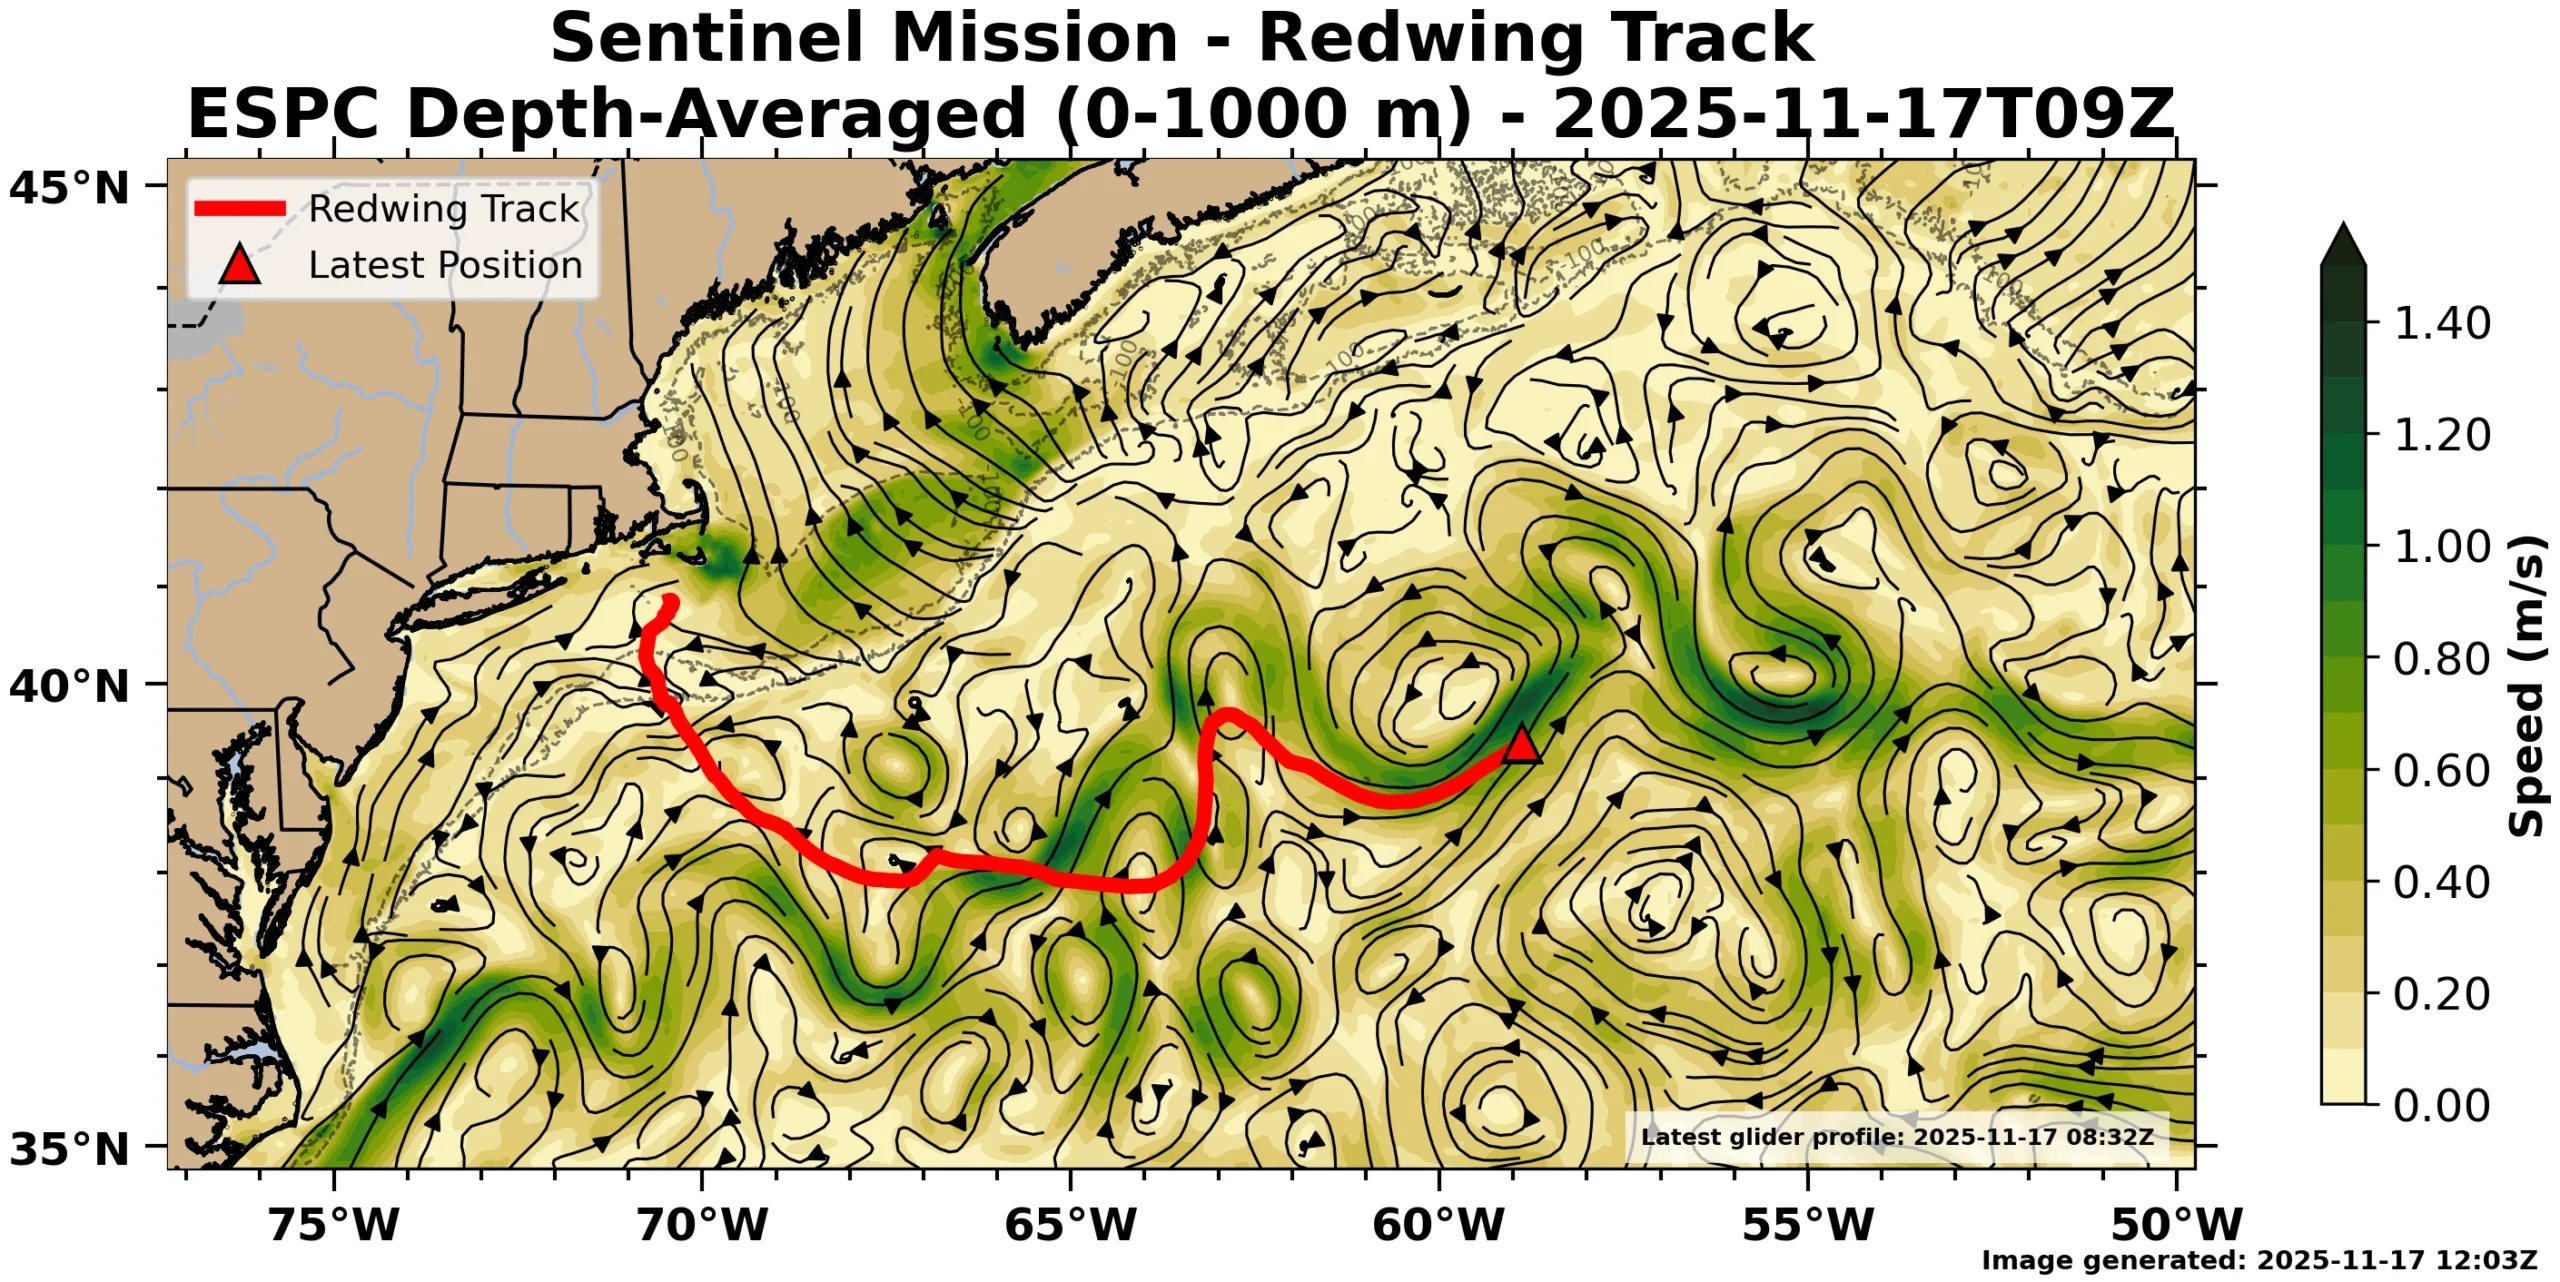
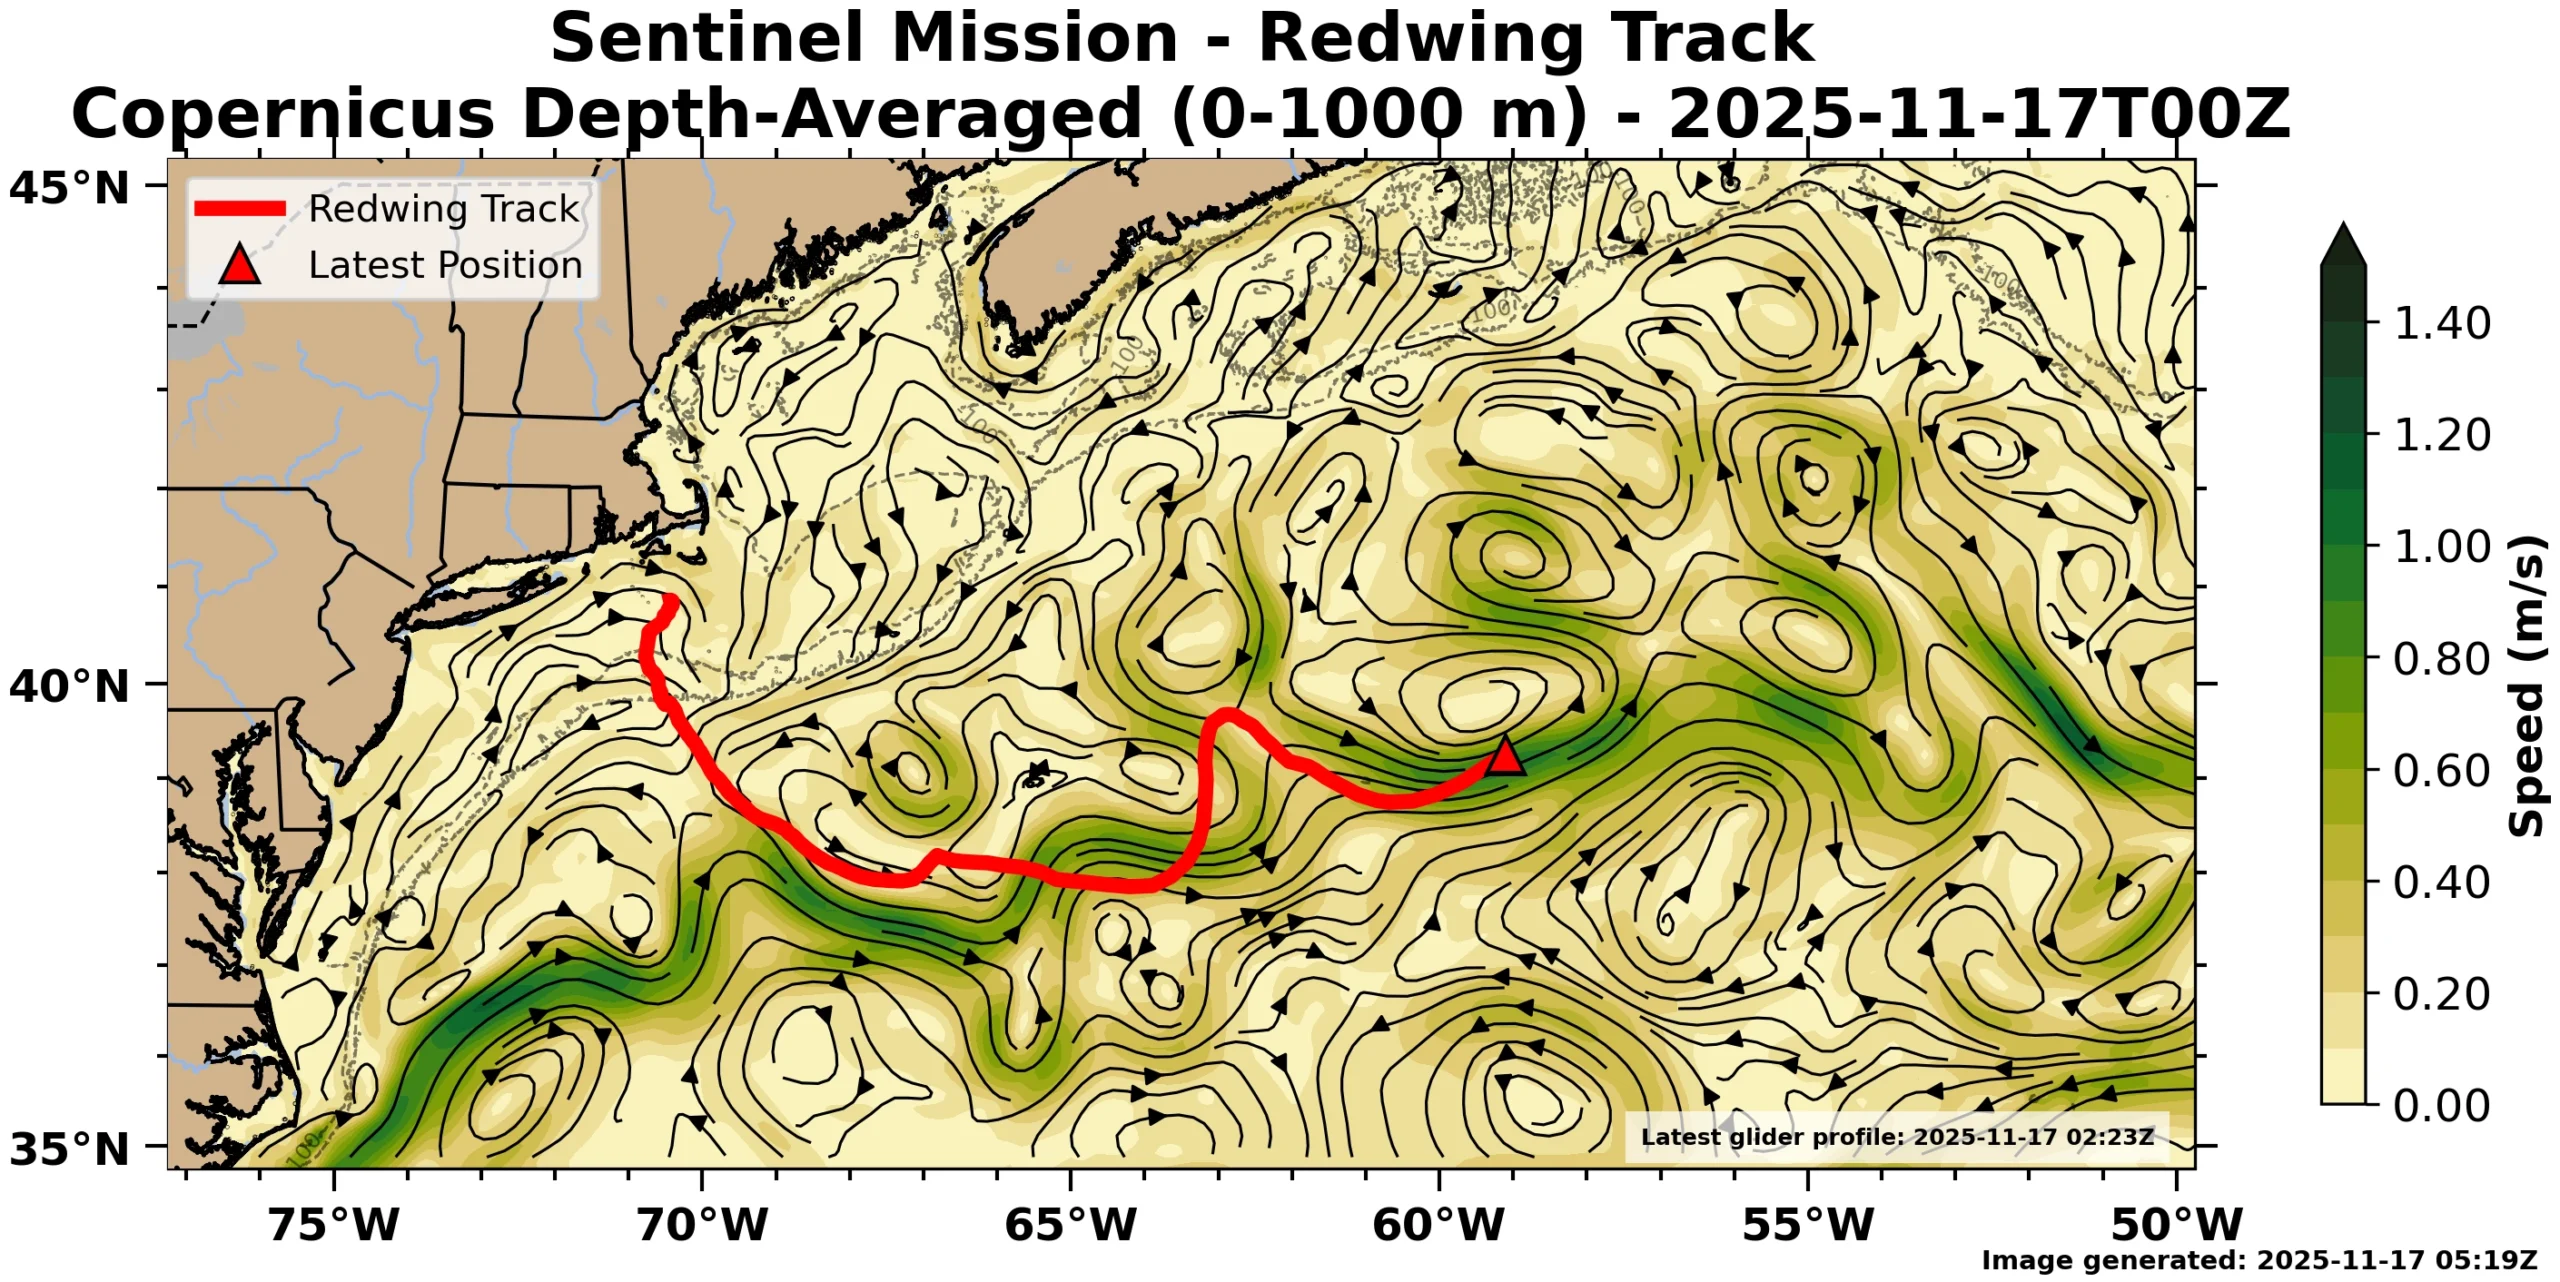
Both of these models say Redwing is in the Gulf Stream and the Stream is heading to the northeast.
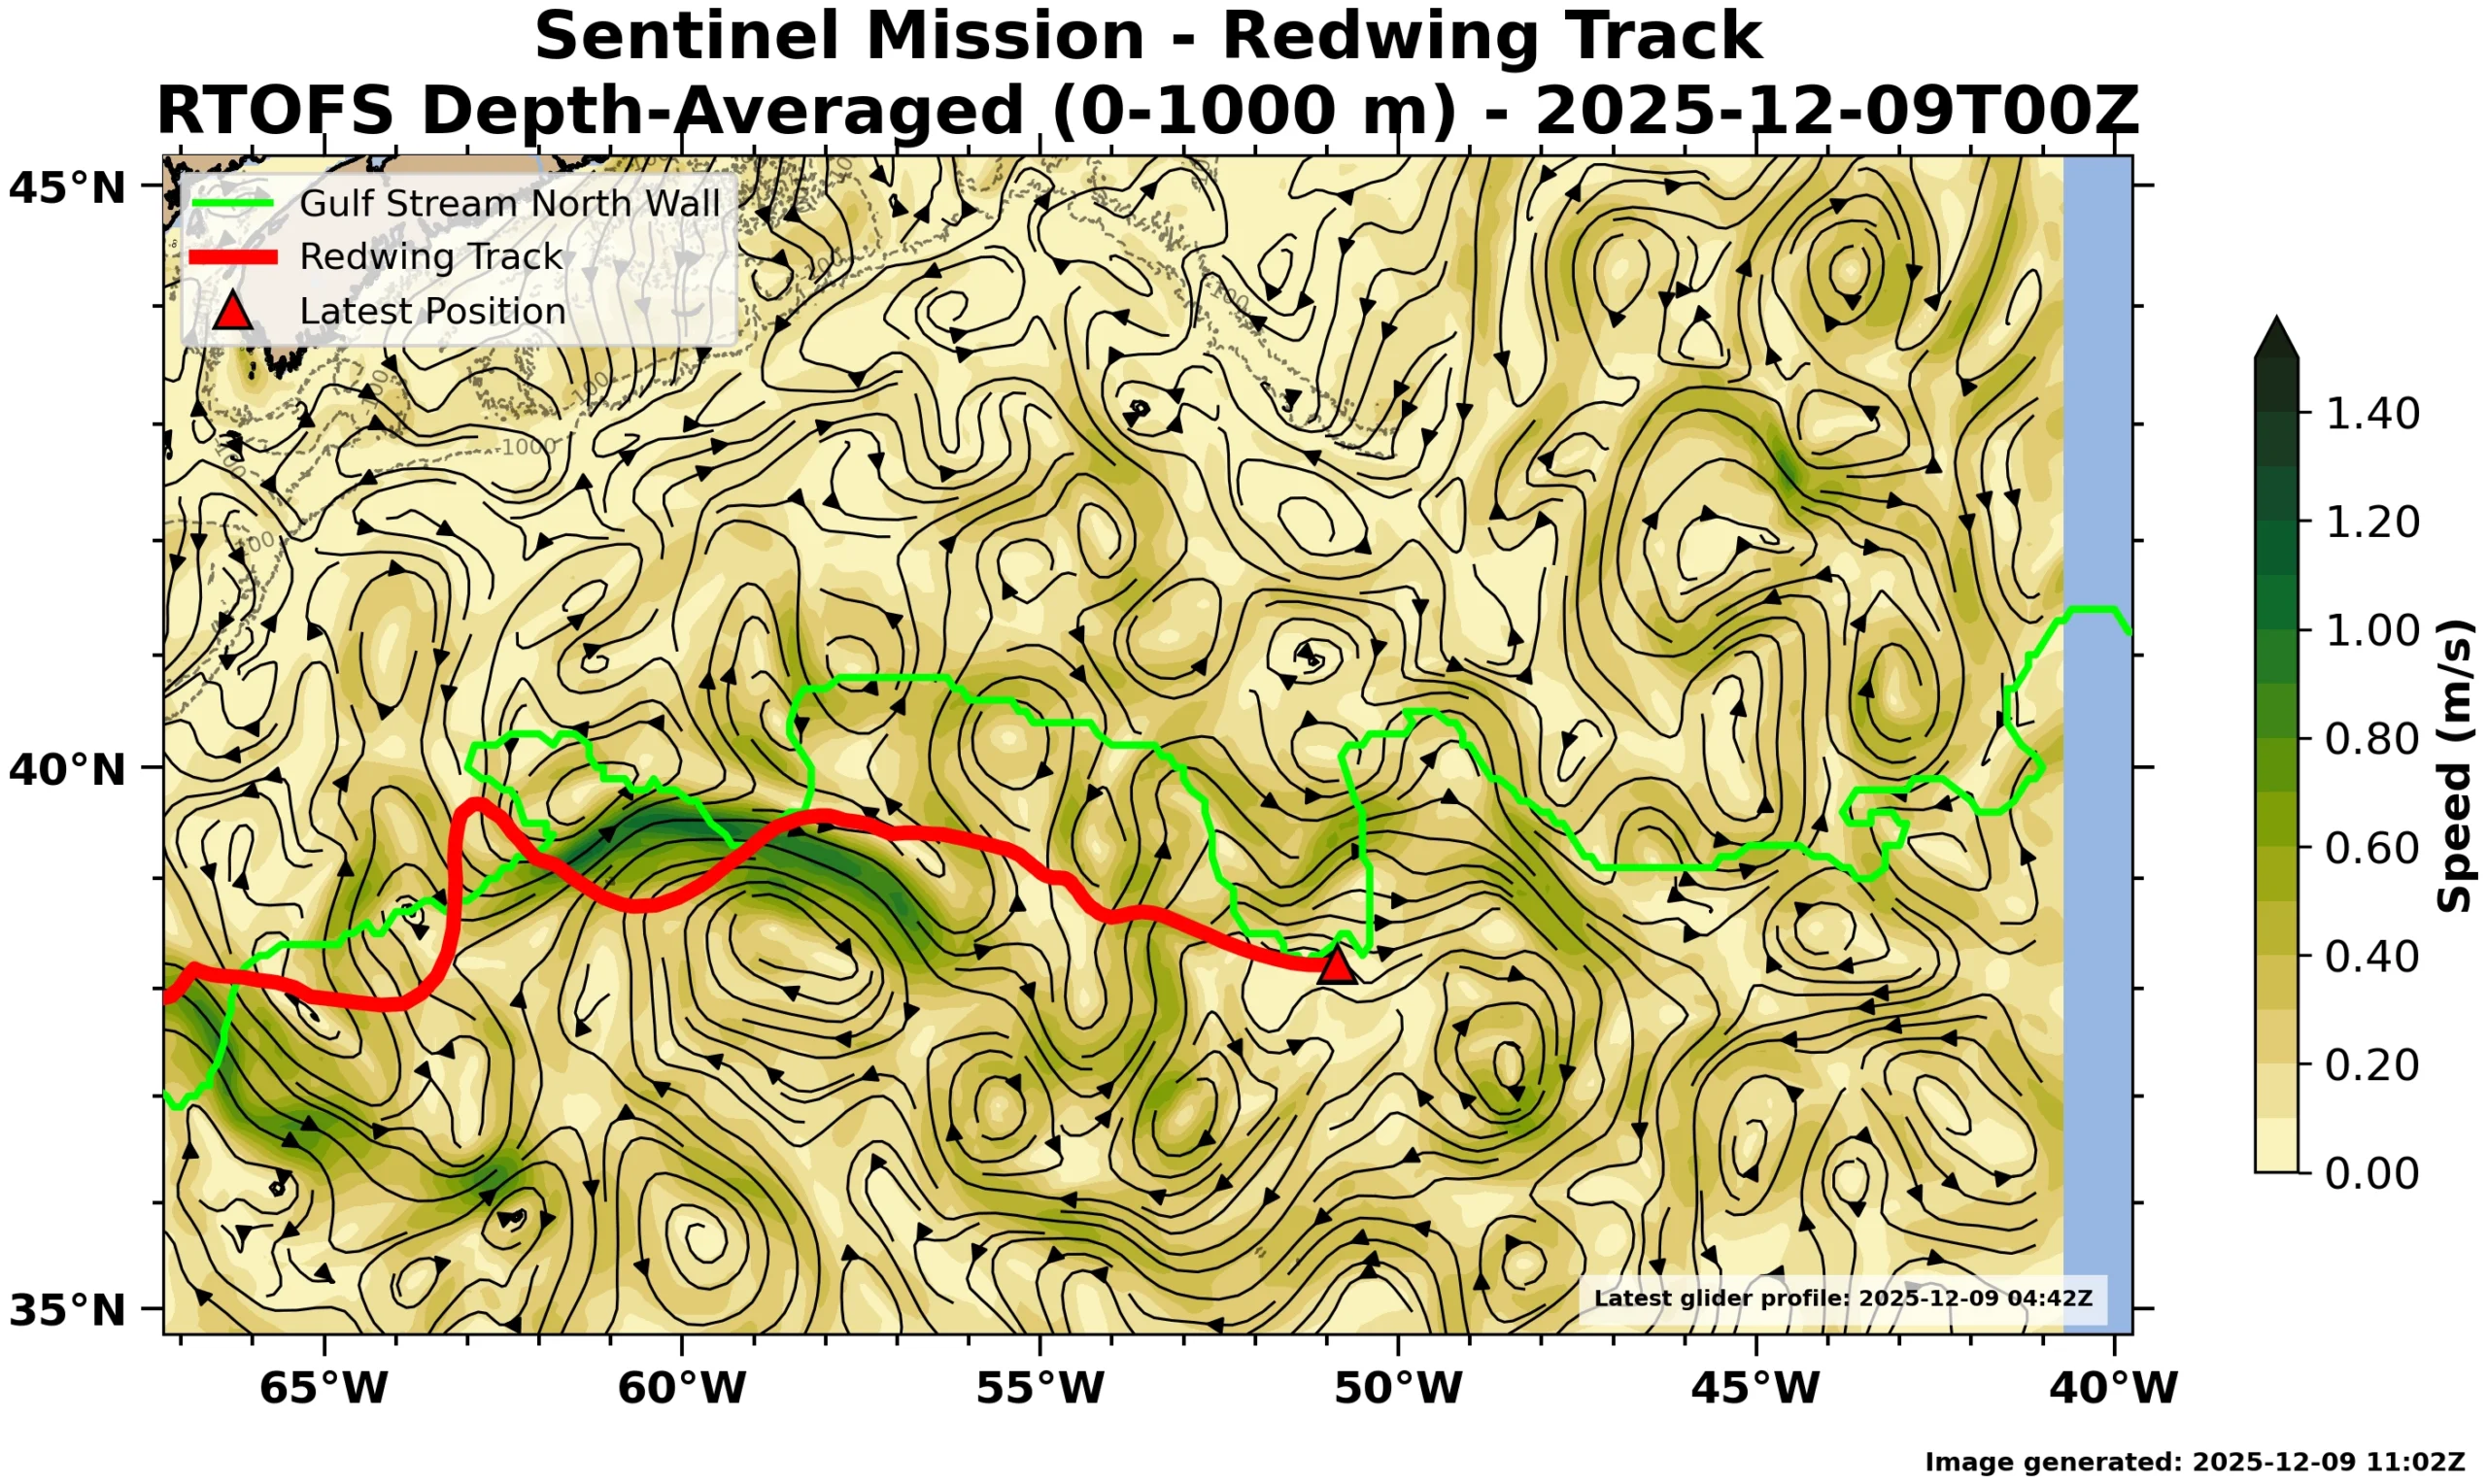
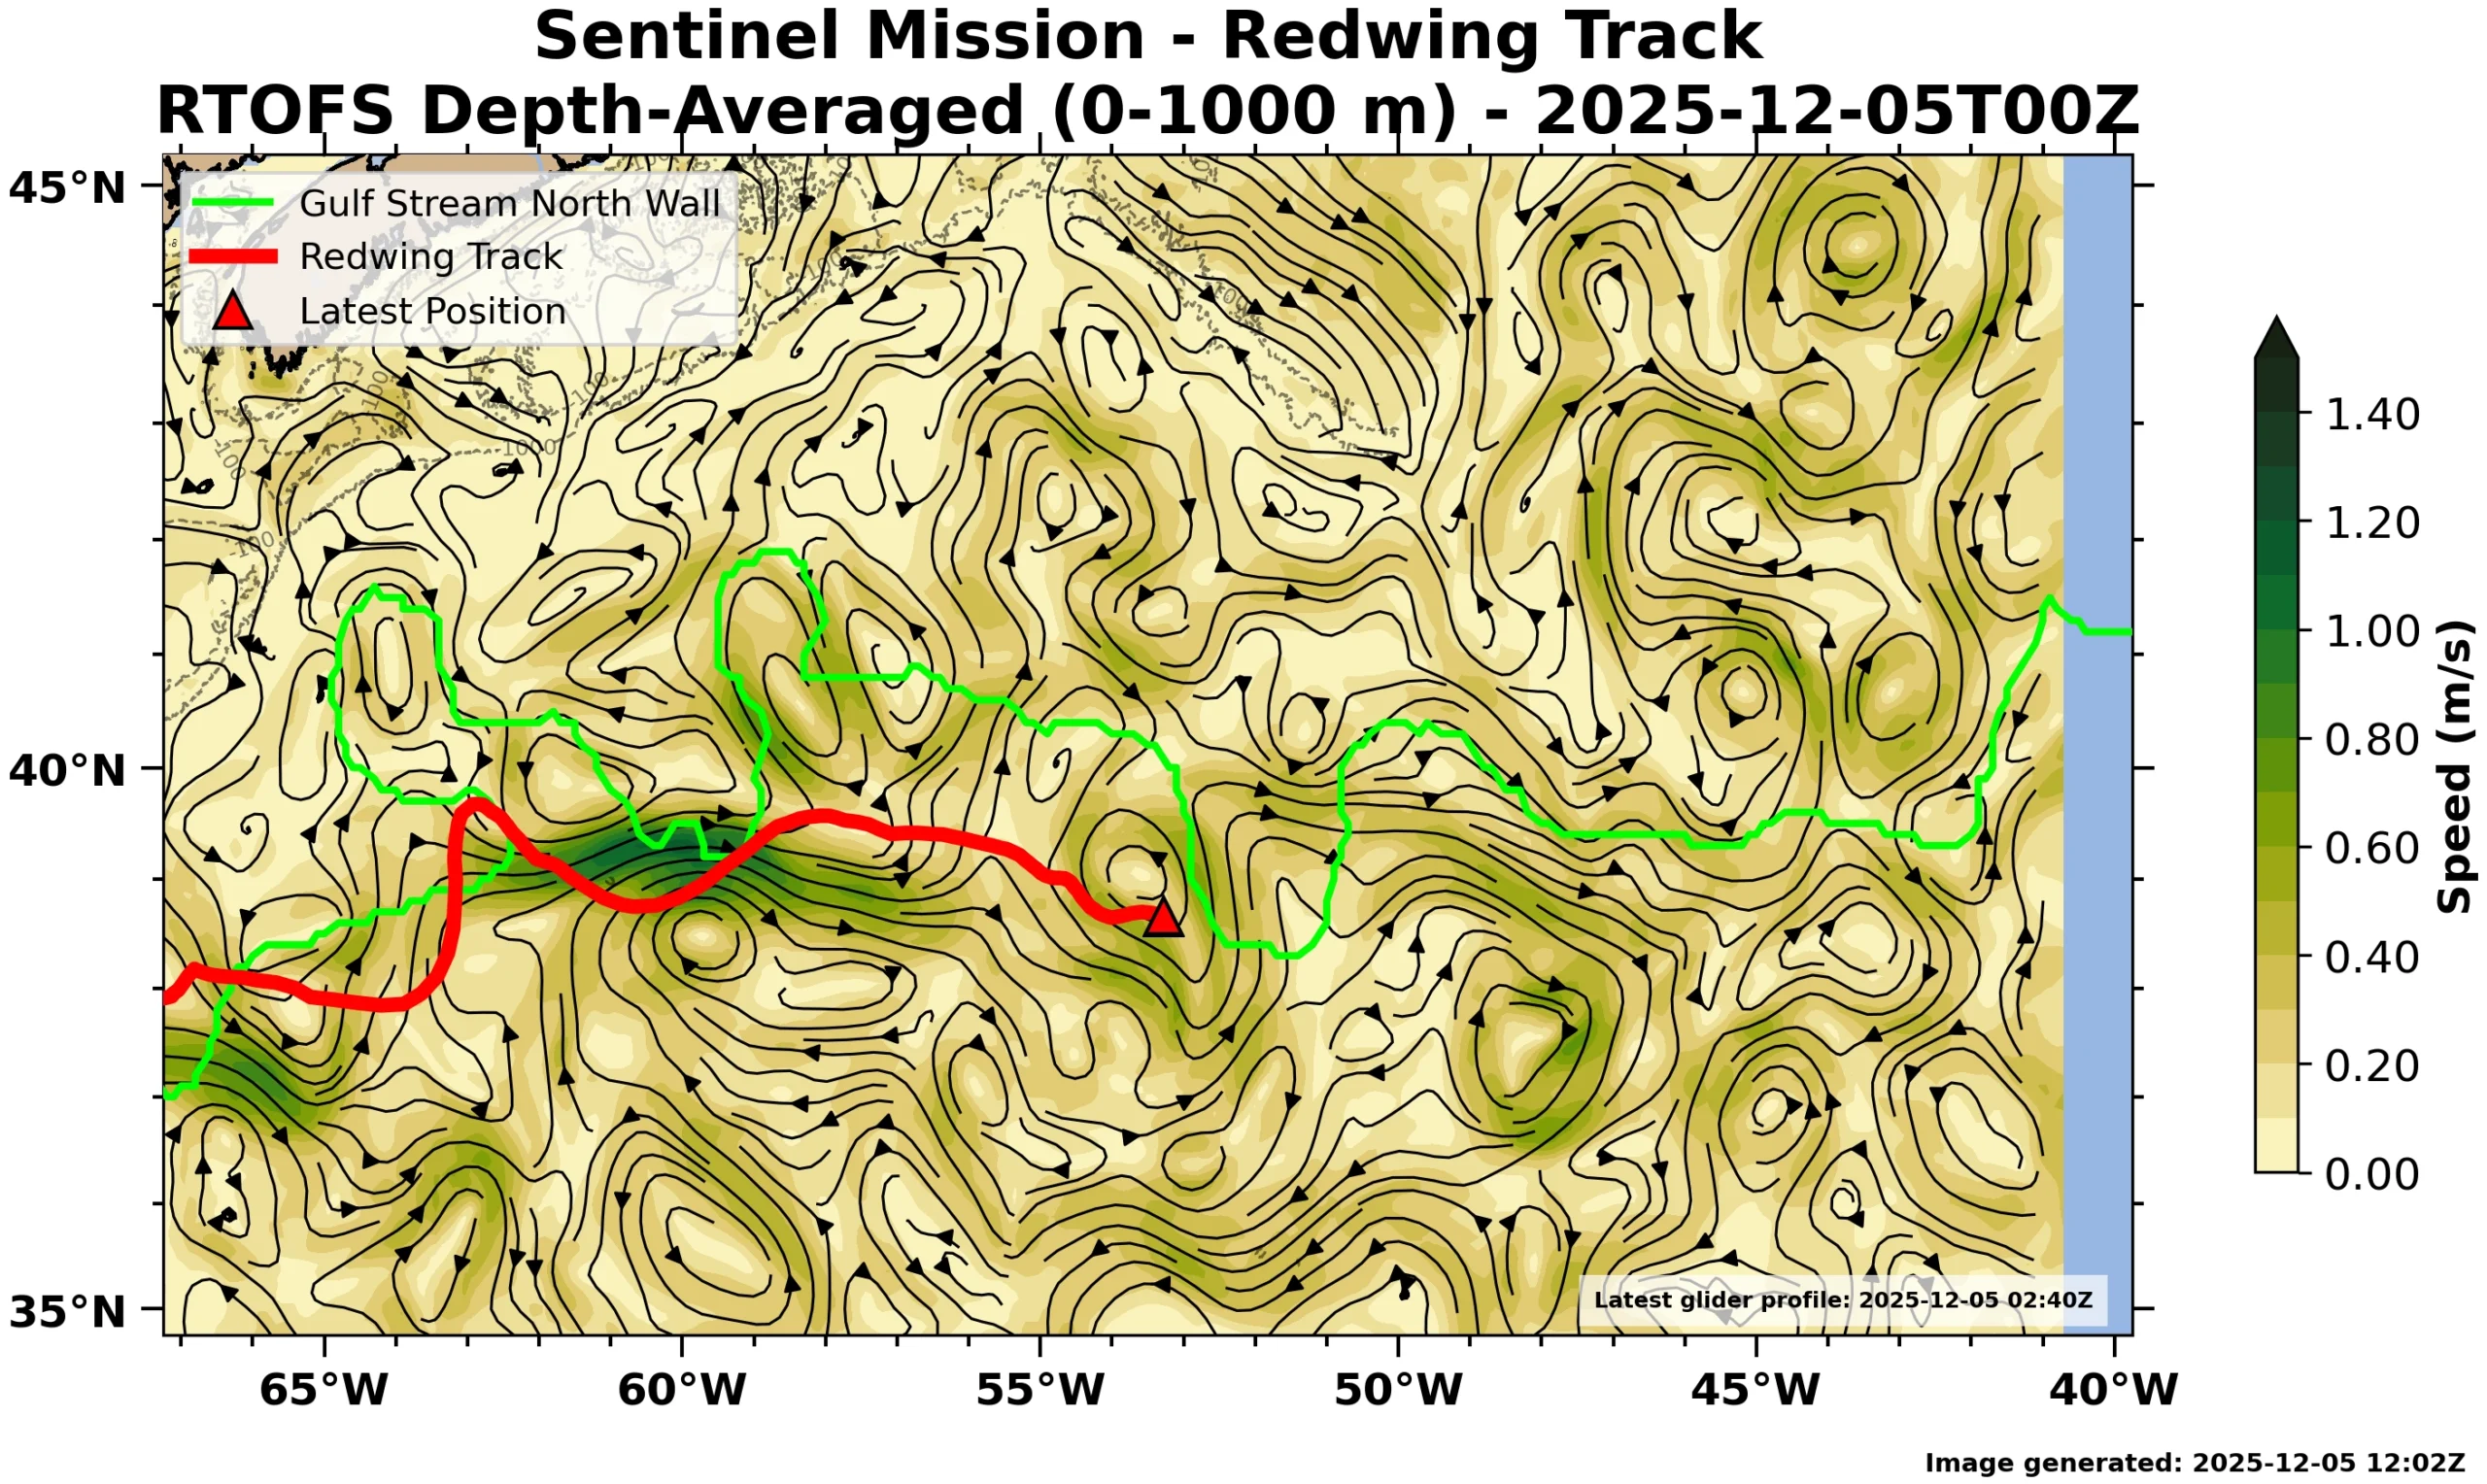
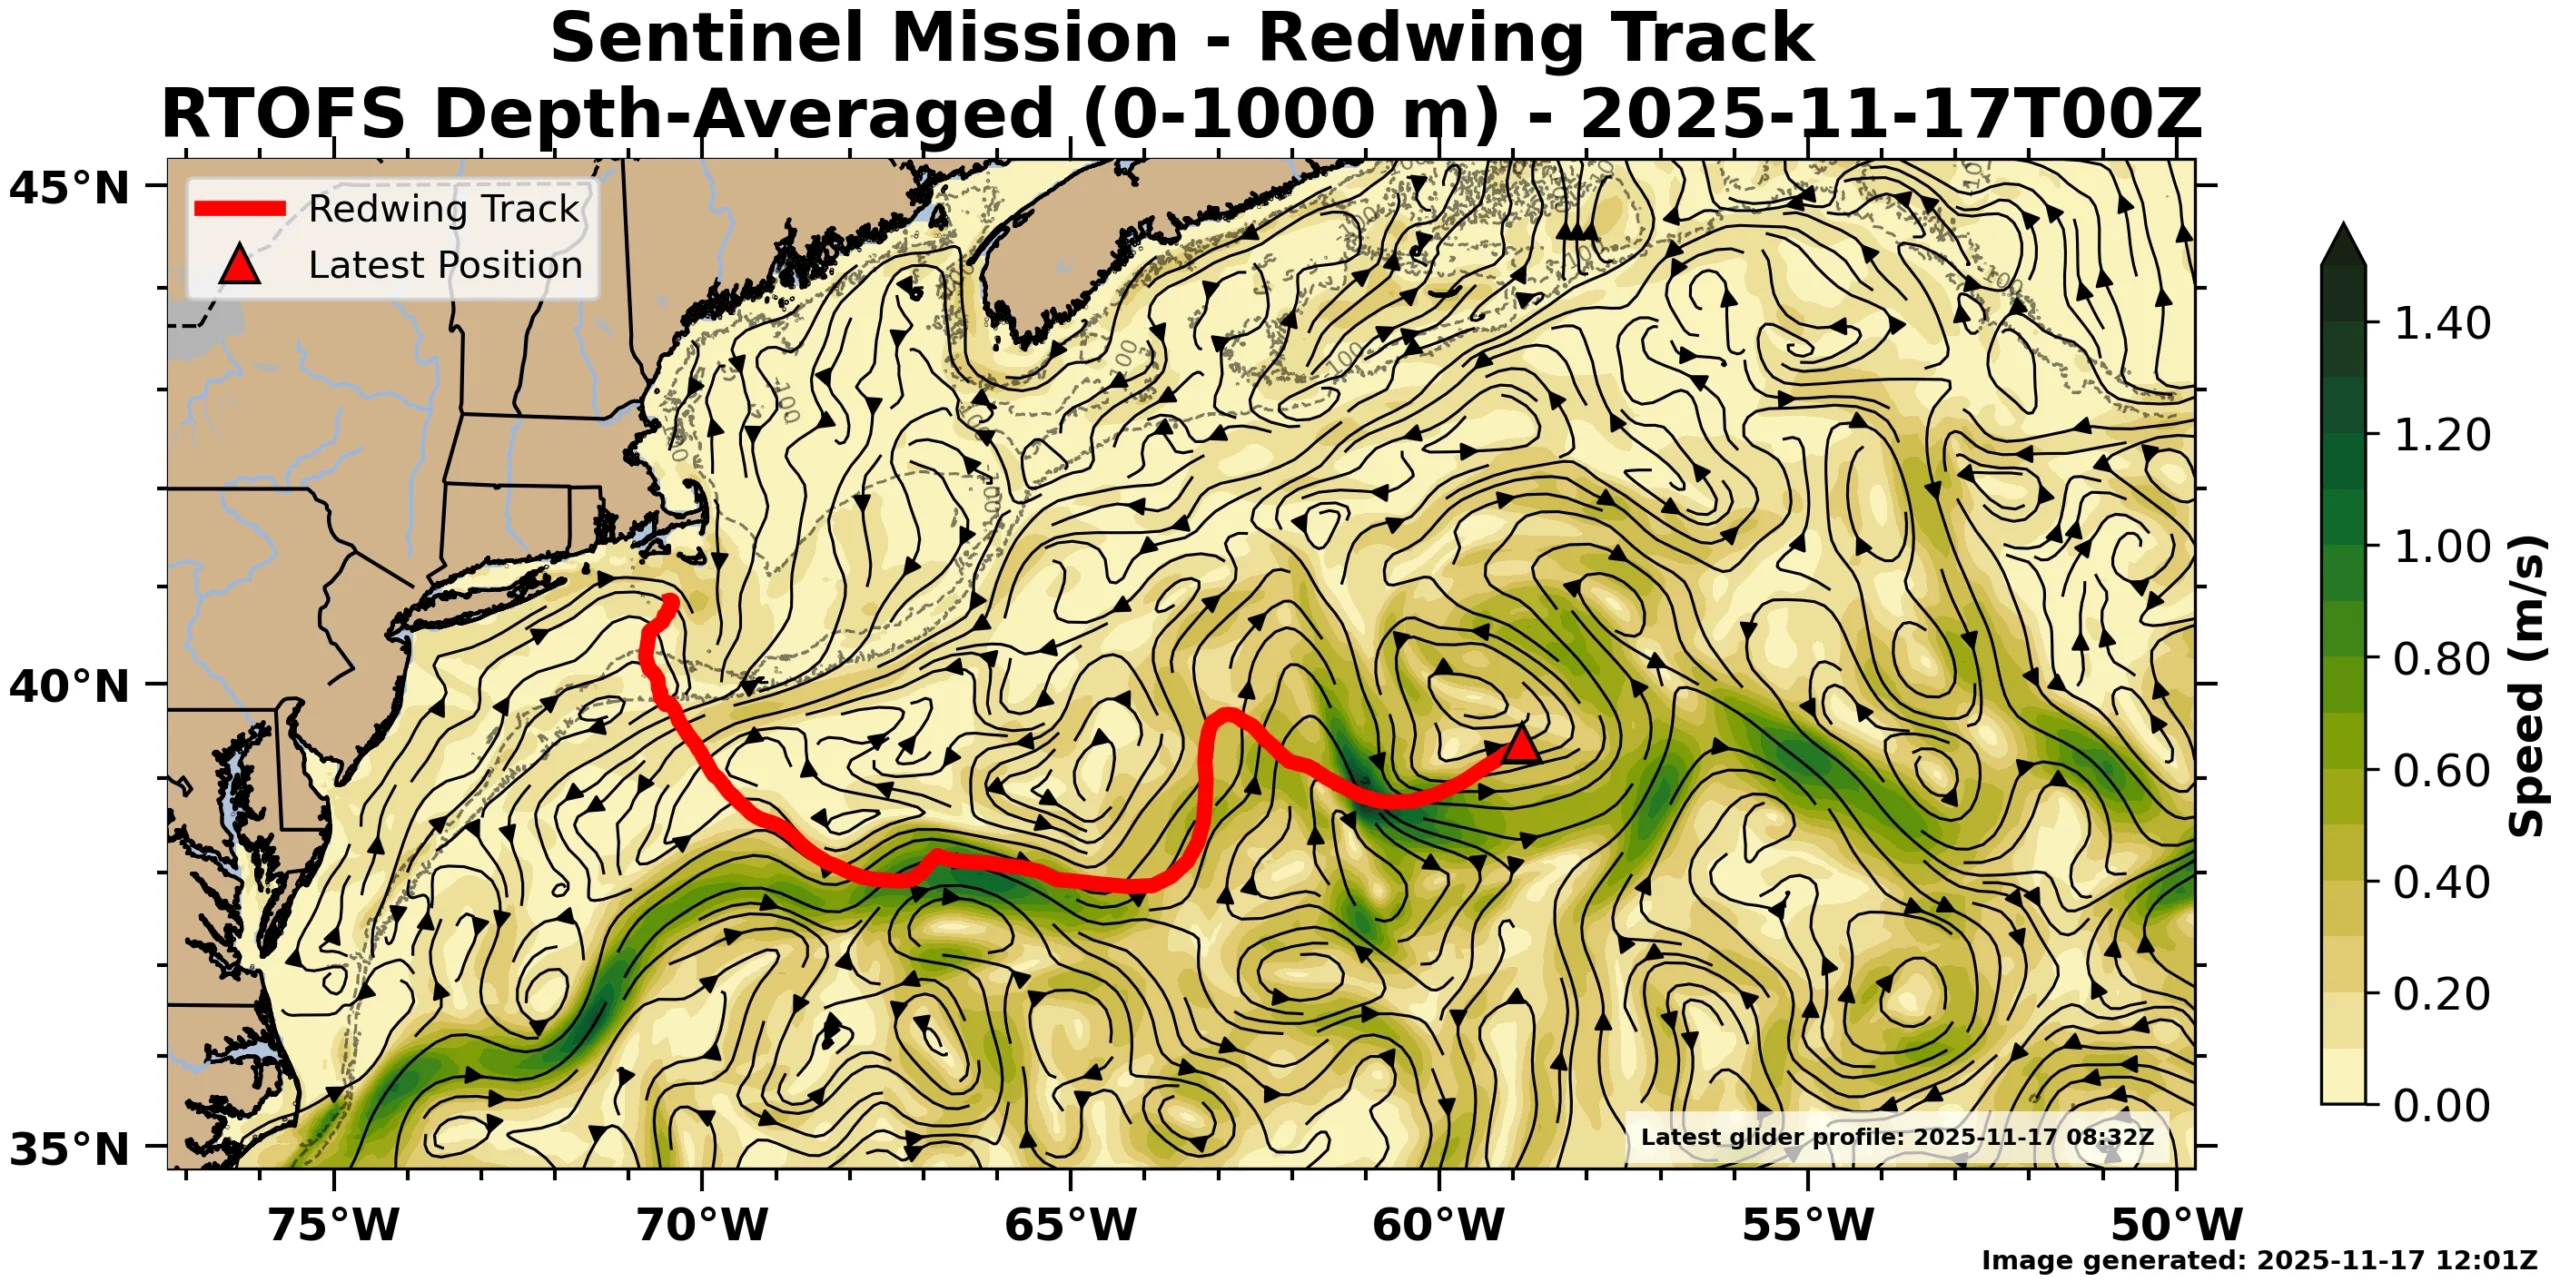
RTOFS (Figure 3) has Redwing north of the Stream, and the Stream flowing almost straight east.
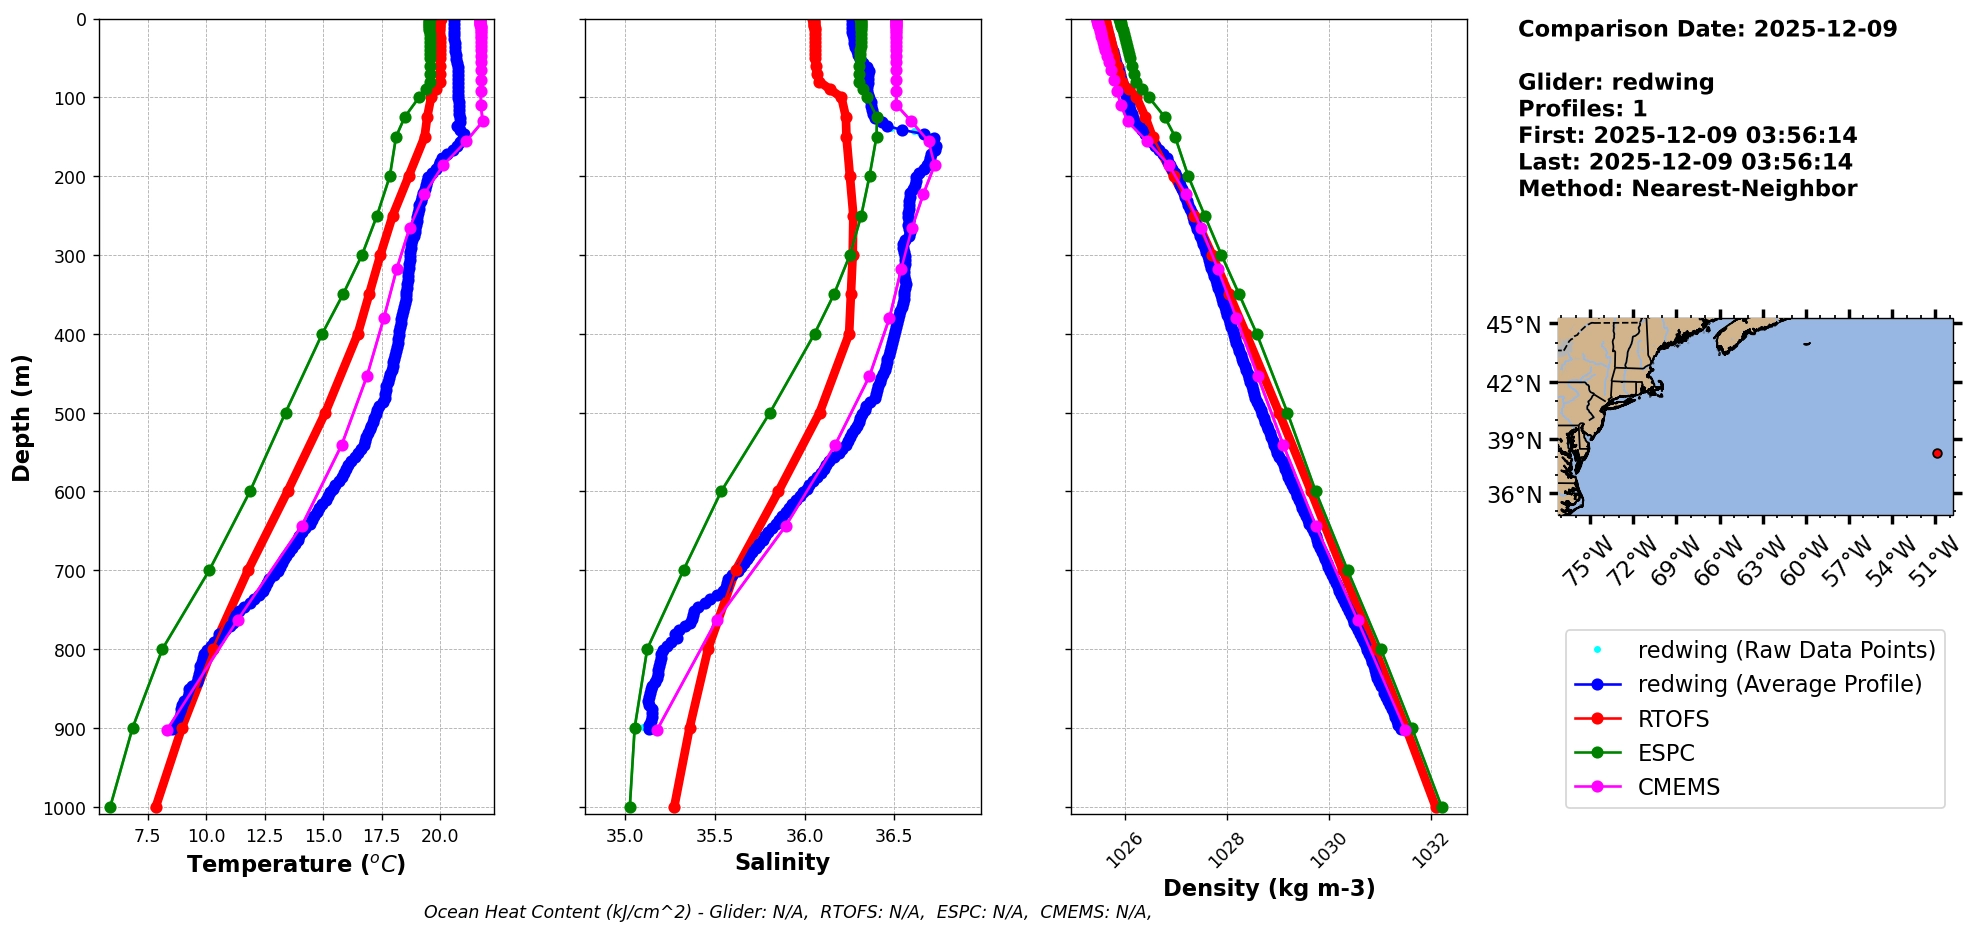
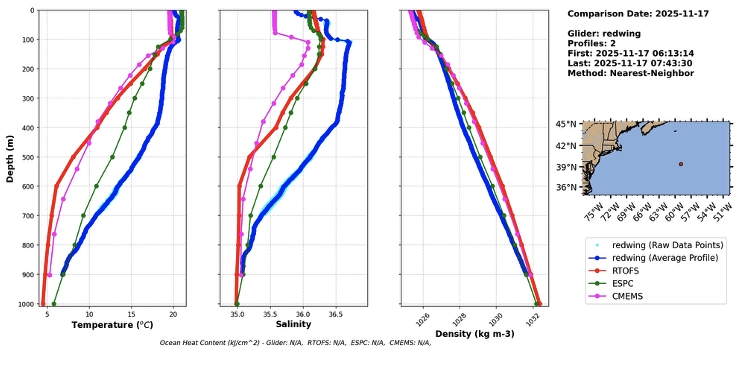
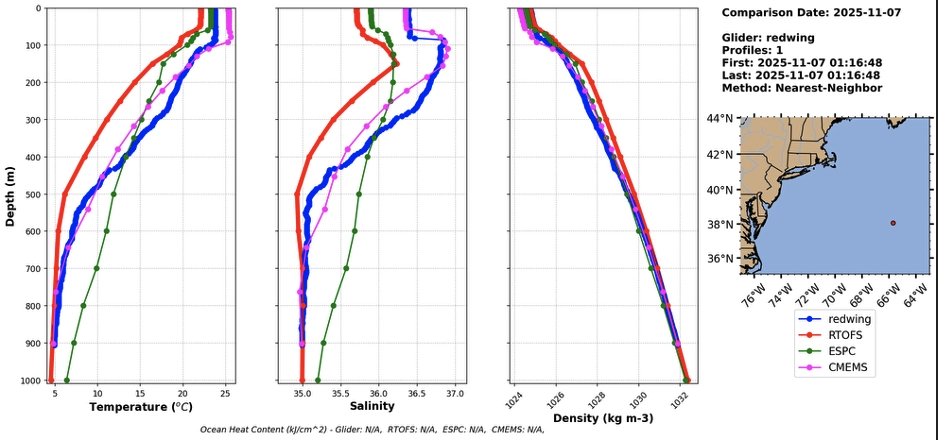
The Temperature and Salinity profiles reported by Redwing and compared to the models are shown in Figure 4.
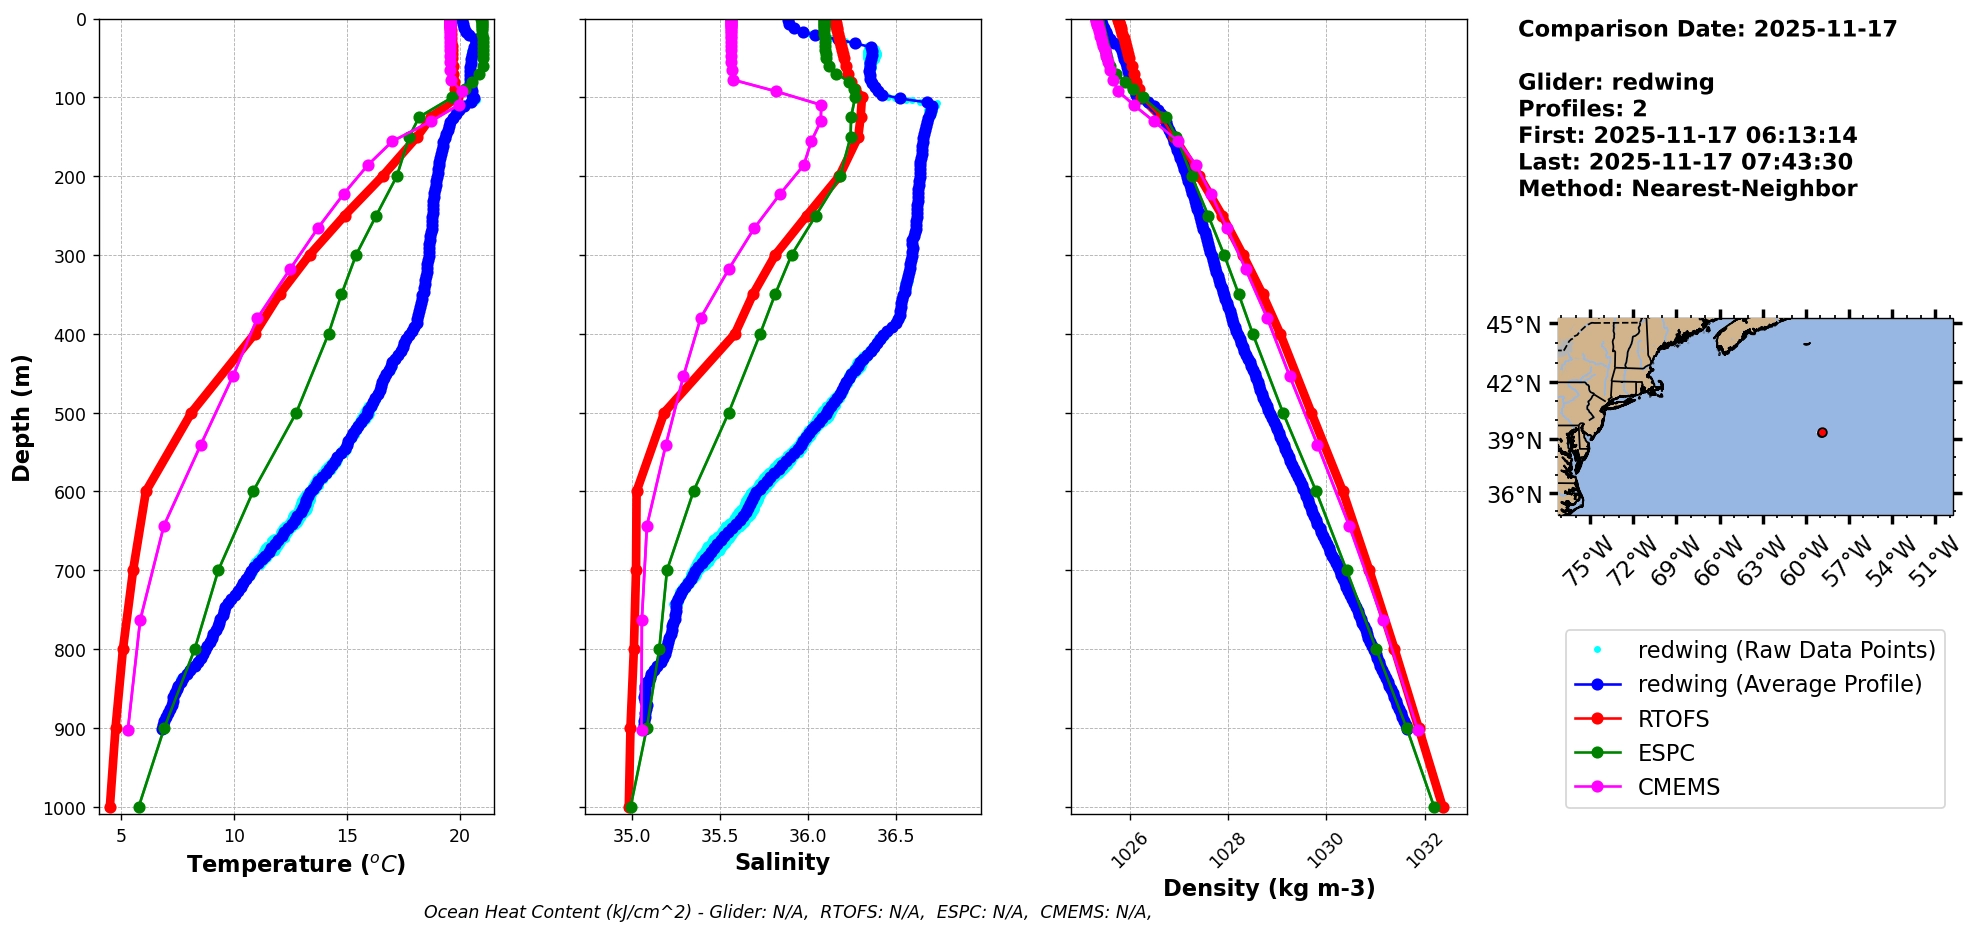
Looking between the depths of 100 m and 400 m, Redwing is seeing warm (about 18C) and salty (over 36.5) water that indicates it is in the Gulf Stream, or south of the Gulf Stream, bit not north.
Looking downstream in ESPC and Copernicus, bot models have a clockwise circulation on the southern side of the Stream that works towards Redwing’s goal of heading easy. On the north side of the Stream, both models have an interaction of a Gulf Stream meander crest with a clockwise circulating Warm Core Ring. ESPC tends to evolve rapidly and favor strong interactions and it is forecasting a strong interaction with the Warm Core Ring. CMEMS tends to be a slower evolved and tends to favor weaker interactions, and that is also the case today. Both models are staying true to their character. Which one is right is unknown. Putting a glider into the region of uncertainty tends to bring the two models closer together, but in our case, the Warm Core Ring interaction zone is highly unfavorable for Redwing’s current goal of flying east. Compared to the very favorable environment we see on the southern side of the Gulf Stream, seems like it is best to favor the southern side of the Stream as we approach this meander crest near 57W.
Thanks all,
Scott
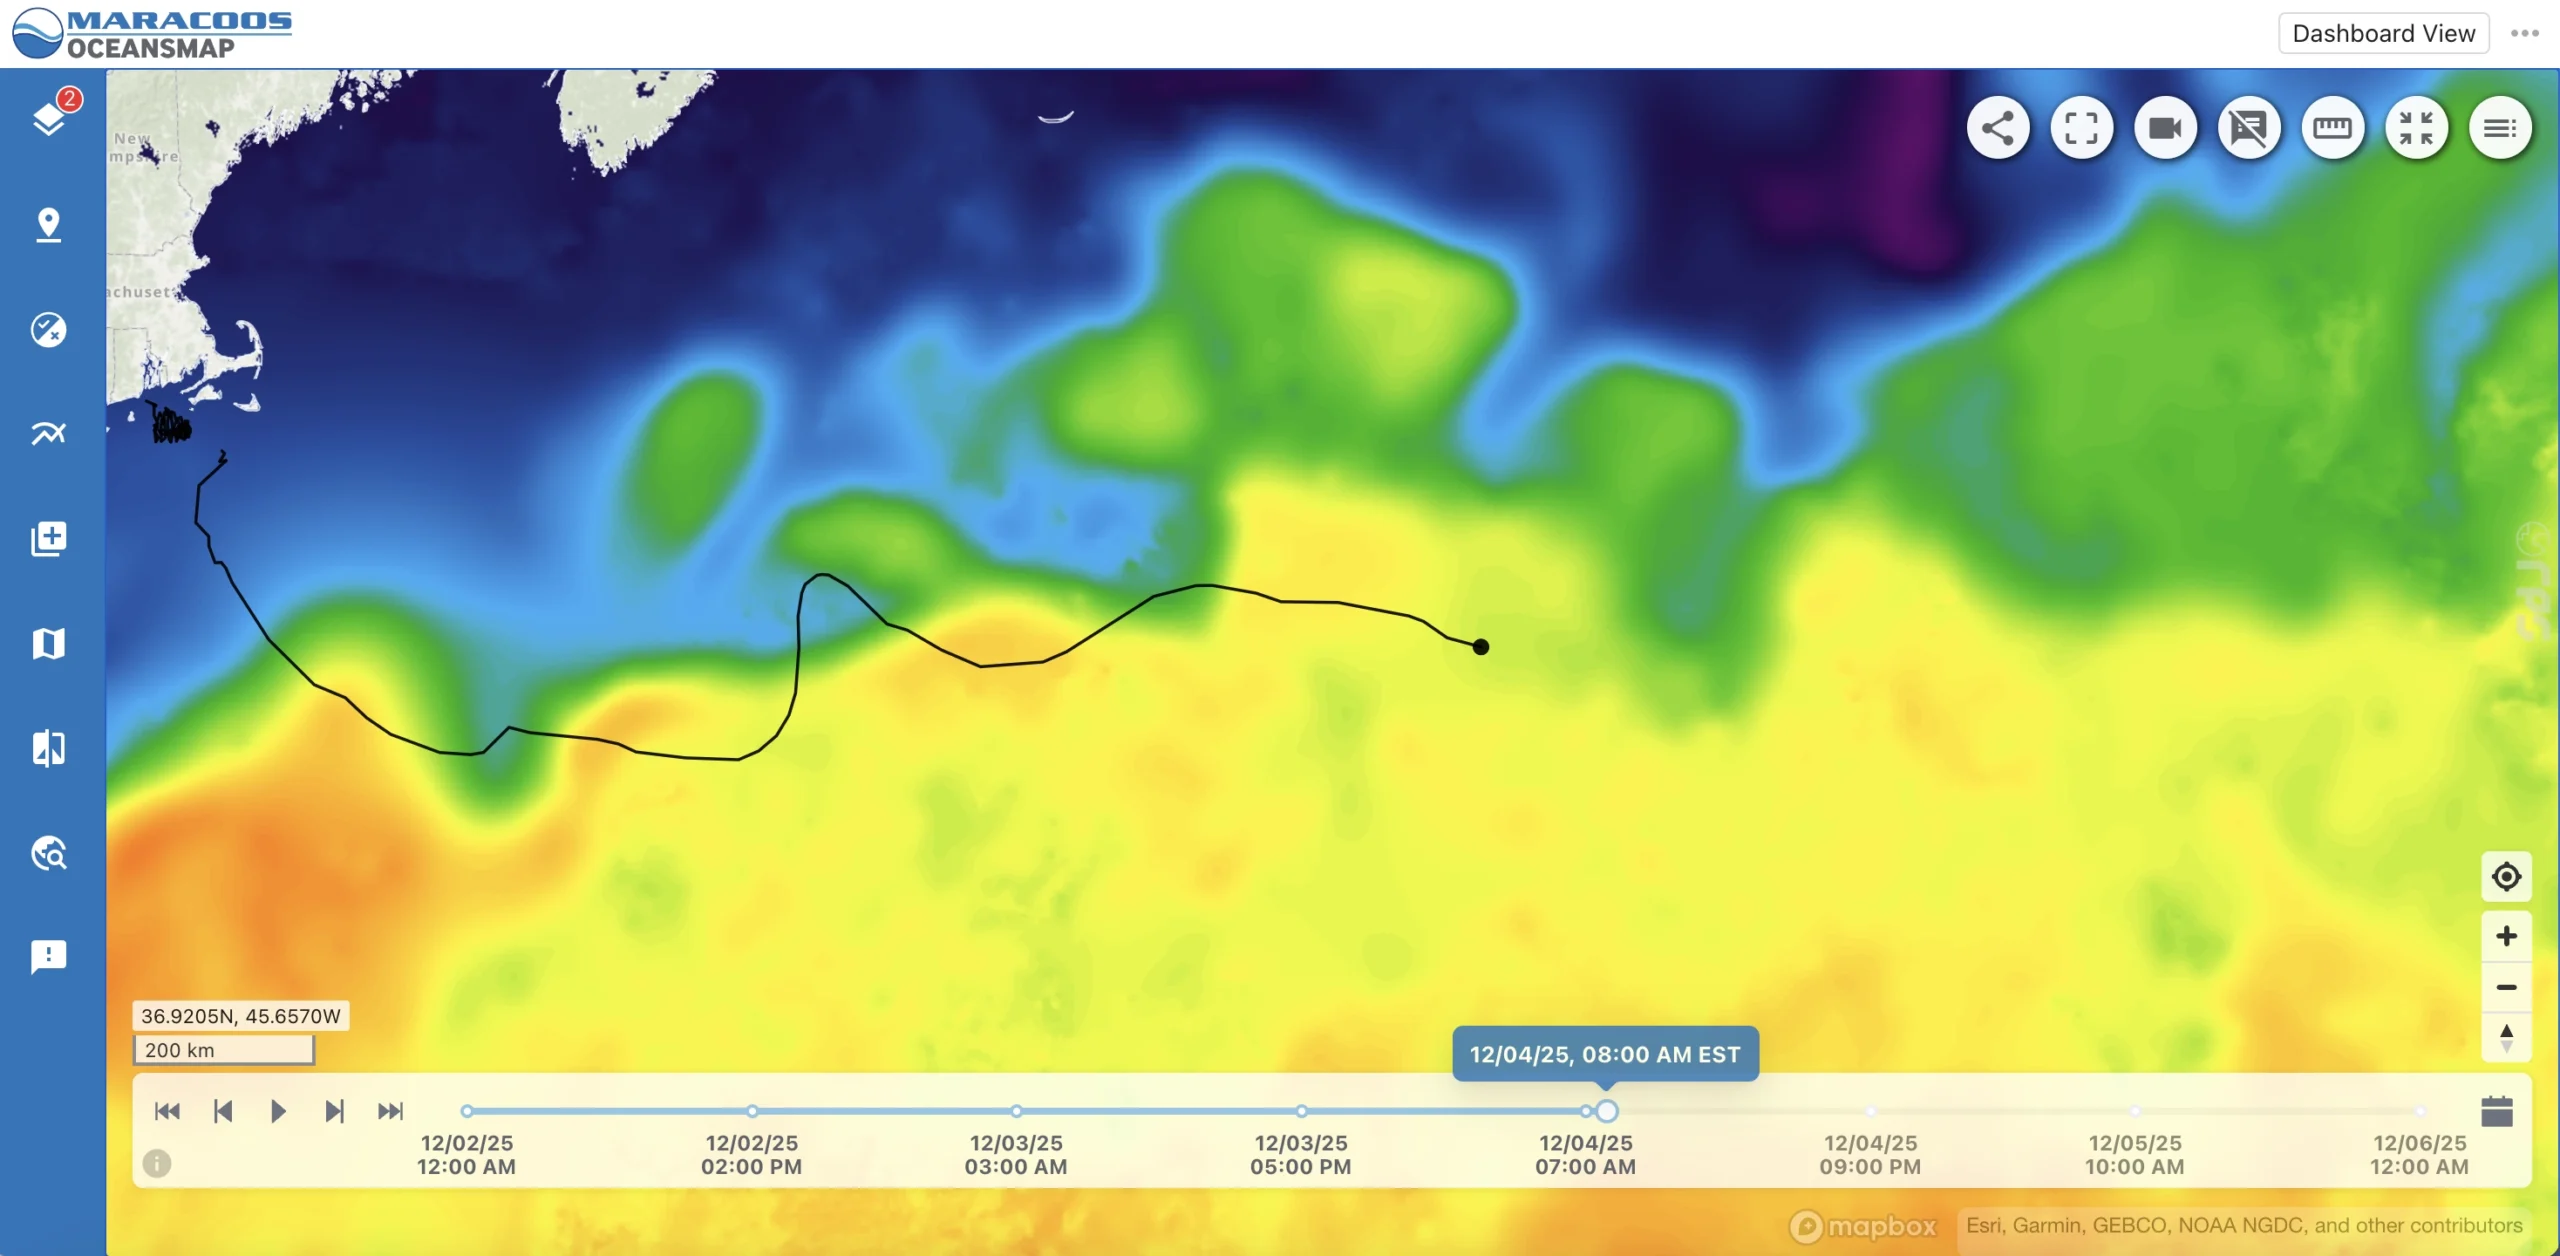
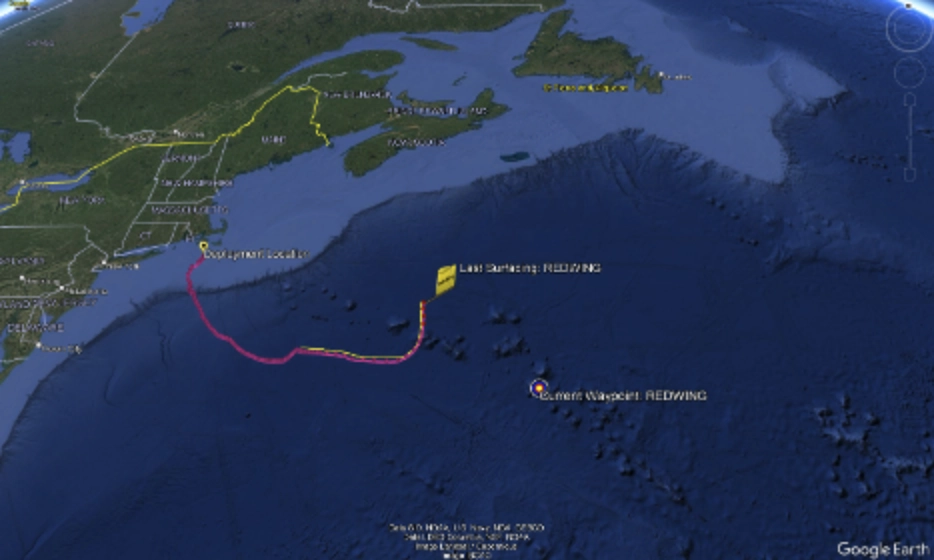
Good news from Redwing as of this morning!
Overnight, she has shown great progress in driving herself back towards the Gulf Stream. We seem to be in the heart of that null-current zone between the boundary of the Gulf Stream and what’s left of the warm core eddy to our North.
sensor:m_water_vx(m/s)=-0.036965715199025 382.14 secs ago
sensor:m_water_vy(m/s)=0.064178300048538 382.143 secs ago
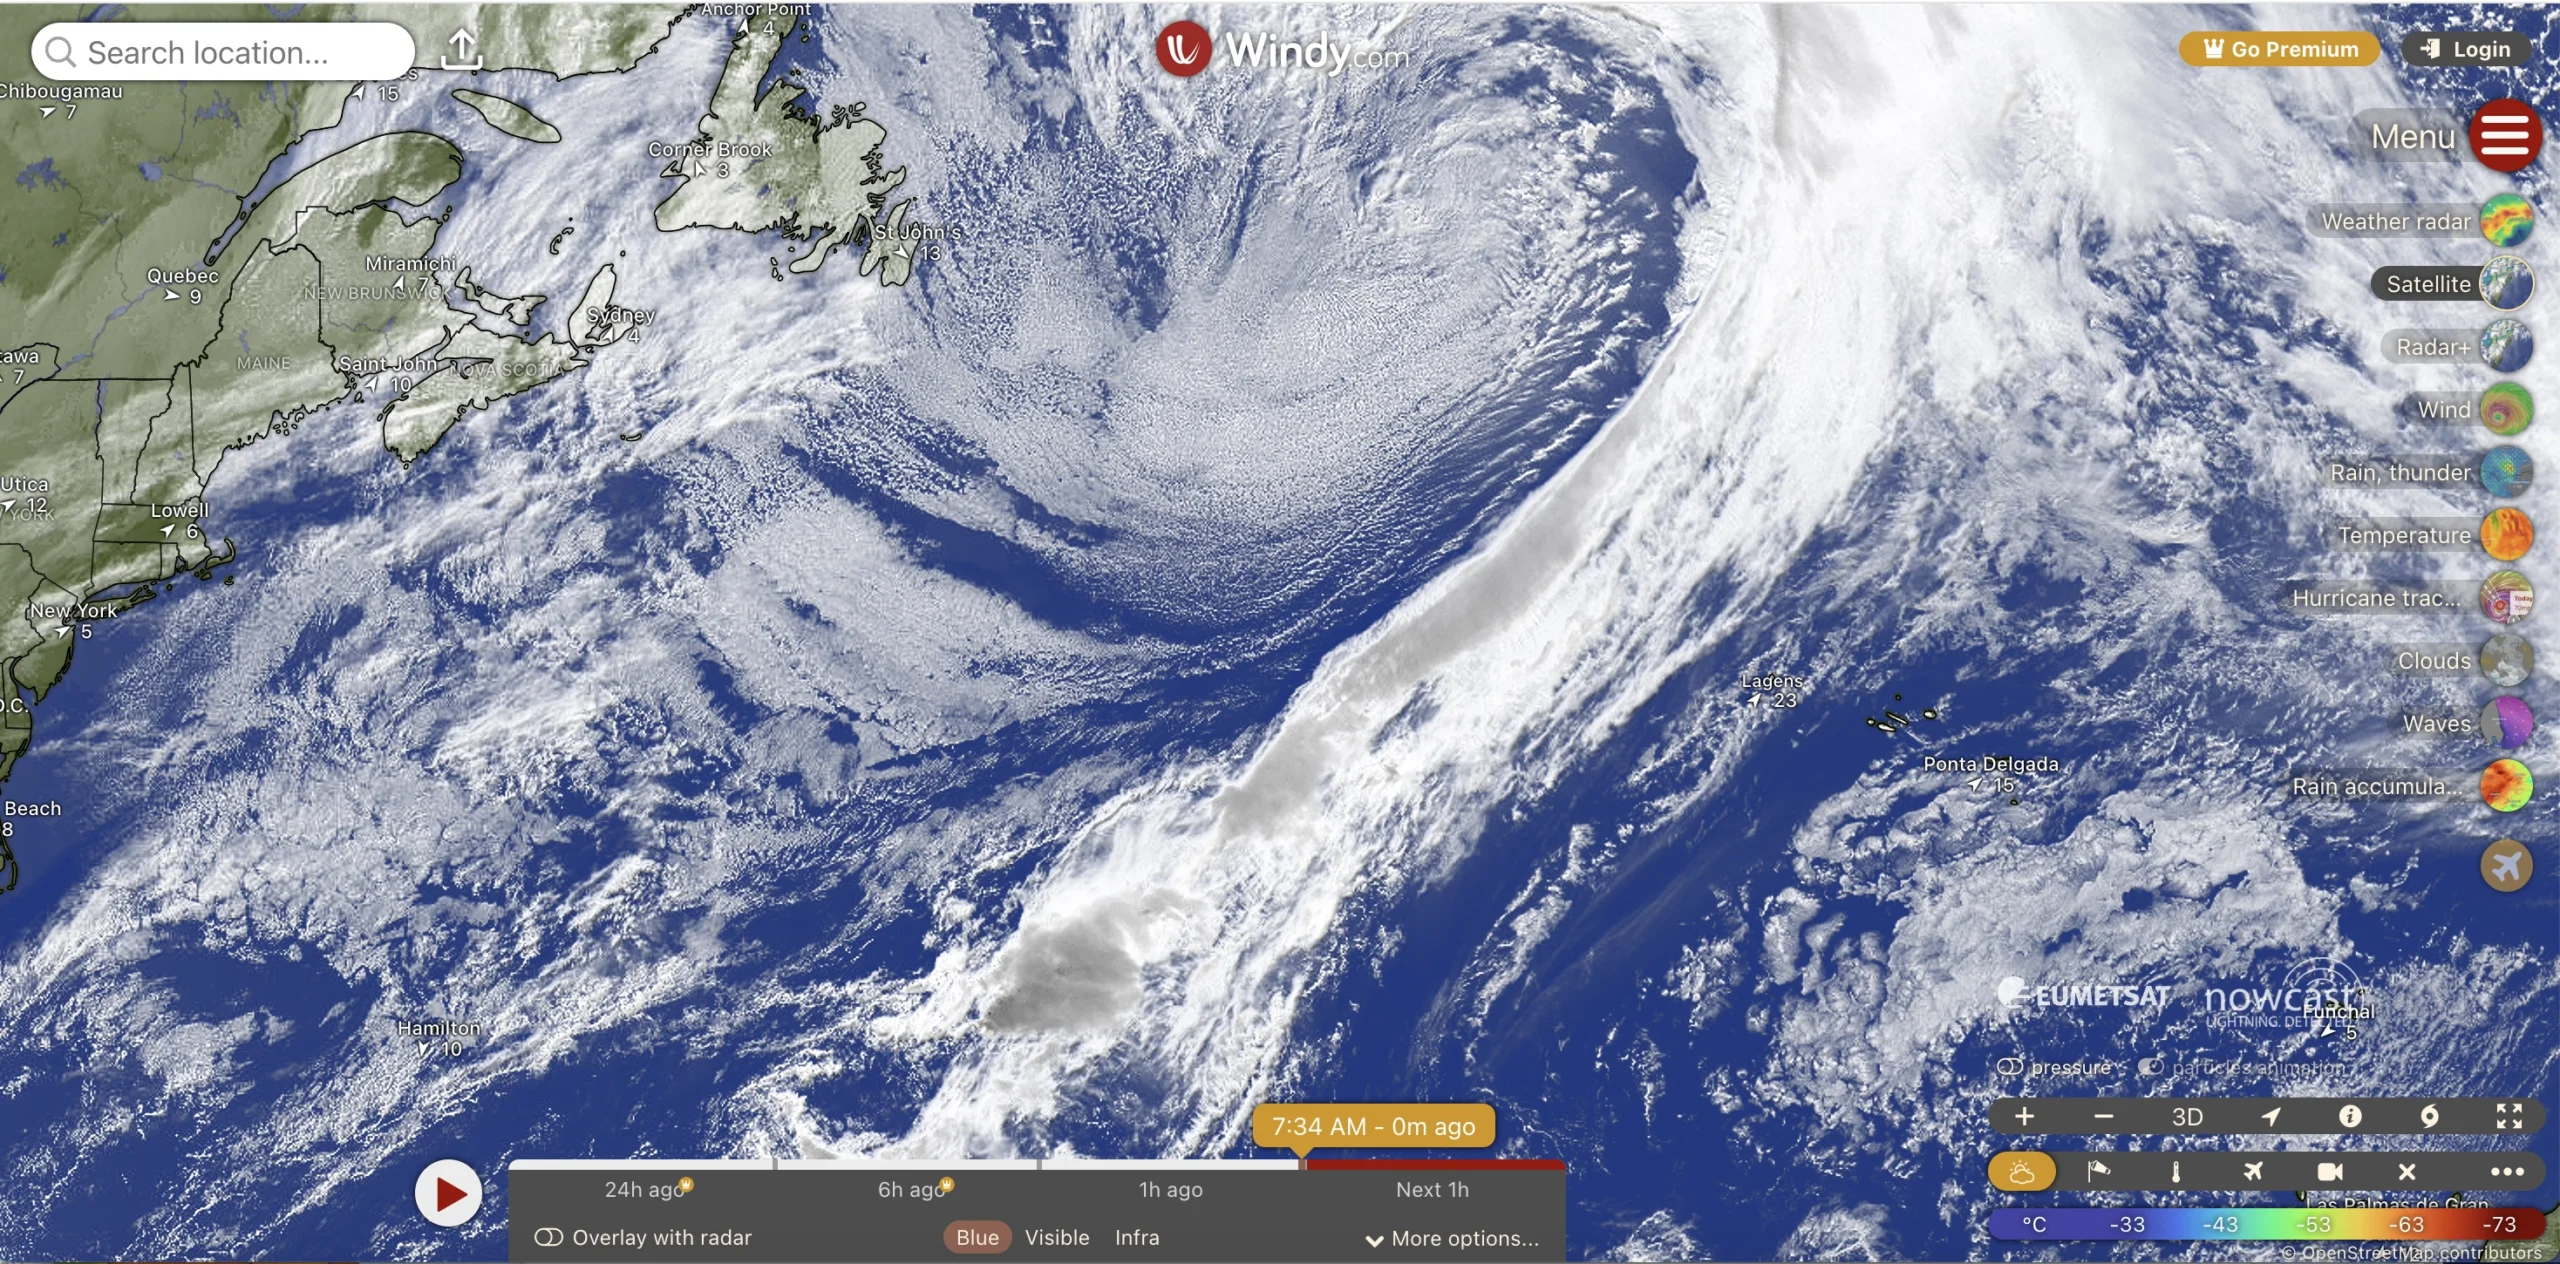
Interestingly, this shift in the winds and weather seems to have increased the amount of disagreement in the models. I’m not sure if there is any satellite imagery available to support any of the surface current models, otherwise Redwing’s science data and depth-averaged current gauge may be our best metric for seeing who is most accurate. The only general agreement I see between the models is that the water masses around Redwing seem to be feeding back into the Gulf Stream, which is good news for us if true.
Hi Sal:
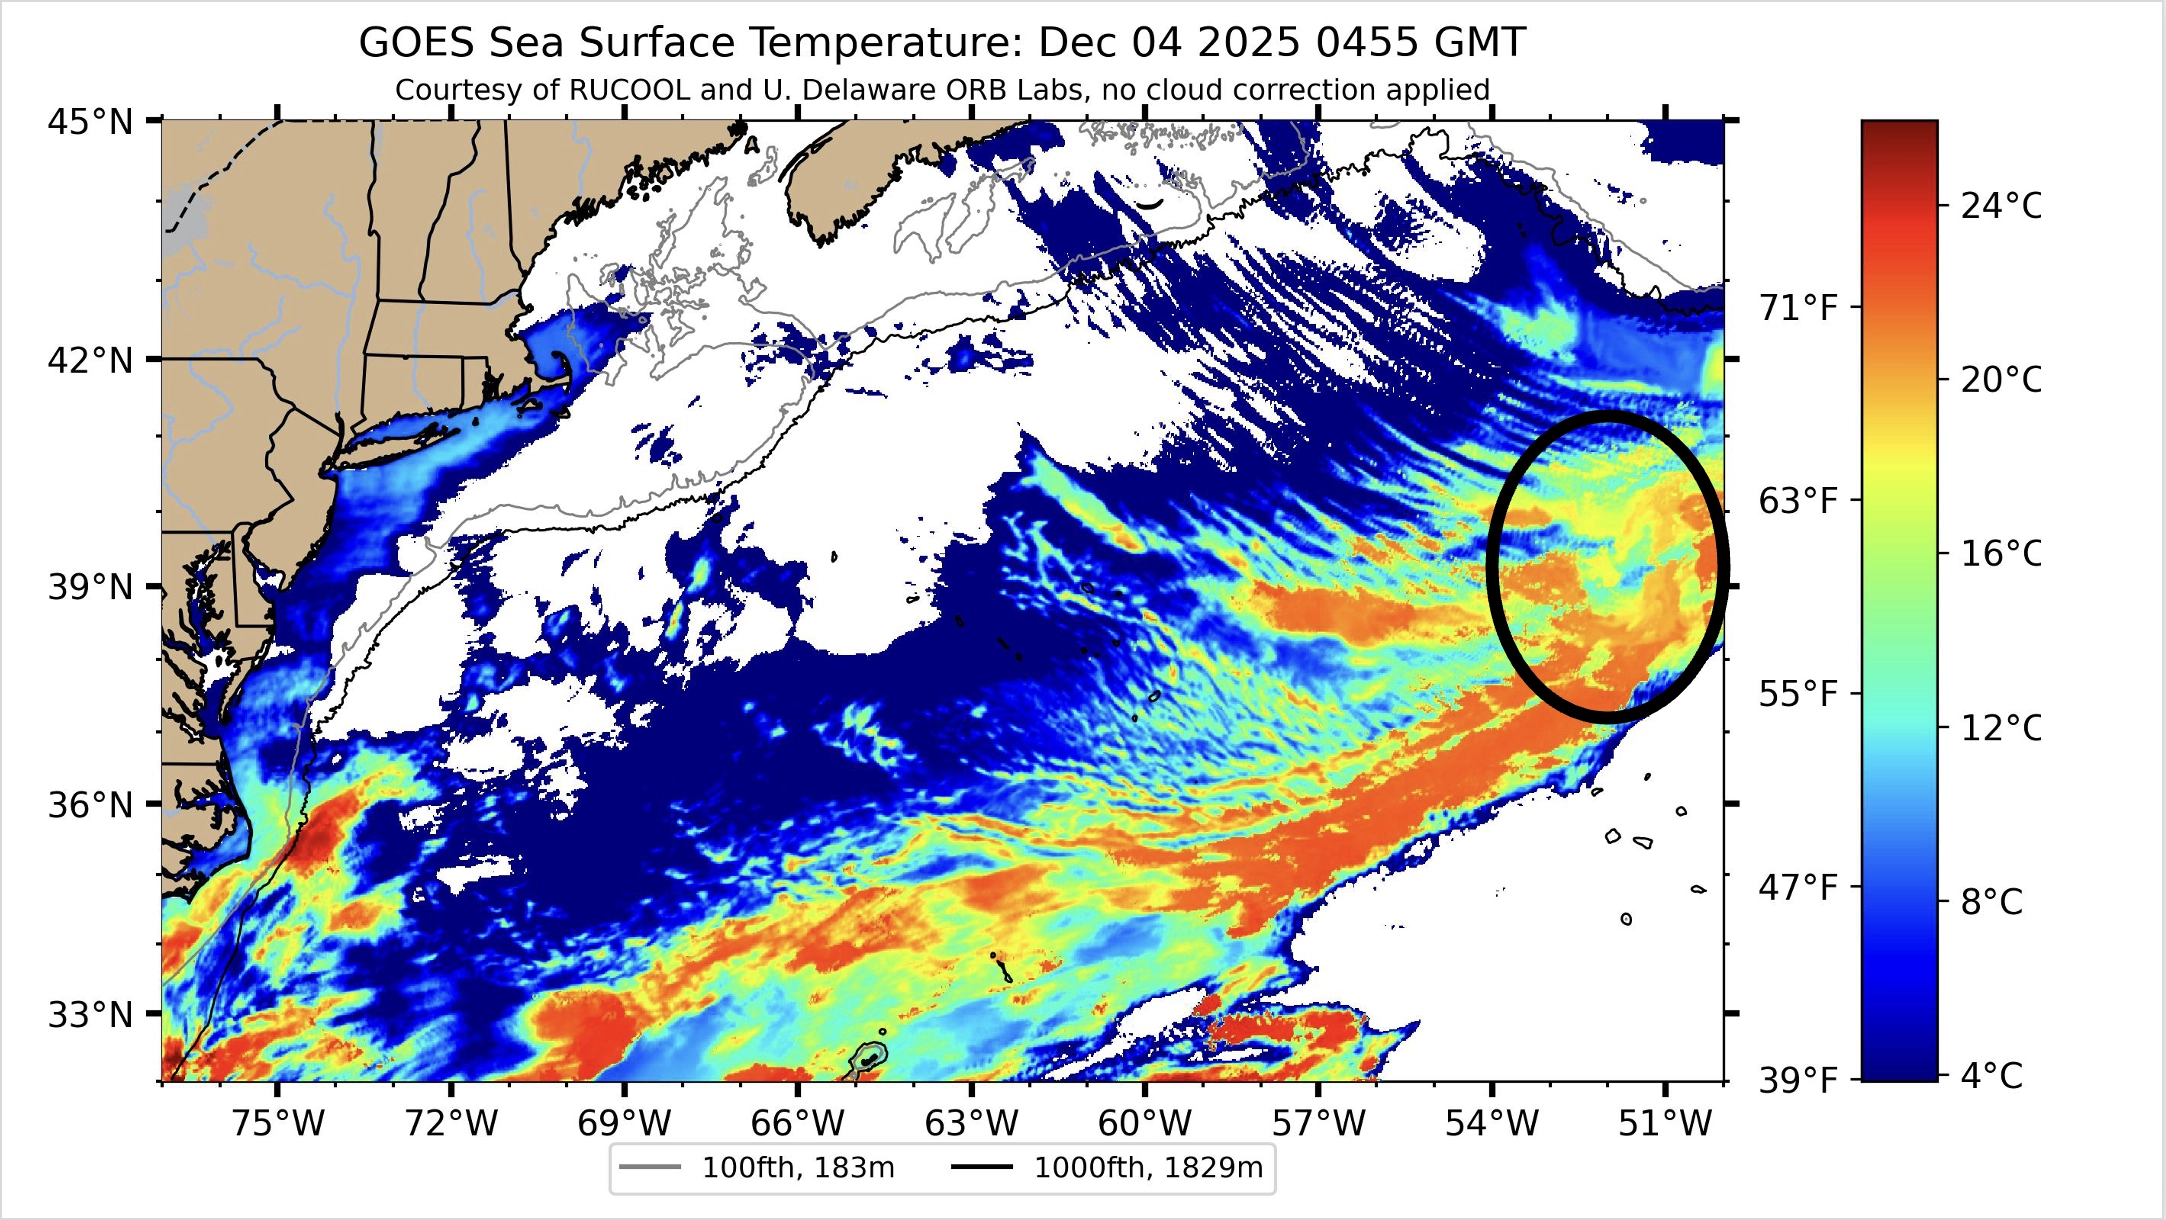
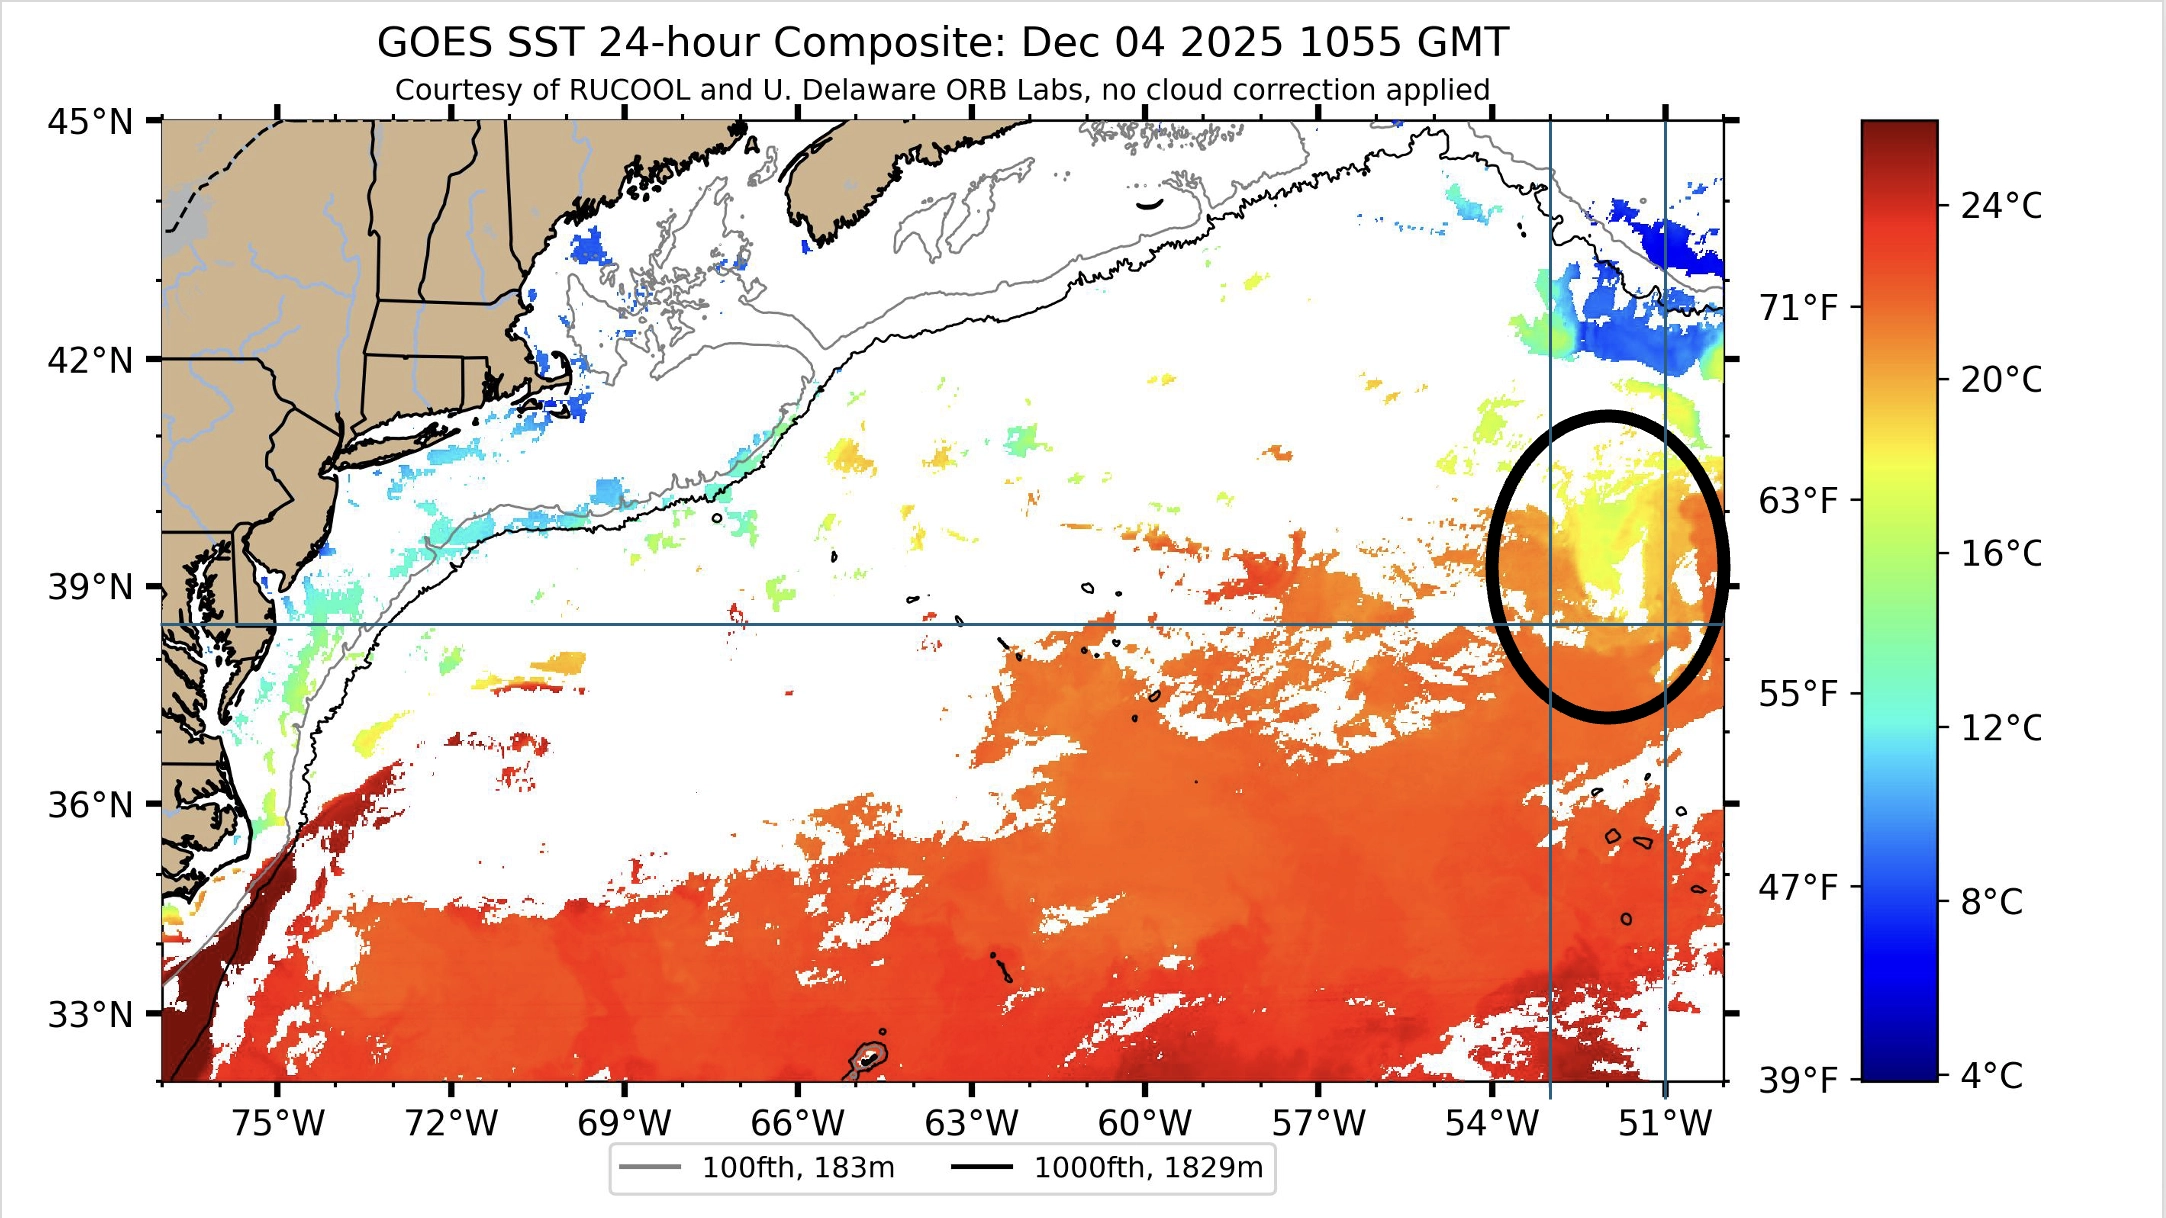
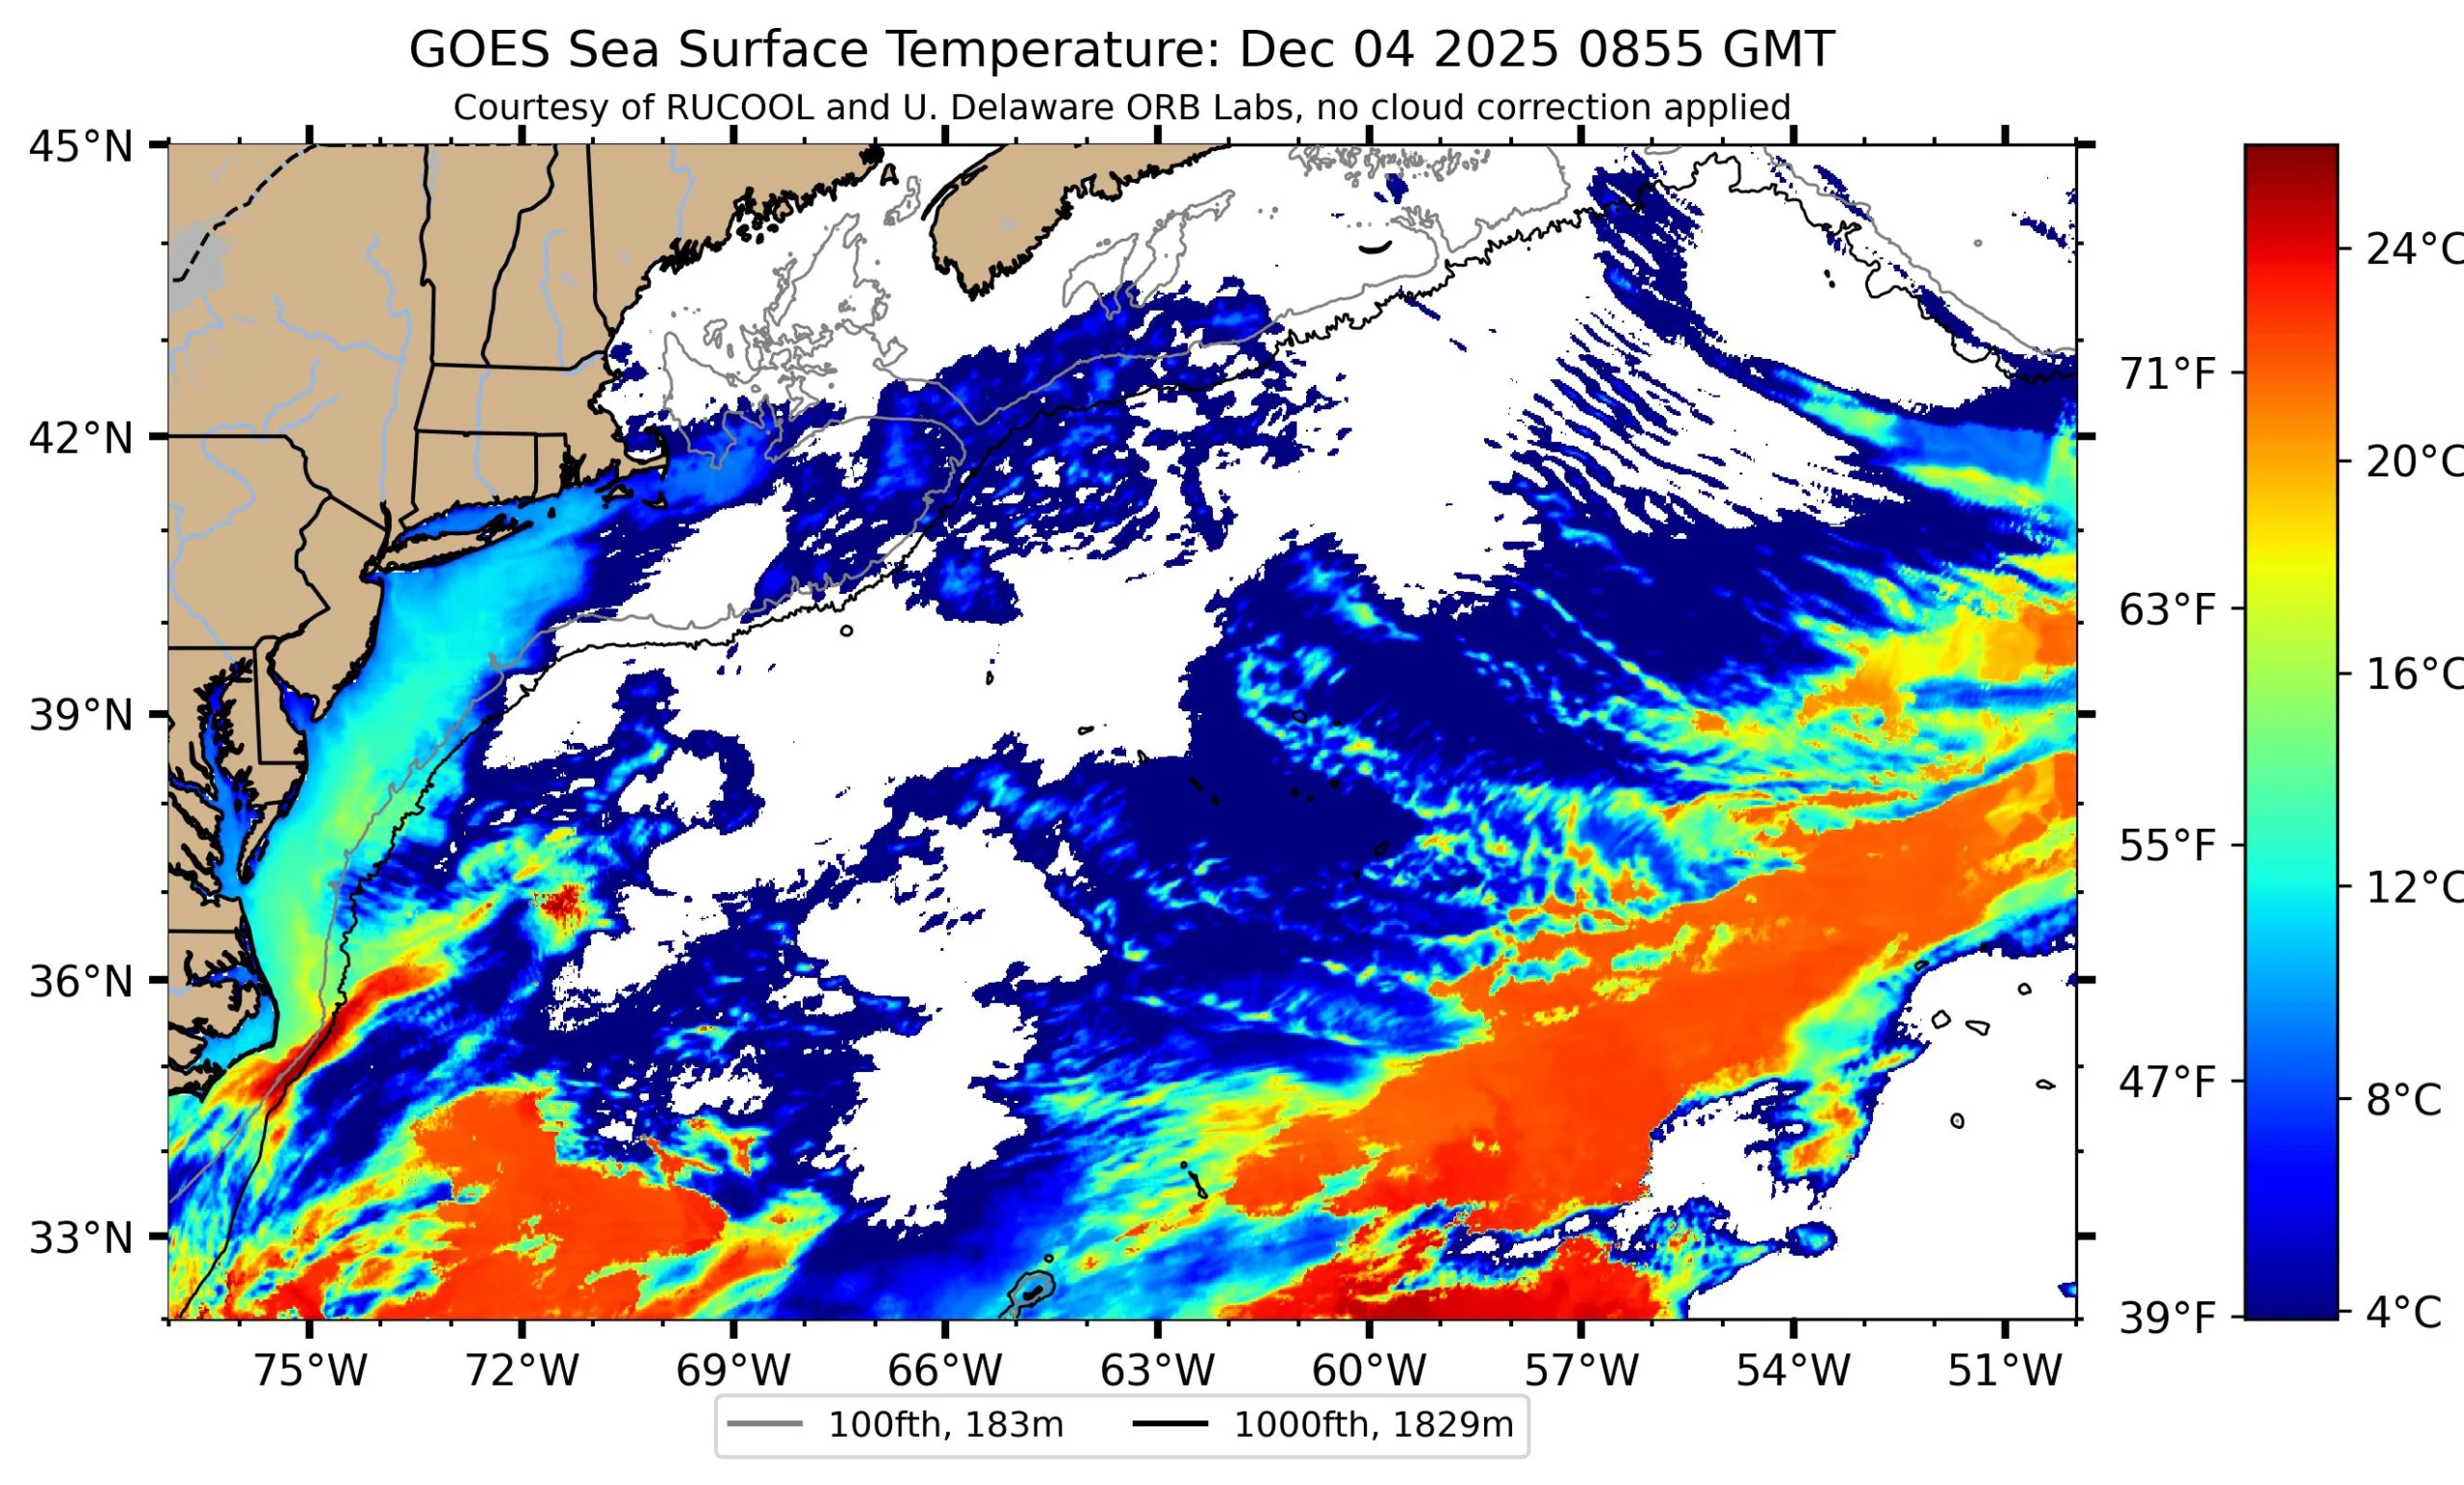
Passing this brand new composite SST on to you before I try to sit down and see what it means.
Thinking we have a strait Gulf Stream to our south that we are heading towards.
Scott
Redwing’s progress is looking great this morning. Between the favorable shift in currents, increased drive we gave her, and a nice Southern waypoint to fly towards, she’s nearing re-entry into the Gulf Stream core.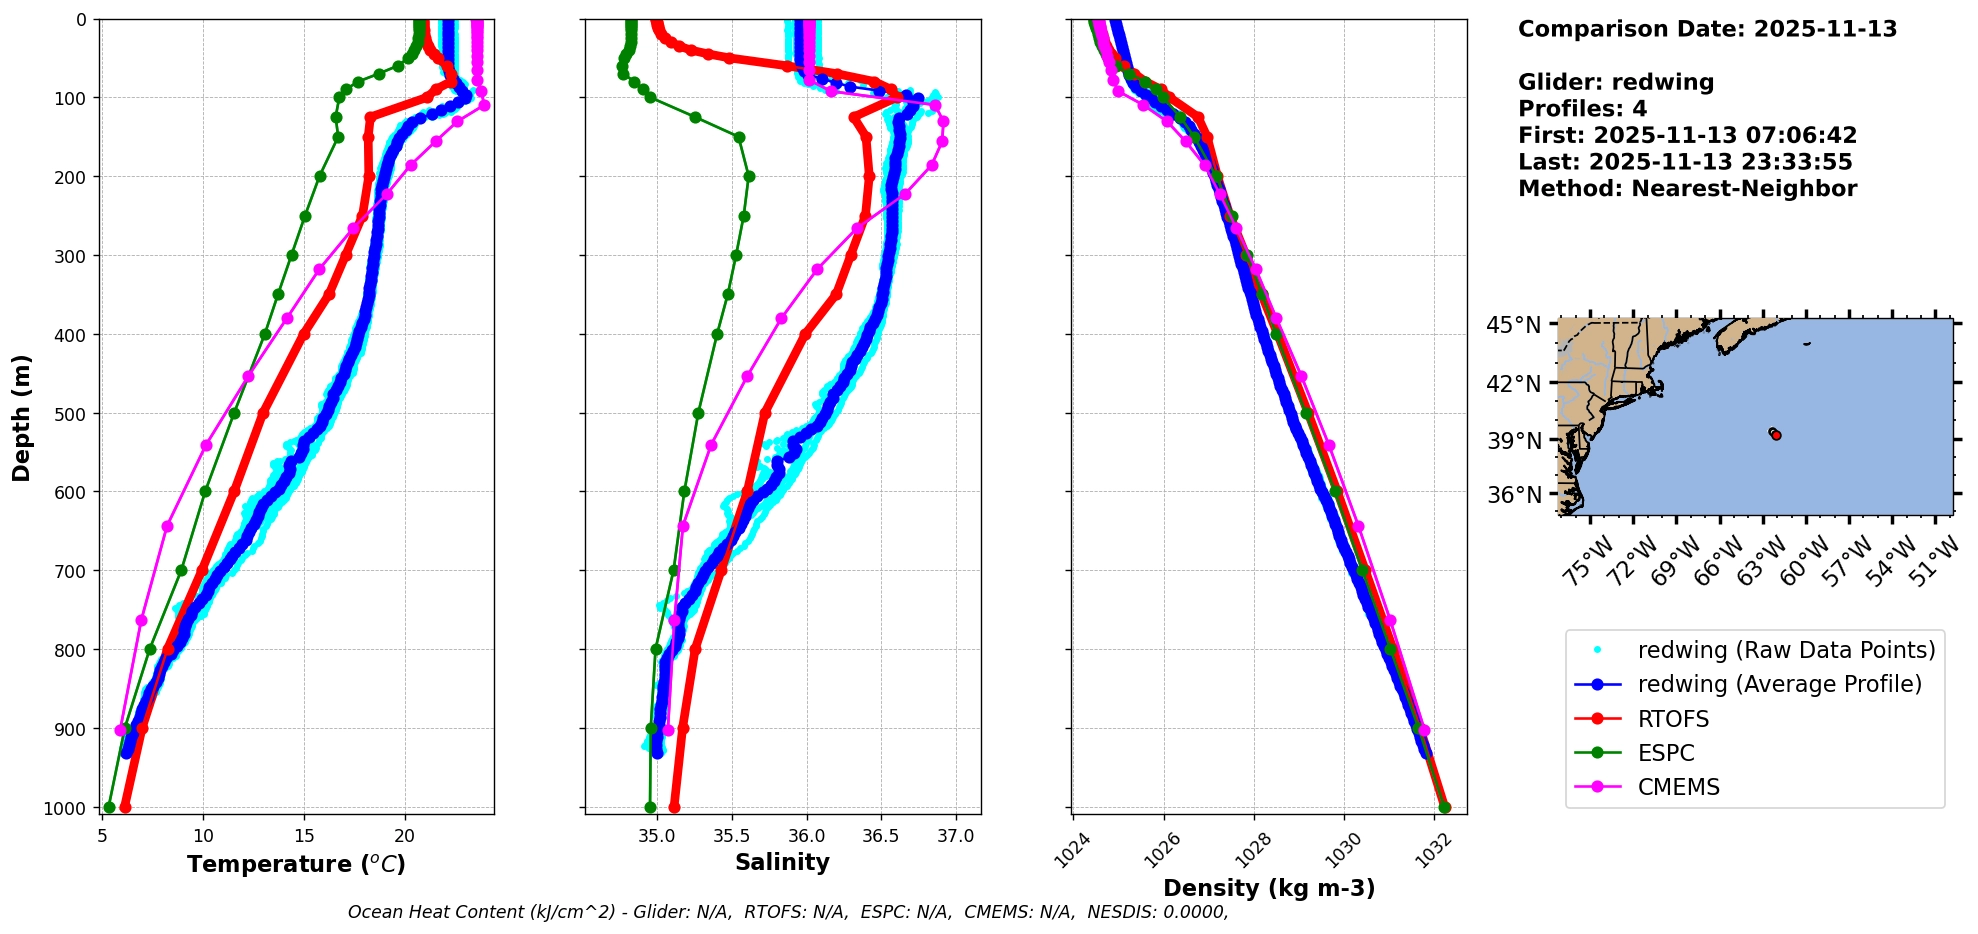
Her science data and measured depth-average current seem to indicate that we may be a bit further from the core than the models seem to indicate. Her last report on the current was measured at:
- sensor:m_water_vx(m/s)=0.084574782880968 627.207 secs ago
- sensor:m_water_vy(m/s)=-0.122122800020555 627.21 secs ago
From my best guess, this seems to indicate that we are still in the parcel of water to the North of the Gulf Stream edge that is feeding back into the core. Once we see the Eastern current component start to outweigh the Southern component we are seeing, I think it will be safer to say we are near the core. The T&S data so far seems to show those nice Gulf Stream water conditions however, so we certainly can’t be too far!
We are looking to reduce her drive back to 1200ccs later today to conserve some energy and modulate the waypoint to a more Eastern bearing to help us ride the stream out to the East.
It’s been some truly great work all around so far, over 1100 kilometers of ocean exploration under her belt so far!
Kind regards,
Sal
Hi Patrick,
Thanks for the update! She is looking to be in great position for the next section of our transit in the Gulf Stream.
It would be great to get an idea of where our most efficient route looks to be as we move towards the East. That information will be key for our next few major waypoint selections.
Looking forward to seeing what the models show!
Kind regards,
Sal
Names:
Eve Nevelos, Biotechnology, Class of 2028
Adryan Layton, Ecology, Evolution, and Natural Resources, Class of 2027
Aiden Blanos, Directed Marine Sciences, Class of 2027
Sophia Dutra, Marine Biology, Class of 2026
Amaya Baez, Marine Biology, Class of 2027
Introduction:
Hello everyone!
Welcome back to another update on Redwing’s journey for the Sentinel Mission! It has been an exciting journey so far, and we are excited to keep you updated on everything we have been working on, discovering, and wondering as Redwing trots on. Redwing has entered the Gulf Stream! We are excited about this because it will change (and has changed) the battery usage, speed, and data collection. Continue reading to learn more about our findings, excitement, and concerns.
Navigation:
The current location of Redwing is 39° 20.799’N 63° 9.981’W, where the glider has traveled around 446 kilometers in the past week, which adds to its total kilometers traveled to a whopping 981 kilometers! Or 609.5 miles for a quick conversion. Redwing is surely making some distance, which you can see from the yellow path of Redwing’s progress from the past week.
As of the last resurfacing location of Redwing, it is moving at a speed of 0.45 m/s, which is roughly 1 mile per hour or 1.62 kilometers per hour. In some of the graphs below, you will even be able to see the temperatures of the area Redwing is traveling through, which is something we have been looking at closely as of this week.
The waypoint (marked in the above Google Earth image) is the next destination point set for Redwing. This means that Redwing will do its best to travel directly to that spot from where it is currently positioned. However, we do not want Redwing to go to that point ultimately; we are just using it to redirect Redwing to remain traveling East and get to the Gulf Stream.
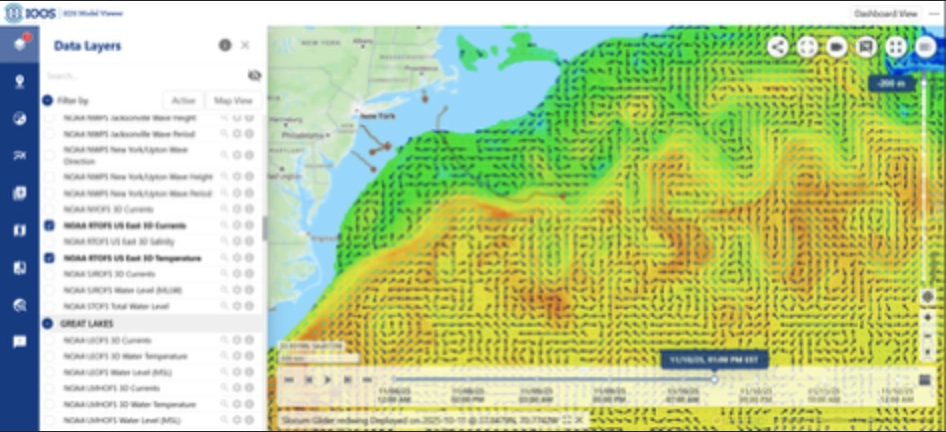
The NOAA RTOFS Model from the Integrated Ocean Observing System (IOOS) shows us the temperature, as well as another visual of Redwing’s location. It also shows the currents that Redwing may currently be traveling through and using to move through the Gulf Stream.
(You can see that this model doesn’t exactly match our Google Earth image above. This is because the IOOS is under a QA/QC management, which stands for Quality Assurance/Quality Control. This means they do not track or update when these gliders are deemed “out of bounds” because it is automatically seen as “bad data”. In reality, Redwing is moving at great speeds in the Gulf right now which is just too hard to track. We are doing good and making great progress! AKA: we broke the system, sorry!)
As you may remember from our last blog installment, there was a great concern about whether Redwing had actually entered the Gulf Stream or was simply just outside of it, so we’d like to tell you more about the updates we have been able to gather since then!
Engineering:
As we know from November 8th, Redwing is riding the Gulf Stream current, cruising towards Spain! As we can now use the currents of the Gulf Stream to push us forward, it seems our data gaps have decreased! As we ride this stream, Redwing can use its force to accelerate forward, allowing her to allocate power towards other sensors, reducing her battery life! Now, we can take a steady look at the cooler, saltier depths beyond 700-800 meters! Also, to be noted is the giant reduction in speed of Redwing around after 100 km, around the same time she’s been able to reach her max depth. But now that she’s going this far down, we need to be aware of any marine life we may encounter, such as whales or squids. With her reduced speed, hopefully, we will not have any big surprises or marine friends trying to catch a ride! This also means she may be resurfacing less, so any check-ins along the way need to be thorough.
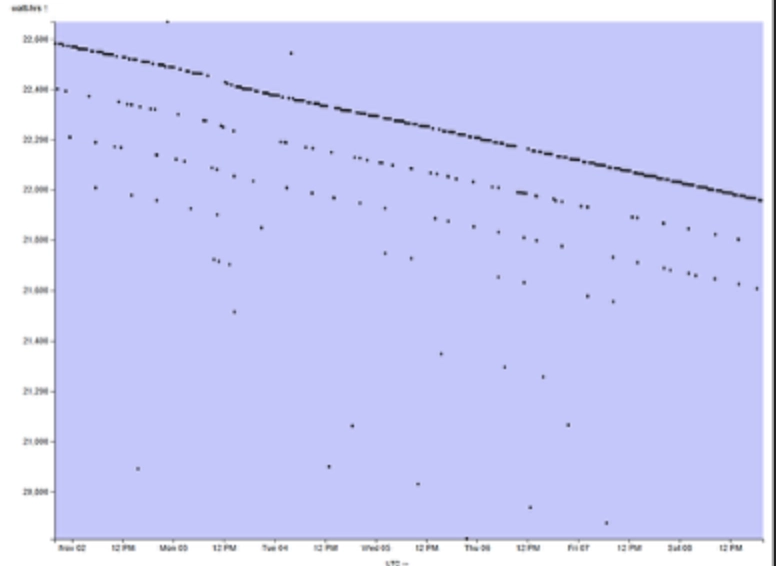
Another important thing to discuss is the battery! The above graph shows the battery usage in watt-hours over the last week; Redwing has seemed to use a consistent battery usage of 31.2 volts or about 22,600 watts per hour, which has dropped a bit over the week. Battery usage is important for us to track, since it will need to be conserved and used wisely throughout the journey across the Gulf.
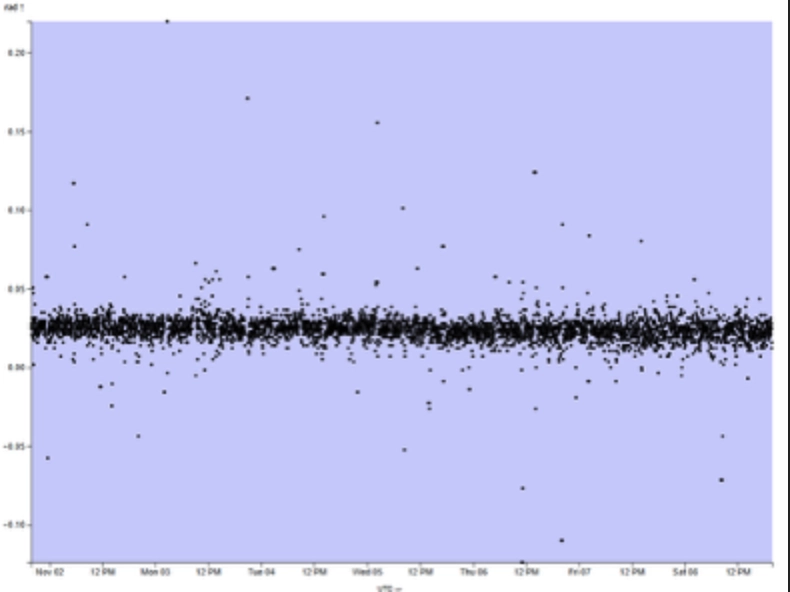
The graph above shows a visual of the Redwing’s roll or stability over the last week. It has consistently been between 0.00 and 0.05 radians (0 to 2.86 degrees), with a few outliers, which could be caused by the currents of the Gulf Stream that Redwing is currently in. There haven’t been any drastic changes, which we’re very happy about!
The pitch is used to tell the diving and climbing performance of a glider as it moves through water. The Y-axis shows when Redwing is moving upward (positive) and downward (negative) as it navigates. We want the glider to gently rise and fall when it is told to do so to ride the water column and move forward. Unpredicted and unwanted vertical motion can throw the glider off track, so it is important to monitor it. The graph above shows Redwing’s movements throughout the entire launch and shows that Redwing is consistently moving in the sawtooth motion that we want it to, as of late, despite the many factors that can throw it off track. As seen in the graph above, Redwing typically ascends and descends at 0.5 radians, or 28.6 degrees, relative to the horizontal.
Science:
Are we actually in the Gulf Stream?
Last week, the models disagreed on whether the glider was in the Gulf Stream, but it was clear from the temperature data from Redwing at 200 meters of depth that the glider was not in the Gulf Stream. A rule of thumb is that if the temperature at 200 meters of depth is 15 degrees Celsius, then you are in the Gulf Stream. If the temperature at 200 meters of depth is above 15 degrees Celsius, then you are South of the Gulf Stream; if the temperature is below 15 degrees Celsius, then you are North of the Gulf Stream. This week, it appears that the glider was in the Gulf Stream (check out the NOAA RTOFS Temperature Plot below for a visual). Interestingly, Redwing was only in the Gulf Stream on one day (November 6, 2025) and has been South of it since. It would be ideal for the glider to remain in the Gulf Stream to reduce battery consumption. However, the eddy currents in the Gulf Stream can quickly throw the glider off its path. The Gulf Stream carries warm, salty water from the Sargasso Sea. As the Gulf meanders and eddies form, Warm Core Rings or Cold Core Rings can be pinched off from the main stream. These rings can isolate water from the stream, and later interact with the stream, reintroducing that water.
For reference, 200 meters is about 2 football fields, 15 school buses, or 3 Boeing 747s long! Redwing can glide down to 1000 meters (approximately the height of two World Trade Centers stacked on top of each other, 10 football fields, 75 school buses, or 15 Boeing 747s).
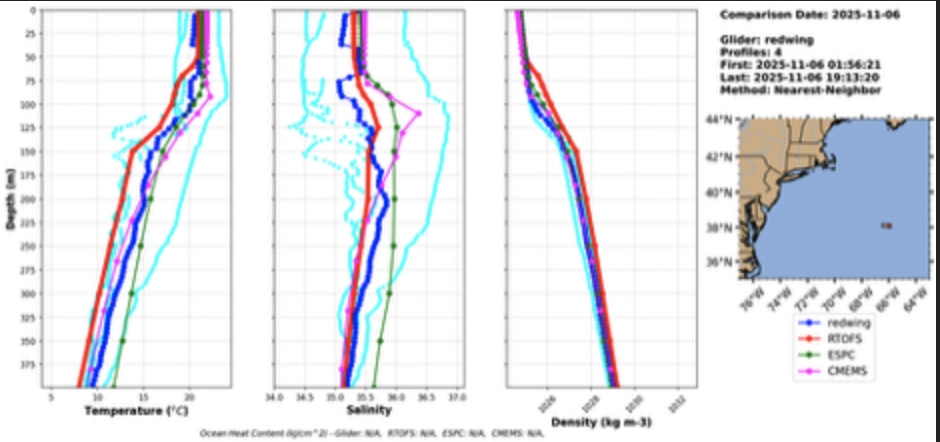
The above data plots are from November 6, 2025, when Redwing was in the Gulf Stream. Again, we know this because at 200 meters deep, the temperature was 15 degrees Celsius.
Redwing found the temperature to be warmer and less saline than RTOFS (Real-Time Ocean Forecast System, by the US National Oceanic and Atmospheric Association) predicted, similar to what CMEMS (Copernicus Marine Environment Monitoring Service, by the European Union) predicted, and colder than and similar in salinity to what ESPC (Earth System Prediction Capability, by the US Navy) predicted. Overall, CMEMS was the winner for accuracy this week. CMEMS has been consistently matching glider data over the last 4 weeks.
Overall, the temperature measured by the glider this week is about 5 degrees Celsius warmer than last week at 200 meters. The biggest change, though, is the surface temperature. Last week, the surface temperature was 17.5 degrees Celsius, and this week it’s 20 degrees and remains at 20 until 100 meters deep. Last week, the temperature dropped to 7.5 degrees at just 60 meters deep and stayed low. This shows how strong the Gulf Stream and its eddies are.
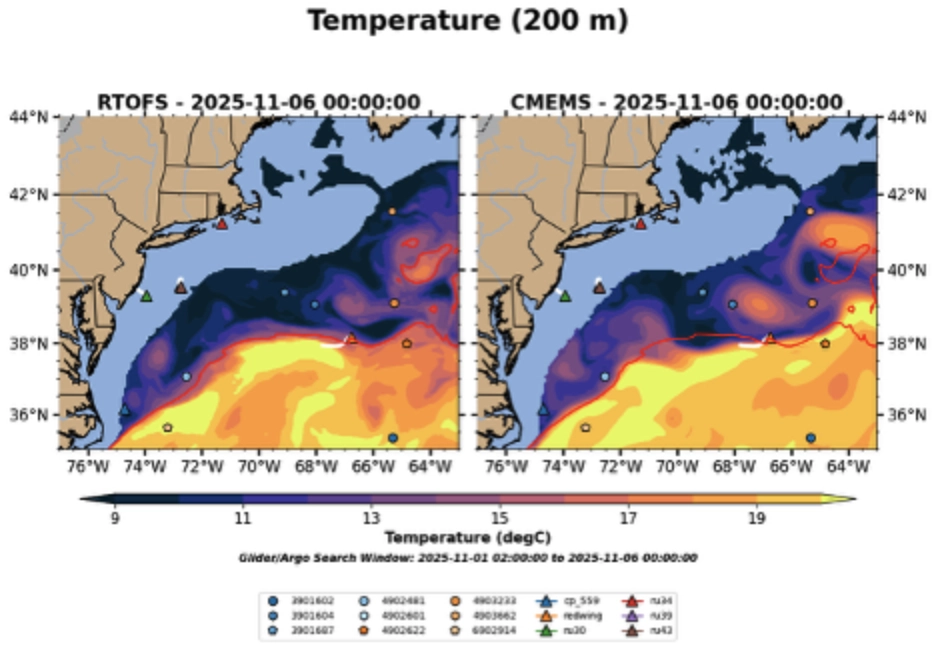
The above graphs show the temperature at 200 meters of depth on November 6, 2025. Redwing is marked with an orange triangle. The red line shows the approximate location of the Gulf Stream. Redwing was riding that jet!
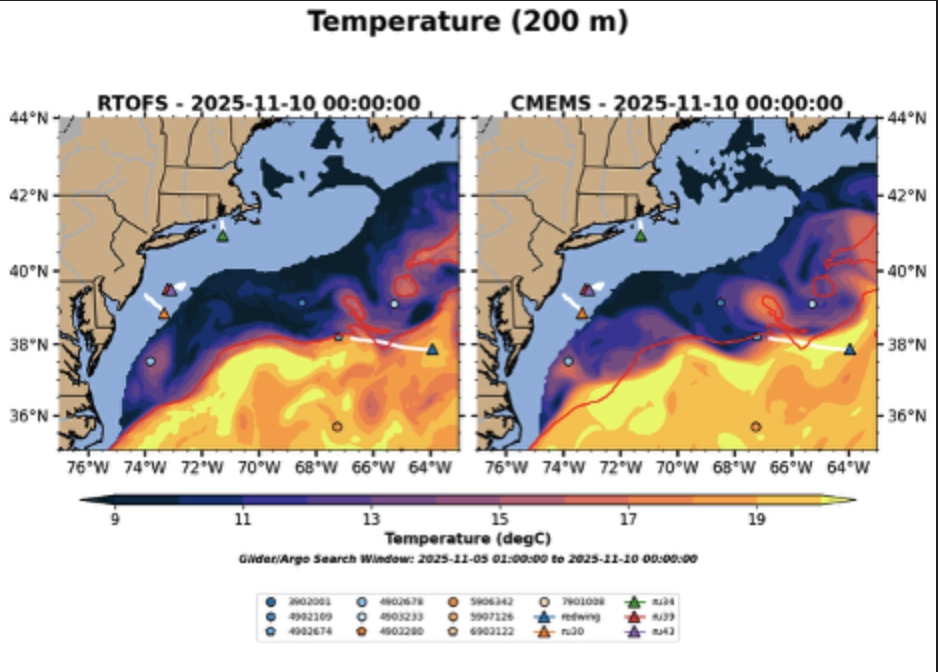
The above graphs show that Redwing (the blue triangle) is South of the Gulf Stream on November 10, 2025. We know from the navigation section that the waypoint is currently set for Redwing to continue Southeast, so it will stay in warm water.
One interesting note is that there seems to be a random current that has appeared between November 6th and 10th, appearing to almost jet Redwing out of the estimated current. Could it be an issue with the currents’ prediction data, inaccurately representing the Gulf Stream? Has the glider been piloted out due to external stresses? Did she go rogue? It is very interesting to see how such a subtle change can raise so many questions! As she moves on, we will be looking to see how exactly Redwing is maneuvering around and through the currents of the Gulf Stream.
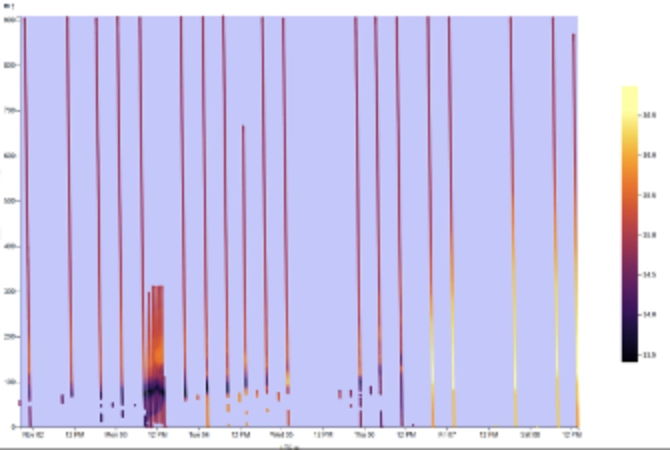
The above graph is a plot of time vs depth with salinity in color (yellow is high and purple is low). Fun fact: the salinity is calculated with a fancy equation that uses temperature and conductivity; not directly measured by the glider. The salinity tells us about the ocean’s movements and turnovers. For example, water traveling along the Gulf Stream is actually saltier than water in the North Atlantic Ocean. It’s clear that Redwing is in a very active environment at the moment.
Questions, Concerns, Findings:
As Redwing continues, there are many concerns about what Redwing may have to navigate through, as the glider will spend many days making its way across the Gulf Stream. There are potential problems, some being winter nutrient blooms and human waste-related blooms, that can cause great trouble and hazards for Redwing should we come in contact with them.
With the upcoming season changes and our approaches towards winter, we have come to a realization of the increase and influx of Winter Cruises/December Cruises that will take off as Redwing continues moving. With cruises comes the dumping of sewage and graywater that is dumped into the ocean and offshore areas. With this sewage and graywater release, it can lead to algal blooms, which can affect Redwing and hinder its performance. Not to mention how they negatively affect marine life and ecosystems as well. Winter nutrient blooms also cause rapid algae growth that can cause the same harmful effects to Redwing that can lead to possible problems, such as biofouling and exposure to certain toxins that can lead to communication, navigational, and instrumentation issues.
In order to stay on top of situations like this, we are keeping a close eye on cruise ship lanes and routes as well as their timings and departures to make sure that Redwing stays out of the way while also staying on track. Redwing also has biofouling proof paint and no access available to the seams of the glider which will basically tell some of these organisms, such as barnacles, to stay away and give the glider some protection against these hazards.
We have also discussed the impact that climate change will have on Redwing’s journey. Climate change has led to problems such as unnatural marine life migration and displacement. This means we can find marine life in places and areas they should not be in or should not be in during this time of year. It can lead to an increase in hazards that we may have to watch out for, as we do not want to disrupt marine life further, and we also do not want a repeat of any marine life situations our past gliders have gone through (Ergo: The Squid Incident). This is also a reason why drawing less attention and reducing Redwing’s speed and battery usage will be important, so we don’t attract marine life and get unwanted hitchhikers.
The other problem Redwing faces is the Gulf Stream itself. Since the currents of the Gulf Stream are a crucial part of Redwing’s journey that may be used to save time and battery, it also comes with the concerns of being TOO strong. We want to be able to navigate through the Gulf without getting stuck and thrown off course in the mesoscale eddies, which are spinning rings of water that break off from the main current that delivers nutrients, heat, and circulation to great distances across the ocean. It is an important factor we are keeping track of to make sure Redwing doesn’t get transported somewhere else that is definitely not on course!
But even with the many things to watch out for, we are staying on top of anything and everything Redwing may face or have to navigate through, so we can successfully make it across the Gulf Stream!
Do you have any questions, concerns, or exciting findings to share with Teledyne?
Why has Redwing been consistently South of the Gulf Stream over the last few days? Is it because the Gulf Stream’s eddies have been too strong and threaten to throw Redwing off its path?
T: Redwing has been South of the Gulf Stream because it is relatively safer there right now given some of the strong eddies that she is navigating through.
Will we re-enter the Gulf Stream at any point in the future? If so, where is the safest and most efficient location for re-entry?
T: We are trying to reconnect Redwing back with the stream in the Gulf right now, it is currently working against a strong North current but we are making our way back on track into that stream.
If this continues and we need to continuously watch for insanely stronger currents to pilot out of them, how will this affect our battery usage and longevity?
T: With keeping a close eye on Redwing, battery usage and other her performance will be looked at closely as well to make sure we are continuing at a good pace.
What other issues do we face now that we are not part of the Gulf Stream currently?
T: Mostly strong eddies that could possibly work against Redwing, we are keeping a close eye on her every time she resurfaces and will continue to closely monitor her movements and the updates we receive from her.
Farewell and stay tuned for next week’s update!
Scott, Oscar, and Joe (11/11/2025)
Redwing Heads to Sea: Navigating the Gulf Stream Together
Hi everyone! As the fall semester unfolds at Rutgers, the Sentinel glider mission came to life through a steady stream of collaboration between Rutgers scientists, students, and our partners at Teledyne Webb Research. What began as a set of model forecasts and a clear satellite snapshot of the Gulf Stream evolved into a dynamic, real-time exercise in planning, coordination, and discovery.
Navigating the Edge: Late October to Early November
The past few weeks have been a constant cycle of data analysis and piloting adjustments, as we attempt to push Redwing into the Gulf Stream core.
In late October, our data indicated we were running into a bit of trouble. Redwing’s depth averaged currents were quite low—around 5 cm/sec to the west—when we were expecting strong currents heading east. Based on the ocean temperature at 200 meters being about 9°C, we were clearly still north of the Gulf Stream. We learned quickly which models to trust; the RTOFS model was predicting we should be deep in the Stream and was proven wrong, while both the Navy ESPC and European Copernicus models looked much closer to Redwing’s reality.
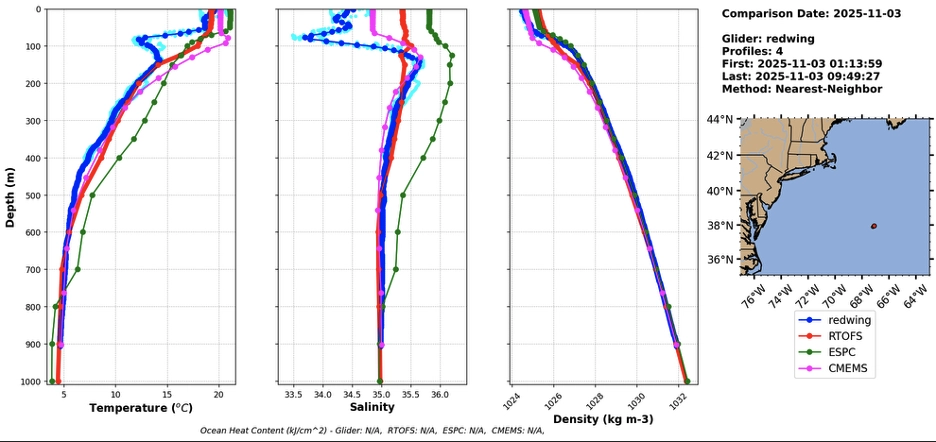
By November 3rd, things started looking up. The depth averaged currents were starting to pick up, though the temperature profile still suggested we hadn’t reached the warmest core of the Stream yet—meaning faster, warmer water was still ahead. Based on recent data showing water speed lower and to the north (not east), suggesting we might be moving out of the Stream on the north side, we updated the glider’s waypoint to head due East to help us fight inwards toward the core and better leverage the currents.
Officially In: Finding the Flow
The beginning of November brought great excitement! By November 7th, the Redwing reported currents were steadily picking up in the eastward direction. The eastward velocity climbed to 38 cm/sec. Crucially, the temperature at 200 meters finally went above 15°C, which confirmed we were officially in the Gulf Stream. We were seeing a strong eastward velocity of 83 cm/sec, which felt incredibly good.
Once in the Stream, we adjusted our piloting decisions. On November 8th, we decided to set Redwing’s waypoint to the ESE (approximately a 100-degree heading) to keep us on the wider and more stable south side of the core. Sal from Teledyne noting that Redwing was “really cooking”!
However, the Gulf Stream is anything but smooth. On November 8th, while we saw strong eastward flow, we also experienced a southward current component of about 40 cm/sec. This southward push indicated we were likely dealing with a small cyclonic eddy on the southern side of the Stream.
Steering Through the Unknown: Eddy Interaction
Our navigation efforts grew more complex as we moved east. By November 10th, Redwing was experiencing strong northern currents with a slight westward component. This pattern made it look like we were approaching the southern side of a Warm Core Ring. Despite having set our waypoint due East, the strong northward current (speed 1.02 m/s, bearing 347 degrees) required more aggressive action. We pivoted our waypoint to the Southeast (130-degree bearing) to maximize eastward progress.
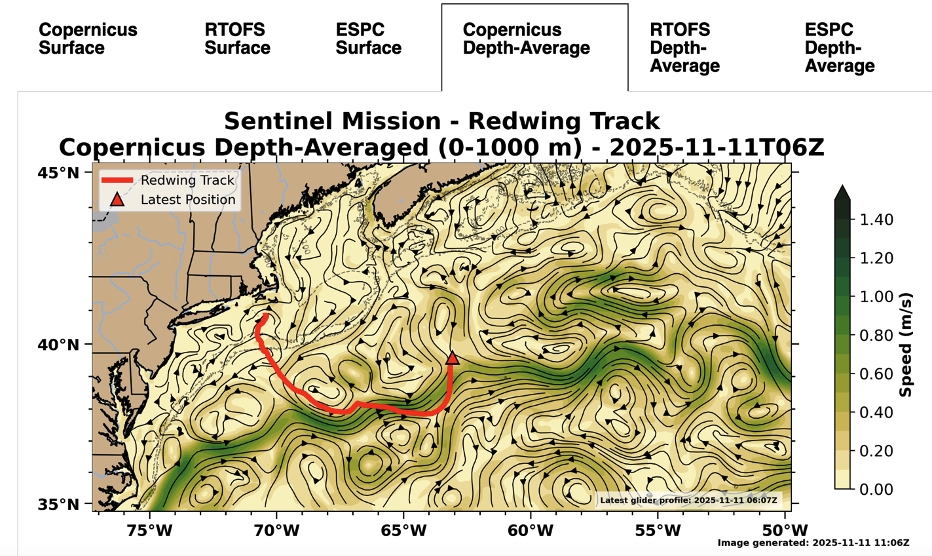
As of November 11th, we were happy to report that the westward component of velocity had decreased and even switched direction to eastward. Although Redwing’s depth averaged currents are currently expected to be less due to our entry into an interaction zone between the Gulf Stream and a Warm Core Ring, the T & S profiles still show plenty of salty 18°C water, suggesting we are still in Gulf Stream-like water. We feel we are now increasingly on the “good side” of this dynamic interaction zone.
It’s been an incredible challenge steering Redwing through this area where the models diverge so much, but seeing our glider’s local data confirming we are sticking with the current and collecting invaluable profiles makes all the hard work worthwhile.
Navigating the Gulf Stream right now feels a bit like driving a small boat through a river that keeps twisting and turning, occasionally throwing us into massive whirlpools (eddies) that try to spin us off course. We rely on our maps (the models) and our immediate observations (Redwing’s sensors) to constantly adjust the rudder and keep fighting toward the faster, central current.
Life Group Blog 1: Oct-Nov Ocean Life Transition
Credits:
Joshua D.
Paavni V.
Sarah S.
Sophia D.
Marc Y.
Hello there everyone! Welcome to the first entry of the Sentinel Mission Life Group’s blog. As we transition into the colder months of the year, the ocean’s life will go through some major changes as well. Today, we’ll be diving into some of those changes and some of the hazards we’ll be facing on the early stages of our journey. Let’s get started!
Seasonality of the Ocean
Upwelling is a process in which colder, more nutrient-rich water from the deep is brought to the surface. Upwelling is primarily driven by the physics of the ocean and can occur seasonally in some places and throughout the whole year in others. This process plays a crucial role in the marine ecosystem; with the nutrients allowing phytoplankton to bloom, thus building the foundations of their ecosystem’s food web. This abundance of phytoplankton could pose challenges for REDWING because certain species of phytoplankton can stick to the glider and create a thin film, which would then allow other marine species to stick to the glider. These creatures can hinder the glider’s performance by obstructing sensors and compromising hydrodynamics. This buildup not only decreases the glider’s efficiency in carrying out its tasks, but in turn affects the quality of data collected during its mission.
Additionally, weather-related events can hinder our progress across the ocean. This is exemplified by the storm that occurred some weeks back, just off the coast of Massachusetts, which delayed our progress for nearly a week. Right now, we are in the tail-end of hurricane season in the North Atlantic, and a Category 5 hurricane is predicted to cross paths with us while we are in the Gulf Stream. By the time it hits us, it will likely have weakened to the point that the influence on our path would be negligible. If we do encounter severe weather, it could delay the glider’s travel and possibly damage it.
Seasonality of Animals Near the Gulf Stream
As autumn progresses over the North Atlantic, the Gulf Stream begins to undergo one of nature’s biggest transitions. From October to November, this great ocean current acts as a highway for life on the move. The time between October and November is seen as a last feast for large animals before embarking on their migratory journey.
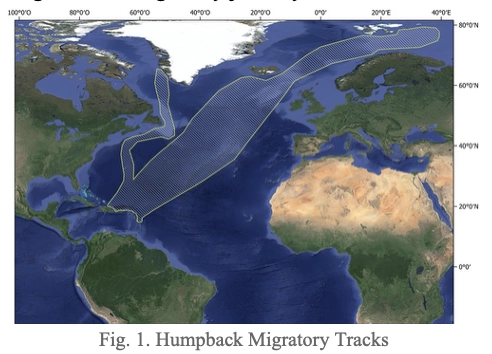
Humpback, Fin, and Minke whales all feed on schools of herring and sand lance before their migrations south for the winter. However, this southern migration may become an issue for REDWING as she will be moving straight across their paths as she moves across the Atlantic toward the Oceanic Platform of the Canary Islands (PLOCAN).
Many sharks are also in the process of migrating south for the winter. Similar to the whales mentioned above, REDWING will be moving through their migration paths. These sharks include the Great Whites, Blacktips, and Sandbars. The depths that these sharks swim at are depths that the REDWING will be traveling at. There is a chance that these sharks will interact with the REDWING.
REDWING travels between 0-1000m in depth on each dive. This could pose a problem for us as North Atlantic right whales, one of the most endangered species on Earth, begin their own journey southward around this time. Their path leads them to the shallow coastal waters of the southeastern United States, and as REDWING begins to move east, we will have to be cautious of these migratory tracks cutting across us.
Below the surface, fish are making their move too. Mackerel and herring start shifting south or diving deeper as surface waters cool, with swordfish lingering near the edge of the current, drawn by the large fields of prey around the warmer temperatures.
Mackerel travel in groups of thousands, and their schools can span for miles, while herrings often migrate in the millions. While different species of mackerel travel in groups for
different reasons, large groups (of both fish) which form during migration may have the potential to come into contact with the glider’s equipment in deeper waters, as well as places with low water clarity (often caused by intense storms). Both groups of fish have evasion strategies which involve quick and highly coordinated maneuvering, which means that they may have an effect on the data that REDWING collects about ocean currents and fish abundance.
The herring’s release of gasses may also be picked up by a glider’s acoustic sensors. Herring often communicate with each other by expelling air through their swim bladder. Picking up on this behavior could be of interest to our scientific understanding of herring, as well as the knowledge of communications between marine animals of the same species. However, the sounds of a whole school of herring (which as mentioned above can be in the millions), may cause the glider to misinterpret the source or cause of the sound, and mistake it for other underwater activity.
Another potential effect that migratory schools may have is physical buildup of fish secretions. Because REDWING is a long-term deployment, buildup, especially on the glider’s hull, could seriously affect its speed, increasing drag and decreasing lift.
Sharks are also another potential hazard to REDWING, especially Great White Sharks, which could interfere with the glider near the East Coast of the United States. While some Great Whites may remain closer to shore on the continental shelf, there are also members of this species that reside in the more open areas of the Atlantic Ocean. These sharks may pose a threat to REDWING if they come across her, as curious sharks tend to use their mouths to interact with new objects. This has the potential to cause damage to REDWING, and as such, it will be important to try and avoid these interactions. Fortunately, Great White Sharks tend to migrate south towards the sub-tropical waters off of the Southeastern Coast of the United States in the winter, so while still a potential hazard, they are likely to not be the biggest threat that REDWING will face as she crosses the Atlantic.
Another type of megafauna that has the potential to cause damage is the Giant Squid. Giant Squids tend to live at depths between 500 to 1000 meters below the surface and are present in all of the world’s oceans. Like their name suggests, these squids have been recorded as large as 43 feet long (13 meters). These squids are typically found close to continental slopes, so as REDWING dives and climbs through the world’s oceans to collect data, there is a risk of encountering a giant squid. Given that REDWING is past the continental shelf, the risk of encountering one is lower.
Other Potential Hazards Entering the Gulf Stream
Due to the upwelling events that occur during these later October-November months, we see higher spawn rates of phytoplankton, which leads us to multiple issues. As phytoplankton become active, their predators follow suit, which range from macrofauna to microfauna. Specifically for REDWING, her journey will have her maneuvering through these blooms that are brimming with high levels of phytoplankton activity, resulting in higher chances of encountering certain issues. In the past, barnacles and mussels (which feed off phytoplankton) have made gliders their personal travel homes by sticking onto them (Biofouling), resulting in drag and even altering the pitch and roll (vertical and horizontal tilt of the glider.
This means that REDWING is being turned and rolled around, which can slow her down. They can also damage external sensors, causing inaccurate data to be reported back. These creatures would need to be periodically removed throughout the season at any stops REDWING will make. Hopefully, she stays nice and clean for the rest of her winter journey.
Of course, humans also pose a threat to REDWING out in open waters. Firstly, we need to try and avoid shipping lanes, as many from New York are en route towards Spain and the UK and do intersect some of the path REDWING is following. We also have the giant North Atlantic Garbage patch to avoid, because if we get caught in it, a lot of damage can be done to our little glider friend.
Alright everyone! That’s all we have for this entry of the Sentinel Mission Life Group blog. Be sure to check back soon for more! Sea you Later!
Group 3
Written By:
Victoria Samuel, Marine Biology, Class of 2027
Sarah A. Schildkraut, Marine Science & Environmental Policy, Class of 2027
Paavni Vyas, Cognitive Science, Class of 2028
Jennifer Duarte, Marine Science, Class of 2028
Adam Kos, Marine Biology, Class of 2026
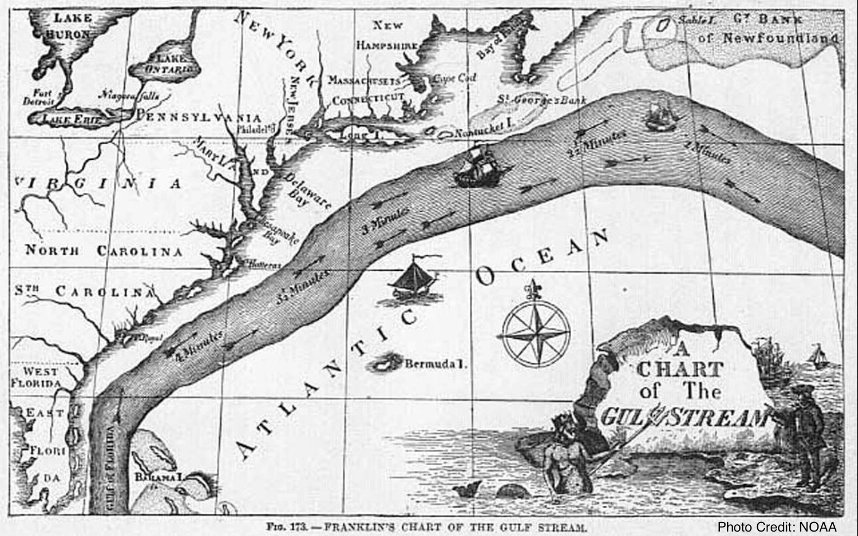
Hello and welcome to another installment in the blog as we continue to report on Redwing’s status! There are a lot of interesting topics to be covered, but first, some context on the current location of Redwing is needed. The glider is currently in or entering the Gulf Stream. The Gulf Stream is a very strong current in the North Atlantic that originates from the warm waters of the Gulf of Mexico. A mix of winds and density changes drives the strong current up North from Florida. The Spanish explorer, Juan Ponce de León, is credited with discovering the Gulf Stream, though the first ever map of the Gulf Stream was created by Benjamin Franklin. In the 1770s, Benjamin Franklin was the deputy postmaster general and was interested in how the trip from America to Europe was so fast and the trip back to America was so long. He eventually discovered the Gulf Stream was the reason for this and created the first ever map of the Gulf Stream. Today, the exact location of the Gulf Stream is still not certain, and there are various models that show the location of the current, and each one is different.
In terms of the Sentinel Mission, utilizing the Gulf Stream to cut down on Redwing’s travel time will be very important!
Navigation:
The current location of the glider is 37° 59.054’N 67° 2.475’W. The yellow line next to the red path, Redwing, is how far it has gone in the past week (10/28/25-11/3/25). The glider has likely entered the Gulf Stream. But we are not certain because different modes have different locations for the Gulf Stream.
Over the past week, the glider has traveled 197 kilometers. In total, the glider has traveled 535 kilometers
Currently, at the last reported surfacing of Redwin, it was moving at 0.36 m/s, which is around 1.2 kilometers per hour. Over the past week, the approximate speed was 1.2 kilometers per hour. Which is consistent with the current speed. The speed over the entire deployment is approximately 1 kilometer an hour. The increase in speed in the last week could likely be attributed to the glider entering the Gulf Stream and riding the current.
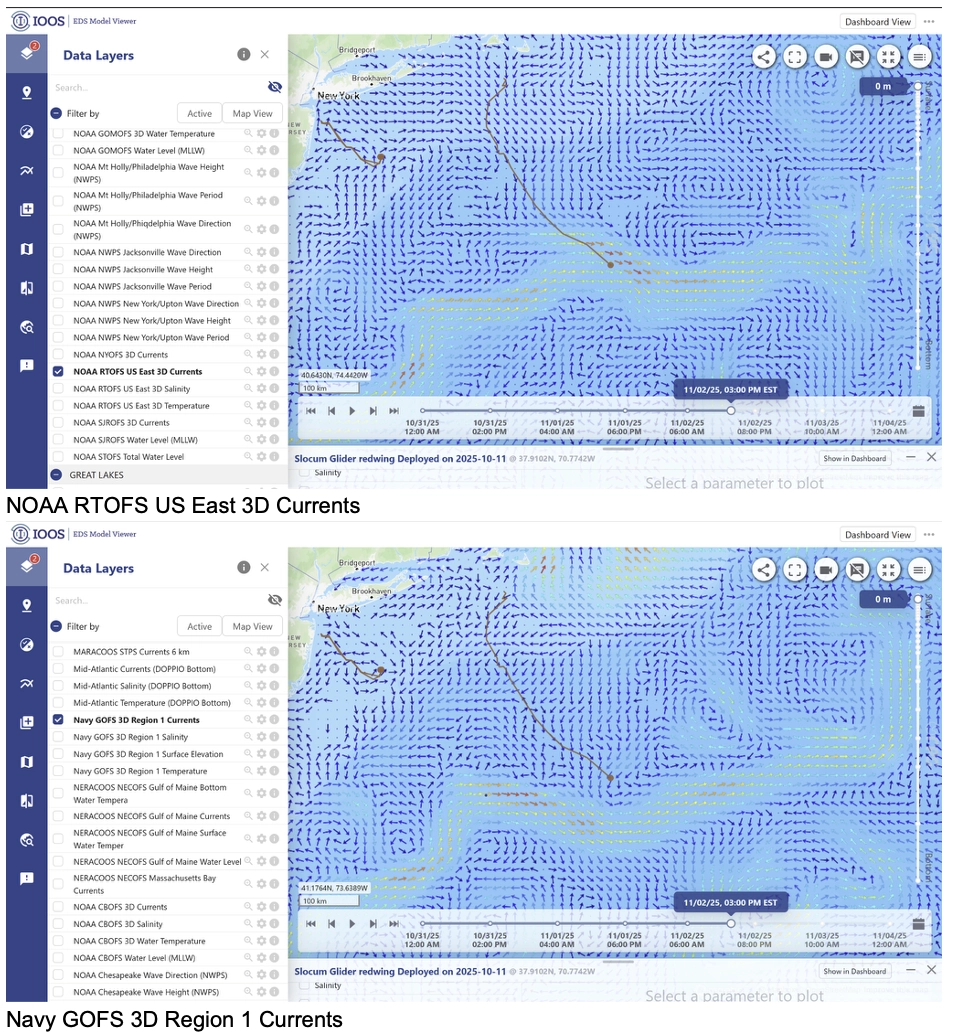
The NOAA Real-Time Ocean Forecast System (RTOFS) model shows that Redwing is currently in the Gulf Stream. However, the Navy Global Ocean Forecast System (GOFS) model shows that Redwing is just outside of the Gulf Stream. This begs the question as to which model is correct in this case.
As mentioned above, Redwing is currently moving at a speed of 1.2 km/hr, which is faster than the average speed for the entire deployment so far, which is 1 km/hr. This suggests that Redwing has, in fact, entered the Gulf Stream, as the NOAA RTOFS model suggests.
Engineering:
Battery Watt-Hours Remaining vs All Time:
As shown by the graph, REDWING expended a lot more energy from the battery within the first few days post-launch – the amount of battery used later stabilized, bringing us to about two days ago, where around ~4000 watts per hour were used.
Battery Watt-Hours Remaining vs Past Week:
Within the past week alone, a steady amount of battery power was used, likely due to the steadier nature of the currents it experienced. The glider will therefore have better long-term performance, such as a longer operational time and better reliability, which may also reduce maintenance costs – proof of the glider’s energy conservation design and strategies.
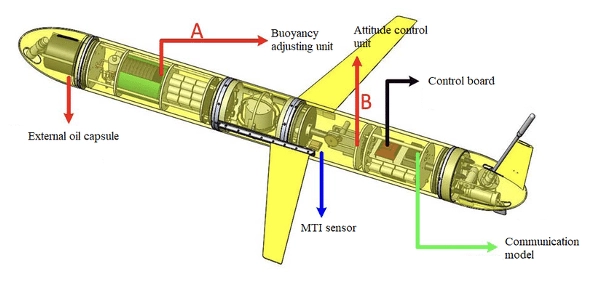
The battery itself takes up a significant amount of REDWING, which makes sense as it controls the navigational systems, the sensors, and communication equipment within the glider, as well as the buoyancy mechanisms
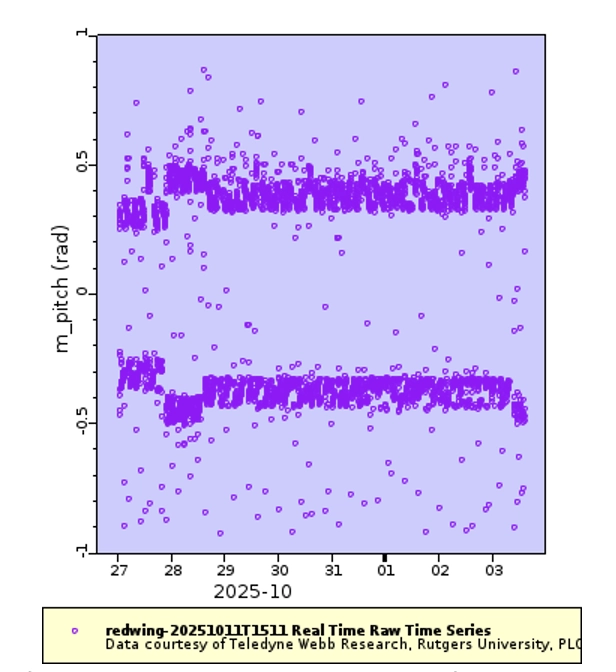
The pitch of a glider displays up-and-down movement, from head to tail. Pitch is essential for understanding REDWING’s descent and ascent to/from the depths. As you know, REDWING intakes water into her nose cone, causing her to tip forward and sink. To come back to the surface, she expels the water, and when she’s at the surface, the glider has a mechanism that acts like a swim bladder to keep her tailfin out of the water so she can communicate with satellites. This technique allows the glider to lean both front and back, which is why the dots that portray REDWING’s pitch are centered around two lines.
What’s curious is why the pitch is much closer to 0 than average for the first ~24 hours. The individual positive and negative pitches average to positive and negative 0.25-0.35. Then, it becomes much farther from 0, without explanation (average positive and negative 0.4-0.5). While this might be due to the glider simply encountering more wildlife in the beginning of its journey, what’s also curious is that the pitch has gone up again recently. Is this a pattern that we should notice, or just a coincidence?
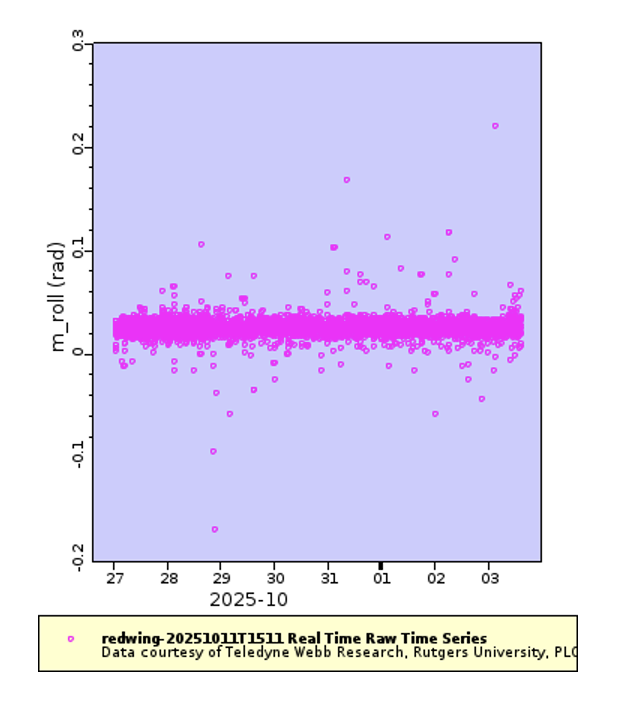
The graph above shows the glider’s lateral stability over time, or ‘roll’ (leaning on one wingtip while gliding, along the axis of head-to-tail). The calculations of a glider’s roll can shed light on two things: steering performance and the turbulence of the ocean currents.
Gliders are meant to stay around a steady 0o roll if the trip is a straight flight, or a non-0 ° number for deep dives. Because REDWING intends to climb deep depths from the surface and then climb back up to the surface level, it may experience turbulence while travelling through especially strong currents on one side. Looking at the data, it’s likely that this is the case – the average roll varies from this, at a little higher than 0. However, because it’s so consistently slightly above 0 (with outliers and other variations from the range 0.002 – 0.005), this begs the question of if there is something on the glider’s wing that is making it tilt that way, or are the currents and wildlife simply pushing the glider around?
A clue to why the roll is slightly above 0 is also the travel path of the glider. The glider turned left (at low but varying degrees of intensity) throughout its journey, which may shed light on our question.
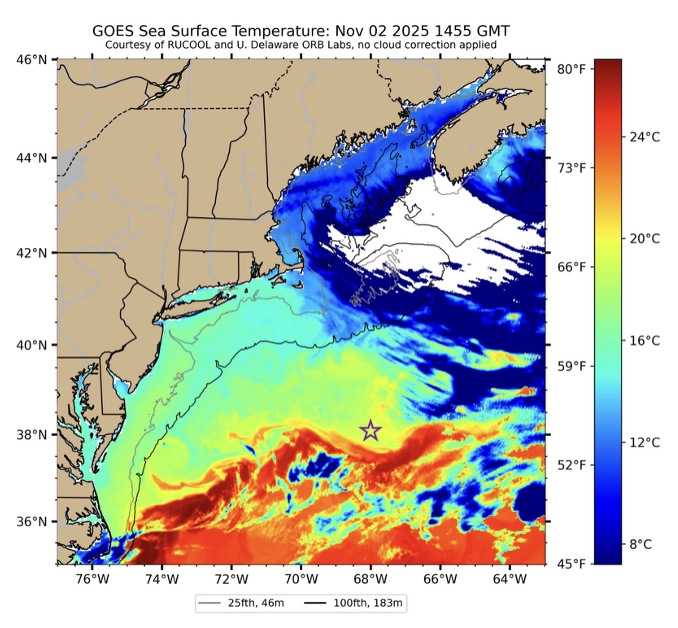
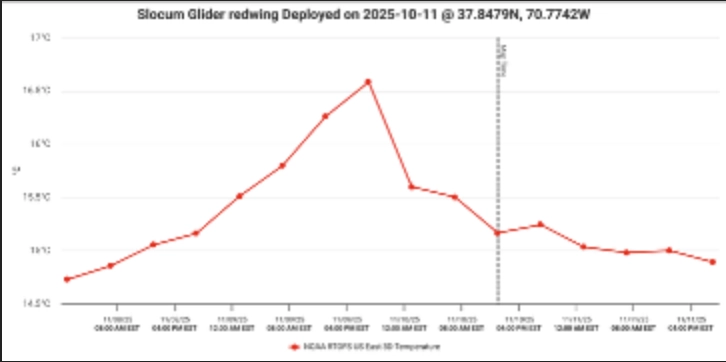
This map displays the current temperature in the Northeast region, where Redwing is currently gliding through, indicated by the marked point on the map. So far, the waters that the glider has journeyed through since deployment have remained on the cooler side, with the temperature staying between 14ºC and 19ºC at this time. As we head into the Gulf Stream, a significant change in the SST is shown.
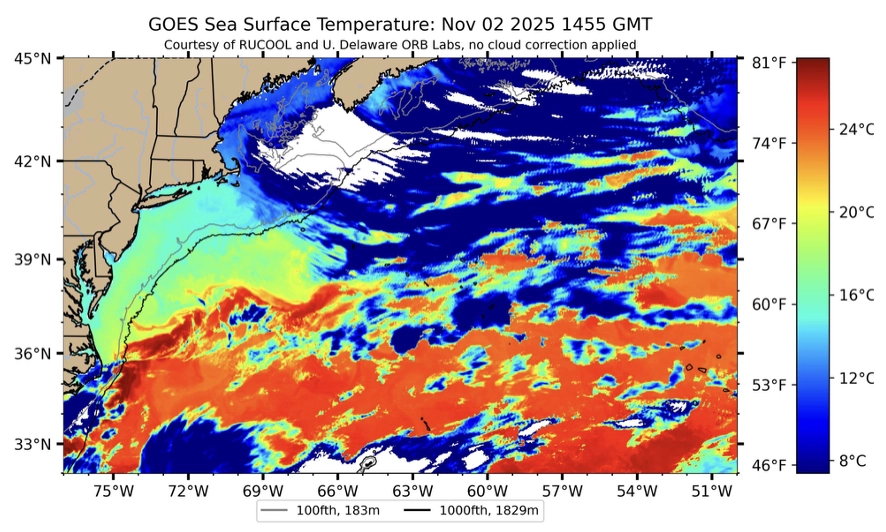
This is an SST image that is further East of where Redwing currently is and shows what the glider is likely to face in the near future. The Gulf Stream is more apparent, with current temperatures around 24ºC, which is a 5ºC change from the highest temperatures near the coast where Redwing has been. The higher temperatures suggest that more changes are to come when the salinity and density data are observed.
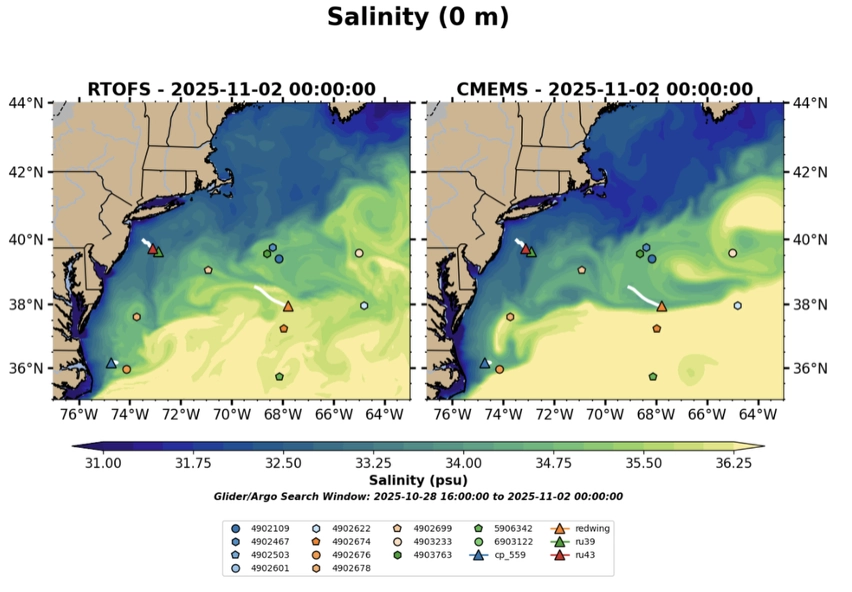 Moving on to another map, which visualizes salinity, there is a clear contrast between the coastline and where the Gulf Stream is in terms of the amount of salinity. As Redwing is entering the Gulf Stream, the salinity is upwards of 36.25 PSU in both the RTOFS and the CMEMS model. The area the glider has just passed through in the last few weeks has a salinity of 33 to 34 PSU, and this difference is showing one aspect of change in the data we will see as Redwing continues to enter the Gulf Stream!
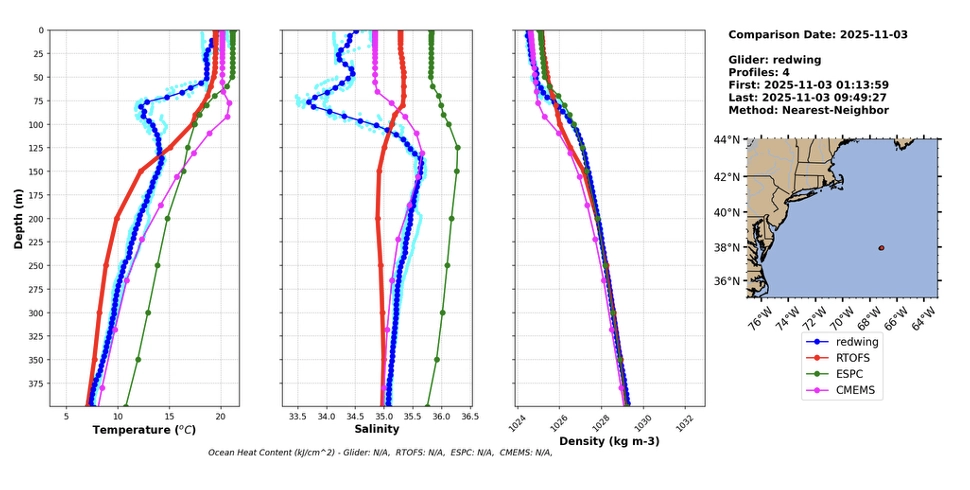
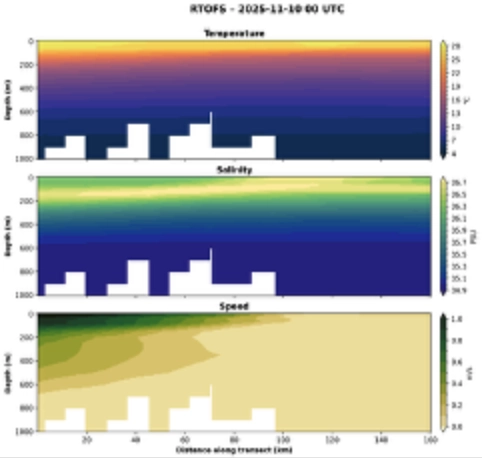
The comparative profiles of the water column above display the data Redwing has collected alongside the data of other predictive models. The light blue/cyan plot indicates all the data Redwing has collected across the depth of the water column, whereas the dark blue is a clearer trend derived from that data, making for an easier visual comparison against the other plotted models.
RTOFS stands for Real-Time Ocean Forecast System, ESPC stands for Navy Earth System Prediction Capability, and CMEMS stands for Copernicus Marine Environment Monitoring Service. Providing predictive plots from different sources against actual data collected helps to improve these models, and also encourages us to ask questions about anomalies or lurking variables that could be causing a deviation from the predicted data values.
The density profile is the closest match between the actual data and the predictions relative to the other two graphs. The density remains a similar value up to around 70 meters, at which point it starts increasing. This is because colder, nutrient-dense water sinks due to its higher density, leading to stratification. Deeper water is also compressed by all of the water on top of it. Think of a foam squishy toy, and now think of someone sitting on it. The foam, when it is compressed as such is denser than normal.
Temperature and salinity follow a similar general shape to the predicted trends, but they both have a downward spike around 75 meters that then gradually comes back up to fall in line with the other models. This could indicate a cold freshwater pocket, being that both the temperature and salinity are low. Certainly makes for a funky plot shape, perhaps even fresh, if you will.
Let’s hope that the Gulf Stream treats Redwing well in this next stage of her journey. See you in the next post!
School Group Blog 1: Spring 2025 School Broadcasts
Credits:
Aiden Blanos
Charlie Chuya
Sonia Chen
Marc Youhana
Paavni Vyas
Hello there everyone! Welcome to the first entry of the Sentinel Mission School Group’s blog. In the spring of this year, we hosted some virtual teleconference events explaining gliders and the sentinel mission. Today, we’ll be going through what was covered in those events! Each teleconference had 3 major sections, hosted by students in the Glider Lab, The Seawater Lab, and the COOL room. Let’s start off by discussing the Glider Lab!
Glider Lab
In the glider lab, we covered questions about what a glider was and how they worked. Let’s go over some of these questions and their answers!
Q: What is a Glider?
A: A glider is an autonomous underwater vehicle that collects data and it travels through the ocean without human help. Gliders stay in the ocean for months to collect data on temperature, salinity, pressure, and dissolved oxygen. All of this data helps to monitor the ocean and can help us do things like increasing our understanding of climate change, predicting hurricane locations and intensity, and mapping out and simulating currents.
Q: How does a glider move?
A: It takes in water and it sinks down. When it releases water, it rises up. It moves in an up and down pattern through releasing and taking in water. Additionally, it has an internal battery that can be used to power a small propeller; however, it is very energy hungry so it has to be used sparingly.
Q: What kind of data can a glider track?
A: The sensors collect scientific data such as temperature, salinity, depth, pressure, and chlorophyll to track and collect data. This data is used for scientific purposes such as hurricane tracking.
Q: How does the glider communicate with us? A: The battery powers a GPS tracker which shows where the glider is whenever it surfaces. It additionally powers the data transmission to Rutgers.
Seawater Lab
In the seawater lab, we mostly talked about how the glider was prepared to launch. The two main methods of preparation we went through were ballasting and compass calibration. We also convered the concept of the glider’s attitude and some hazards that Redwing would face on her journey.
Ballasting is a technique that is used to ensure that the glider is neutrally buoyant. We put the glider into a tank of water that simulates the conditions of the ocean where it will be deployed, and we then put weights into the different sections of the glider until it floats with the angle that we want it to float at. If our glider is neutrally buoyant, then it will be able to tilt up or down with the proper amount of effort. Additionally, if we ballast the glider to where the tail would peek above the ocean’s surface, the sensors in the glider will have a significantly easier time transmitting data to and from where it needs to be.
Compass calibration is a bit more straightforward. In order to calibrate the compass of the glider, we hang it up with a crane so that it can be aligned with the magnetic north pole.
The Glider’s attitude is the angle of its body in the water. The instruments in the glider can sometimes cause the glider to be unbalanced, so we need to work to make sure that it’s balanced so that it can go through the water column smoothly.
Now, let’s talk about some of the hazards that a glider can face on its journey.
The main hazards we covered originated from animals and people. Some of the animal hazards included barnacles sticking to the glider and causing drag and attitude, remora sticking to the bottom of the glider and weighing it down, and giant squids or great white sharks attacking the glider for one reason or another. The human hazards included getting hit by a boat, getting microplastics inside our buoyancy pump and clogging it, getting tangled up in fishing nets or macroplastics, and even getting the glider stolen and held for ransom!
COOL room
In the cool room, we talked all about data and the impacts it could have on society.
Scientists can utilize data from gliders in research of water quality/conditions, hurricane and weather forecasting, megafauna research such as whale abundance, and taking data averages to understand long term effects of planetwide processes such as climate change.
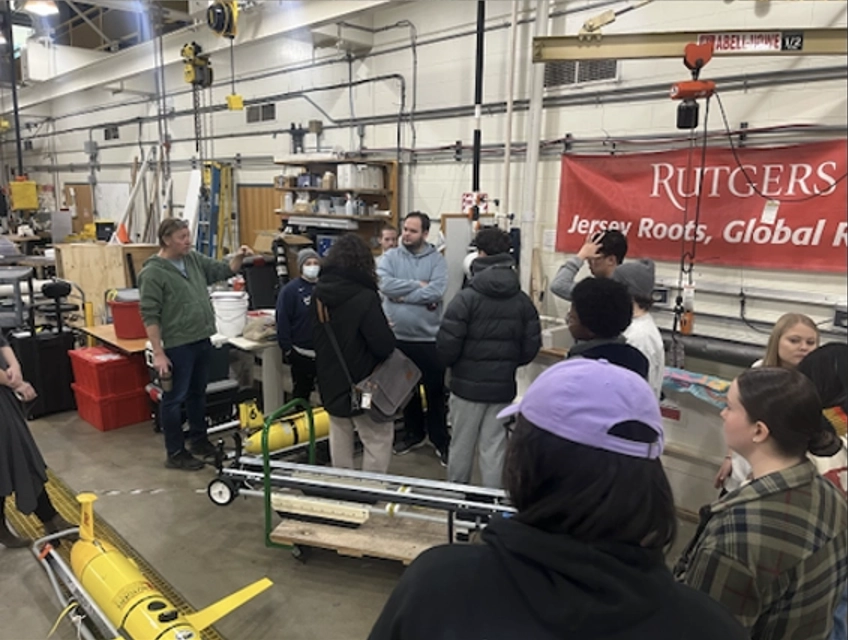
People other than Rutgers scientists can use our data as well! Fishermen can utilize data for more reliable predictions of fish stocks, Lawmakers can refer to our data when considering new policies and the military can use our data to support their models, allowing them to get accurate readings of weather and currents for more effective transportation and marine deployments!
Alright everyone! That’s all we have for this entry of the Sentinel Mission School Group blog. Be sure to check back soon for more! Sea you later!
Sentinel Mission Blog Entry 2
Entry written by:
– Payton Mulligan, Biology, Class of 2029
– Emma Feehan, Physical Oceanography, Class of 2028
– Sarah Taylor, Ecology, Evolution, and Natural Resources, Class of 2027
– Angelina Dominguez, Marine Biology, Class of 2027
– Marc Youhana, Marine Biology, Class of 2027
Hello there everyone! Welcome back to the Sentinel mission blog! In this entry, we’ll be covering the second week of Redwing’s deployment. Let’s get started!
In 1989, Oceanographer Henry Stommel imagined a future where underwater robots, not ships, would pave the way for ocean exploration. His essay “The Slocum Mission” read like science fiction at the time, but in the face of various environmental threats, it underlined the need for a more effective way to accumulate ocean data. His story proposed that an underwater robot would “generally broach the surface six times a day to contact Mission Control via satellite” and “migrate vertically through the ocean by changing ballast”. Stommel invited readers to imagine scientists at Woods Hole Oceanographic Institution drawing prototypes in the attic lab of the Bigelow Building. Decades later, that vision has come to life. Redwing was launched right next to the Bigelow Building – the place where it all began. As our second week of data rolls in here at our own ‘Mission control’, let’s continue to explore the ocean in this new age of autonomous discovery.
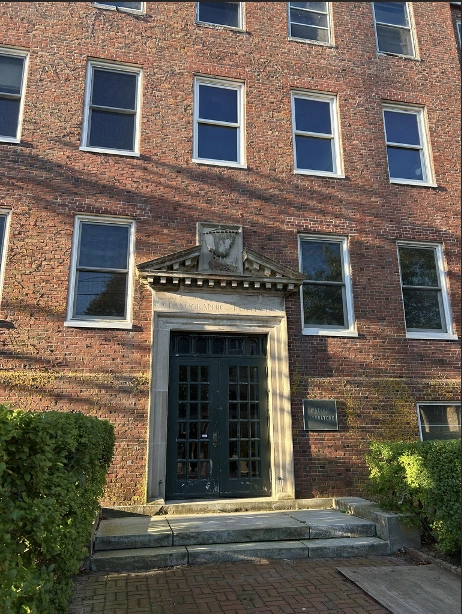
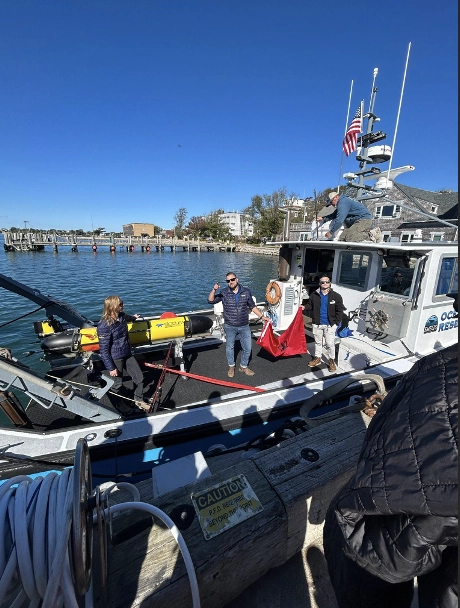
Fig. 1 Bigelow building at Woods Hole Fig 2. The Redwing launches right next to the Bigelow Building
The Navigation
As shown in the image below, taken from Google Earth, you can see that Redwing has officially made its way past the continental shelf represented by the dark horizontal line across the screen. In the last blog, the glider was just crossing through, but now it has successfully crossed the shelf! This means that the glider has made it into deeper water. Within the last week, the glider has traveled 155 kilometers
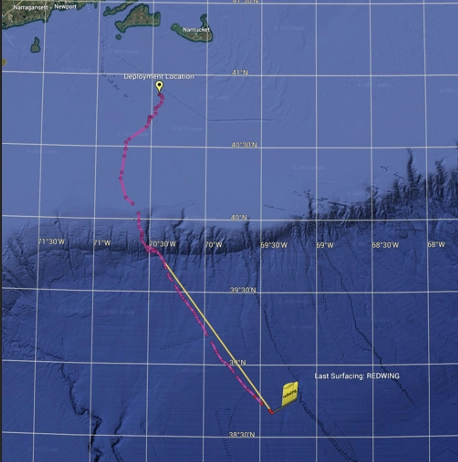
When taking a closer look at the path in the image below (sourced via Google Earth), you can see that right around the shelf, the glider circled a couple of times around in the same area before continuing its path. This is most likely due to strong currents, which can stop a glider in its tracks
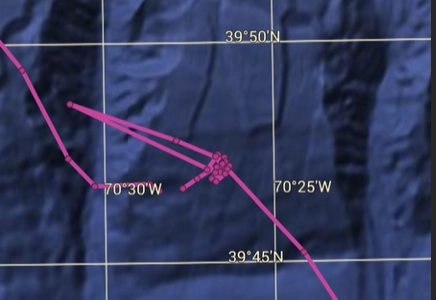
The Engineering
When the Sentinel mission launched on October 12, 2025, the system’s battery had an estimated 25,300 Watt hours (Wh) of energy. (A watt hour is a unit of power usage that describes how many watts of power are used in an hour). After one week of operation, on October 19, 2025, the capacity dropped to about 23,800 Wh, indicating an average consumption rate of around 208 Wh per day.
By October 25, 2025, the battery was calculated to have about 23,000 Wh. This came out to roughly 117 Wh per day. This slower rate of depletion reflects a change in the glider’s operation. During the first week, Redwing was in “bathtub mode” to reach the continental shelf break quickly. Bathtub mode is when the glider uses shallower dives and activates its rear thrusters to reach its checkpoint quicker. Once it resumed its buoyancy-driven propulsion, its energy consumption dropped significantly.
So far, the glider has consumed about 9.01% of its total battery!
All data shown were retrieved from NOAA’s ERDDAP database.
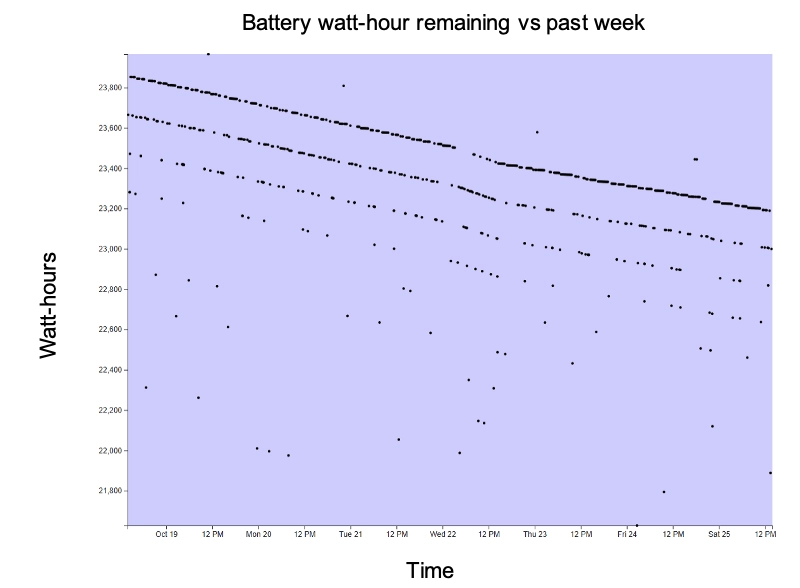
This graph shows how many watt hours of battery were used from October 18th to October 25th. We placed watt hours on the vertical axis and time on the horizontal axis.
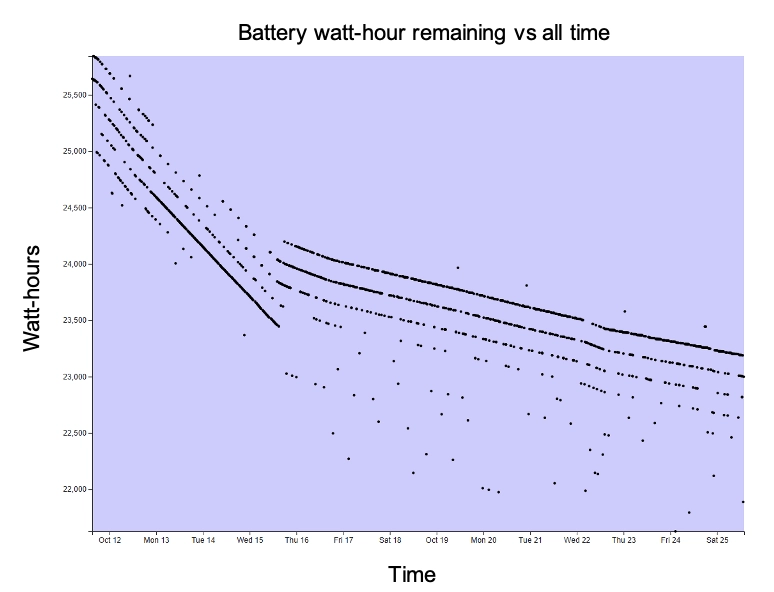
This graph was created using all the data that we have so far for watt hours of battery. Our timescale is from October 12th to October 25th. We placed watt hours on the vertical axis and time on the horizontal axis. The rate of battery usage has a very steep decline for the first few days, which aligns with the glider performing a bathtub maneuver.
These battery graphs show several parallel lines when plotting the remaining watt-hours. This pattern appears because each value represents the power usage at specific moments in time. The Sentinel operates at different voltages depending on its activity. For example, it draws more energy when adjusting its pump compared to when it’s gliding steadily and collecting data.
The pitch of the glider is the angle that the body is turned as it travels through the water. Since October 16, 2025, the pitch has remained fairly steady, oscillating between 0.45 and -0.45 radians, coinciding with the glider’s commanded pitch. When converted to degrees this means Redwing is traveling at an angle between 25 and -25 degrees. This range in the angles is ideal for maintaining the regular sawtooth motion of the glider. Starting on October 23, 2025, the commanded pitch decreased to ±0.12 radians (-6.9 to 6.9 degrees) and later ±0.07 radians (-4.07 to 4.07 degrees). The pitch returned to ±0.45 radians (-25 to 25 degrees) by October 25, 2025. The decrease in pitch represents the portion of time that the glider is utilizing Bathtub Mode. The motion of the glider is during bathtub mode is shallower than in sawtooth, creating a decreased angle of motion.
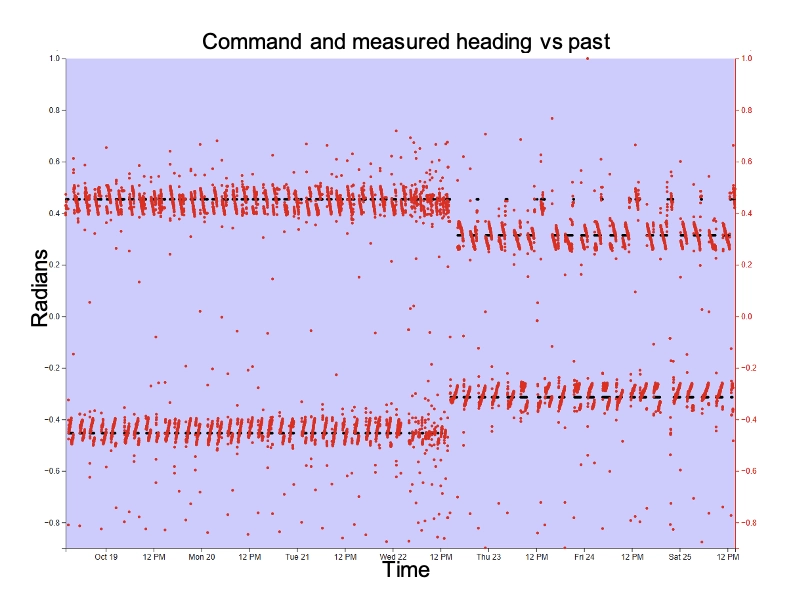
In this graph, the black points represent the commanded pitch, while the red points represent the measured pitch. The measured pitch closely follows the commanded values.
The following graphs are the measured pitch over the past week and for the entire mission so far. We placed the radians on the vertical axis and time on the horizontal axis.
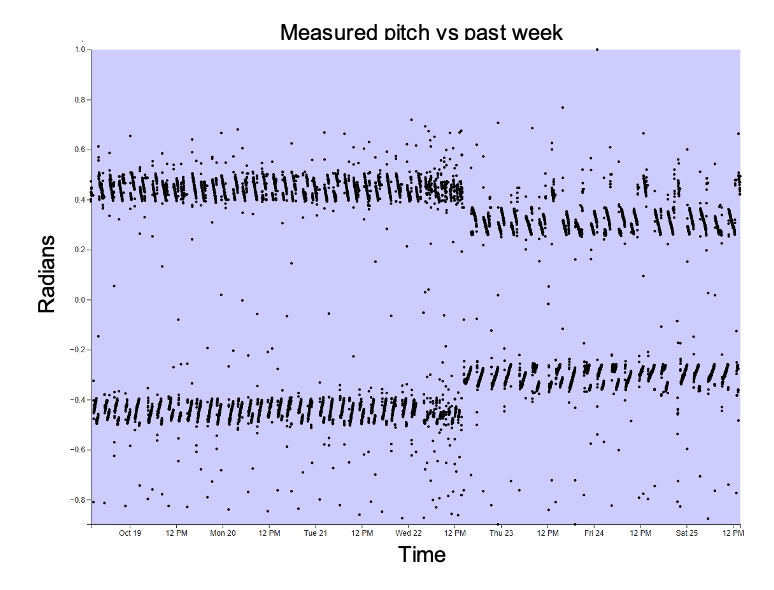
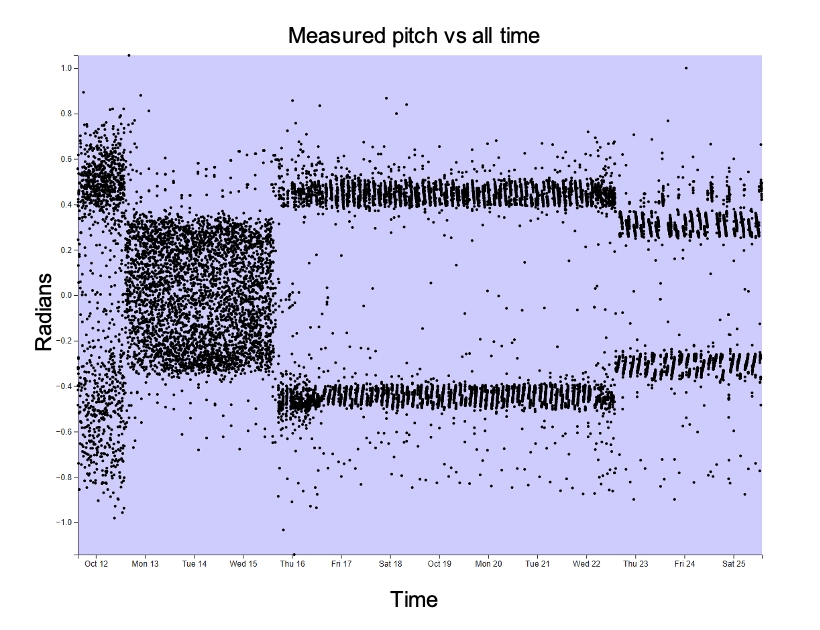
The roll of the glider is the angle that the nose is facing in comparison to the angle and the nose during a dive. Roll measures whether a glider is leaning during a dive, hence the term “roll”. The glider’s roll has generally remained stable and close to zero, where it should remain to achieve best efficiency. However, there has been one noticeable outlier on October 24, 2025, when the roll briefly reached 0.16 radians (9 degrees). This spike could have been due to turbulence, surface wave action, or other environmental disturbances in the water column!
The following graphs display the measure roll over the past week and over the full mission, once again with radians on the vertical axis and time on the horizontal axis.
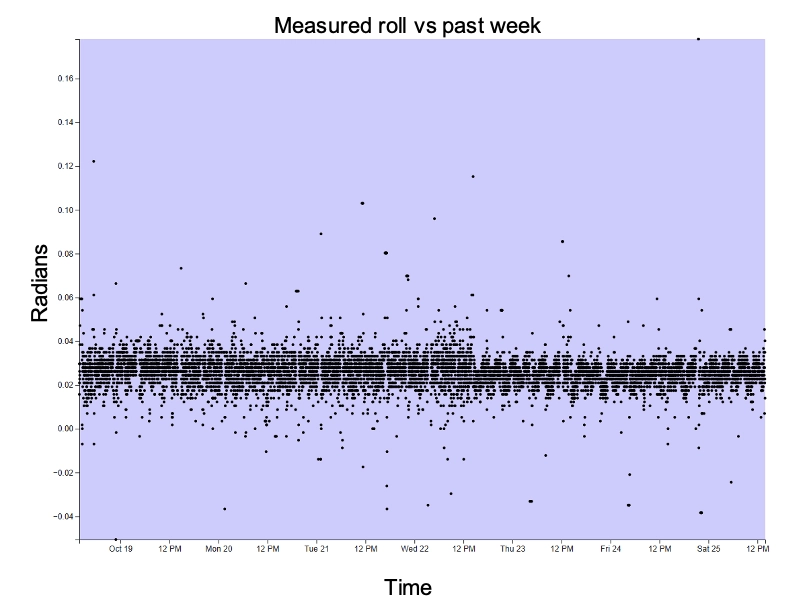
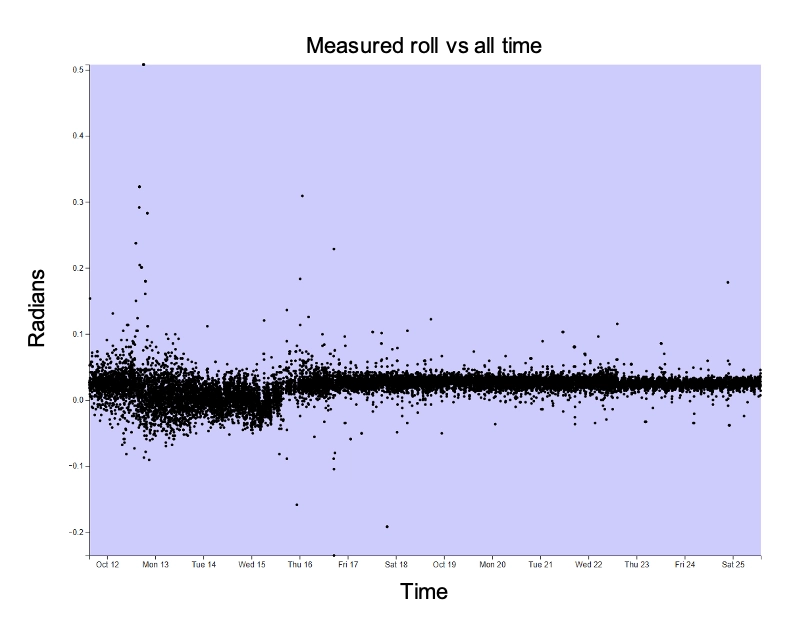
The Science
Unmanned machines like our glider Redwing are one of the little robots that Slocum talked about back then, and so far, she’s been doing a great job at collecting data for us!
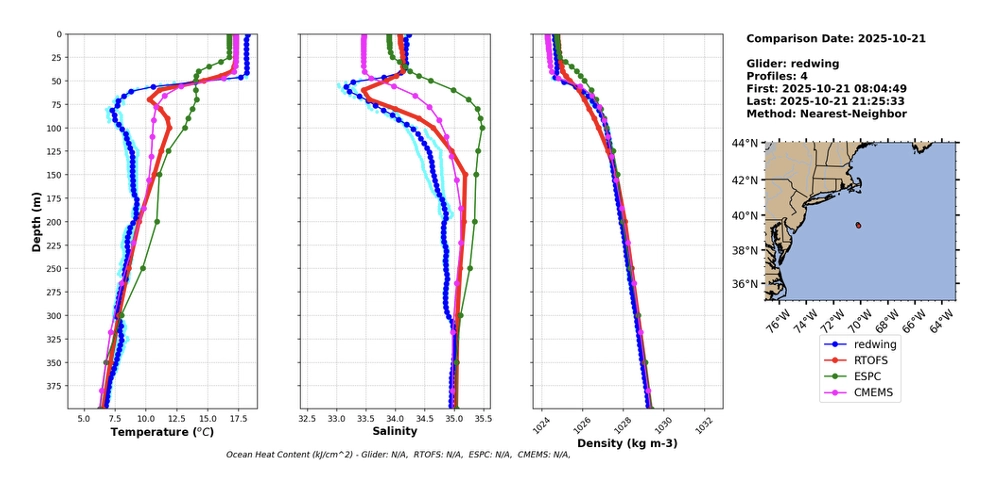
In the previous blog, it had only been a few days since Redwing had launched, so we didn’t have as much data as we do now. So far, Redwing has collected data from at least 375 meters deep (~1,230 ft, that’s a bit deeper than the deepest open circuit dive record!) and reported back. These 3 graphs you can see show the data that Redwing, which is the dark blue line, has collected on temperature, salinity, and density of the water as she dived on October 21st.
The data she’s collected is being compared to the RTOFS, ESPC, and CMEMS models. These models are predicted datasets that Redwing’s data is being compared to. For density, all the models seem to be quite closely; while salinity and temperature show some slight differences. Essentially, Redwing is saying that the temperature is colder than what the models are saying and that there’s less salt in the water column than what the other models said.
These three graphs highlight steep changes in measurements past 50 meters. This is primarily caused by the physics of the ocean. Colder water is denser and therefore sinks while the warmer water is lighter floating in its own sort of top layer. This is called stratification and it can be further amplified by differences in salinity and pressure. A way to visualize it is to think about what happens when you layer oil and water on top of each other!
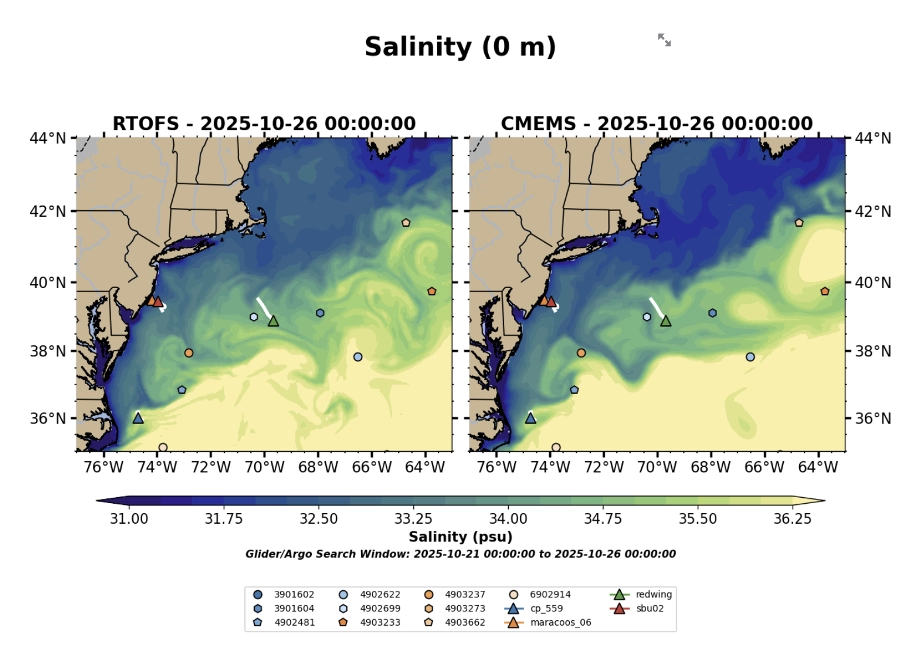
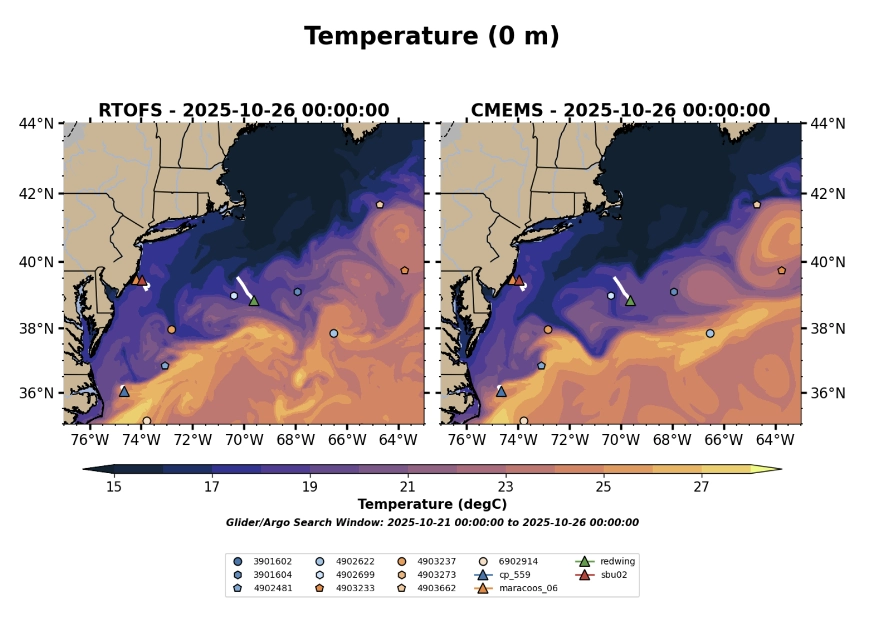
These graphs help us visualize the position of redwing and some of our other ocean machines in the ocean, and what the ocean is looking like based on the RTOFS and CMEMS models. In both graphs, the vertical and horizontal axes represent longitude and latitude, and the shapes represent our ocean data measuring devices. Redwing is the green triangle! In the first graph, the color scale defines salinity in units of psu, with dark blue representing low salinity, and yellow representing high salinity. The color scale of the second graph defines temperature in units of °C, with dark blue representing colder temperatures and yellow and orange representing warmer temperatures.
Soon, Redwing will enter the Gulf Stream, which has saltier and warmer water than the water off the coast of the Northeastern U.S. If you look closely at these graphs in the area where the temperature and salinity are at their highest, you should be able to see part of it! The gulf stream carries warmer, saltier water from the gulf of Mexico all the way to Europe. What that means for Redwing is that she can use it to cut our travel time to the Atlantic ocean by a significant amount!
Alright everyone, that’s all we have for this week’s entry! Be sure to check back next week for more. Sea you later!
Blog entry October 22nd 2025
Student authors
Vangelina Clark, Marine Biology, Class of 2029
Anastasia Angarone, Marine Biology, Class of 2028
Sydney Chung, Marine Biology, Class of 2029
Maureen Scully, Marine Biology, Class of 2026
Roshelle Gungon, Biotechnology, Class of 2029
Woods Hole, Massachusetts, is home to an amazing Oceanographic Institution. This location was picked to launch REDWING in honor of Douglas C Webb, or as most know him, Doug Webb, and the time he had spent there. Webb’s initiatives, research, and passion for the ocean helped build the stepping stones to the research and gliders we have today. Webb was the founder of Teledyne Webb Research, an organization along with many others who are working on the Sentinel mission. Webb left a major impact, leaving us with the following words: “Work Hard, Have Fun, Change the World.”
Within the following days after the launch on October 10, 2025, the REDWING glider was switched to working on a Ctrl-R script. This was due to a minor issue and a Northeaster that occurred from (October 12 – October 13, 2025) that was blowing over the East coast. This kept the glider underway and out of the path of the rough surface conditions. Since this script was running, the glider was sending back minimal data, so there are a few gaps in the data collected. Although, as of October 16, 2025, the glider is very close to the shelf break, and once in deep water, it will resume normal data collection.
The Redwing glider has already gone through many processes to get into the ocean, but to complete its main goal, understanding the navigation for the glider is an extremely important process. There are multiple types of data we can look at, one of them being the overall path and distance the Redwing glider has taken. We know that the glider’s overall path in its first leg is to go from Cape Cod to the Canary Islands, but we can look deeper into the path for Redwing.
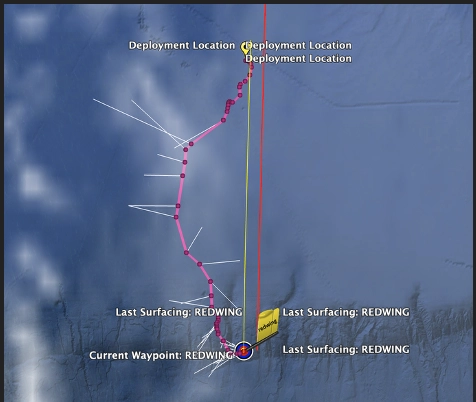
As we can see with the image above (from Google Maps), the overall path of Redwing is shown. The pink line represents the actual path, and the dots are specific points that the glider has passed. The white lines represent the currents the Ringwing has experienced as well. Just analyzing the path of its own, we can see that Redwing has gone through some interesting ocean currents with the dots that were recorded.
We can also take into account the overall location Redwing is at towards the bottom of the image, we see a dark line. This dark line represents the shelf, and with the current location the glider is at, it has approximately traveled 120 km from its starting point. We can also determine that Redwing is actually at the edge of the shelf, and its journey will get a little more complicated over the following weeks. But from this image alone, we cannot truly justify just yet that Redwing has been accurate. We can actually view the data for the accuracy of Redwing’s path. We can compare Redwing’s calculated path to its measured path.

The plot has both red dots and black lines. Usually, the dots should align with the black lines, which would signify the overall accuracy of the glider trajectory. The black dots represent c-heading (the way the glider is calculated to go), and the red dots represent m-heading (the way the glider is actually going). We can see that its overall measured heading alignment is not the same as the calculated heading. As a comparison, below is a graph of RU29 (another glider flying in a local region). We can now see that Redwing’s accuracy with staying on the path has not been so smooth after all, in comparison to RU29. Regardless, with the proper planning and endurance Redwing will eventually be able to closely follow its calculated path.
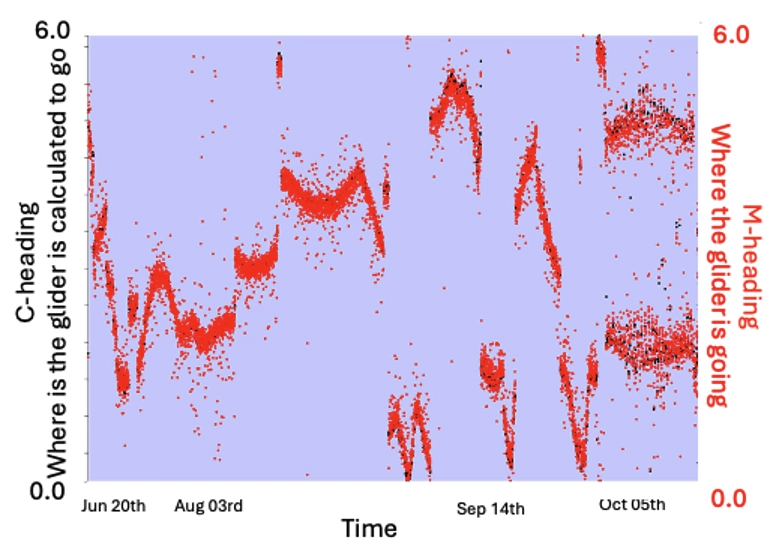
The following plots show information on the battery usage, pitch, and roll.
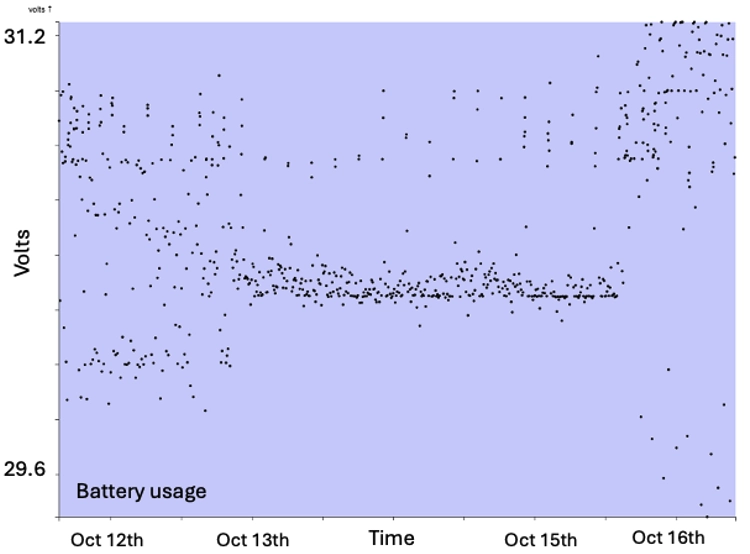
On the day of launch, there was much higher voltage being used; on the 13th, the volts steadied out to between 30.2 and 30.4. The first day likely had more turbulent waters, which caused Redwing to need to use more battery. This is also due to the glider using its turbine to reach the shelf break faster.
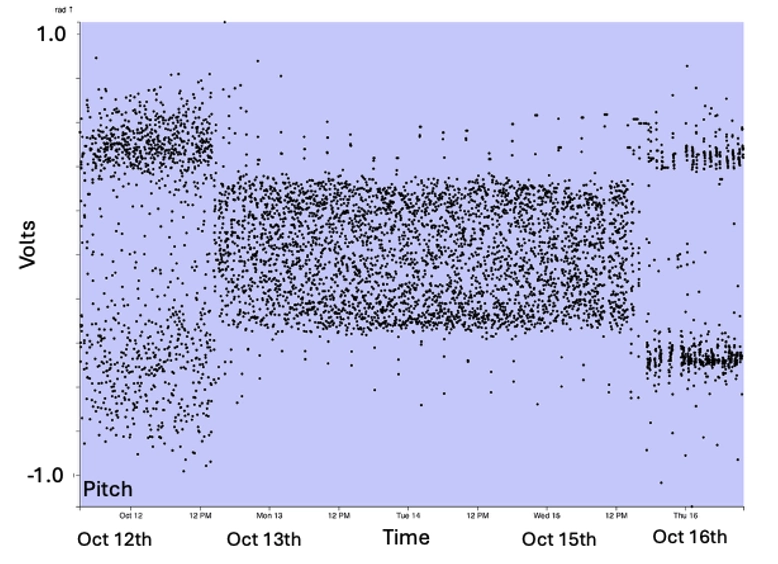
Looking at the pitch of Redwing, you can see there was an average pitch of 0.5 for the first two days of the journey, and by Monday, it balanced itself out until Thursday morning, where the pitch returned to 0.4.
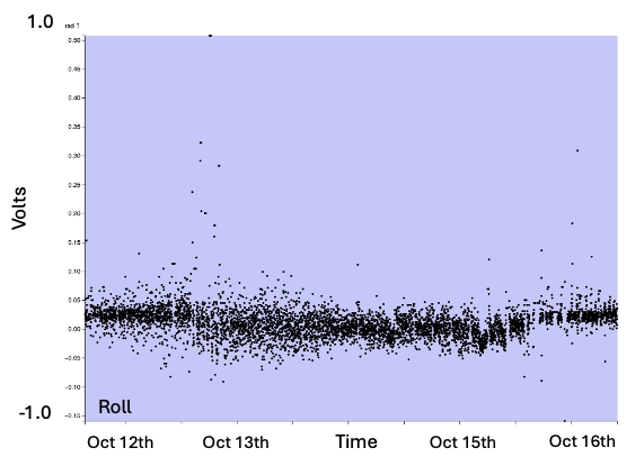
The roll stayed consistent between 0.1 and -0.05 with one exception on the night of the 12th, where the roll reached 0.5. Overall, the first day seemed to have turbulent waters, as seen by both the battery voltage and the pitch of Redwing straying from the average. Since Monday, there seemed to be a leveling out with Redwing’s changes in movement.
The next portion will look at some of the data that Redwing has collected so far on its journey.
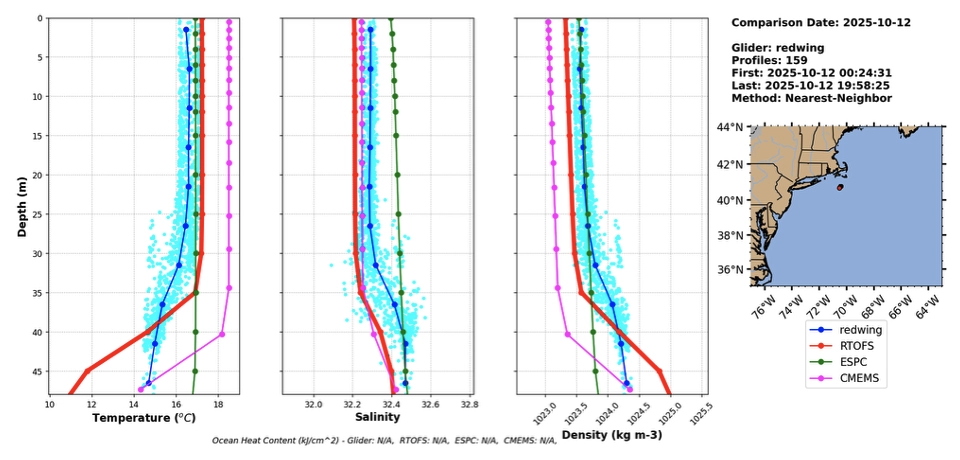
The blue line is redwing, and the data it has actually collected, compared to the “model” data of previous gliders, is what we currently have available to compare.
Looking at the graph, we can see the Sentinel’s depth vs temperature data is similar, but not identical to previous gliders that have traversed this area. For example, the data collected from the Redwig glider has a less drastic change at about 35 meters (m) in depth than the RTOFS or the CMEMS, but a slightly more prevalent change in temperature at said depth than the ESPC glider. There are several reasons that the graphed data may not be uniform, including vertical stratification, wind-driven mixing, or something as simple as slightly differing flight paths due to currents or other environmental factors.
Like the temperature data, the salinity graphs between the four gliders are similar, but not the same. Of the three data sets displayed above, the similarity between the salinity data collected by the different gliders are more alike than the density or temperature data collected by the autonomous underwater vehicles. The salinity data may be different between these gliders because of subsurface mixing or differing flight paths, comparable to the reasons given for the temperature vs. depth graph. It is assumed that the data across the displayed gliders will never be completely identical, given all the differing factors in the ocean that affect both the physical path of the glider and the physical/chemical state of the ocean.
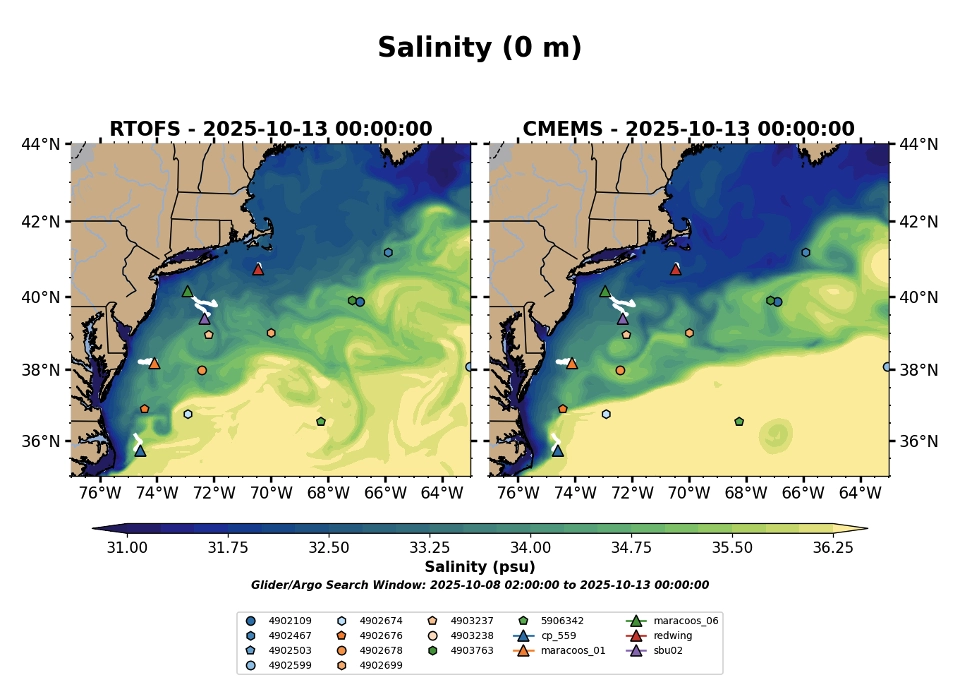
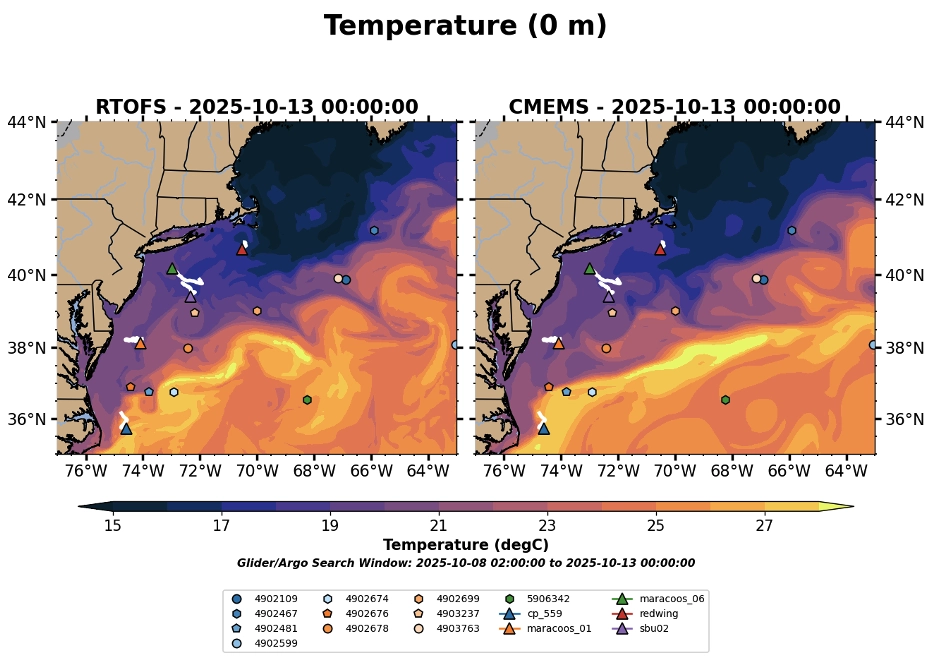
Redwing is represented by the red triangle. The maps were created on Sunday, the 12th of October 2025, but they depict the first set of data collected by Redwing, presumably on the first day of data collection. There is uncertainty regarding the time difference between when Redwing gathered the data and when the model comparison maps were updated. The first map displays the salinity concentration in the Mid-Atlantic Bight, while the second map illustrates the temperature of the area.
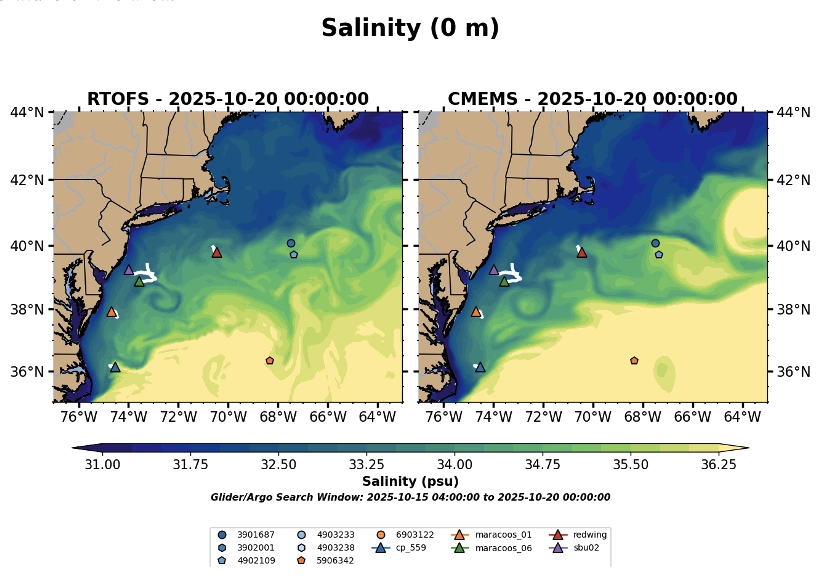
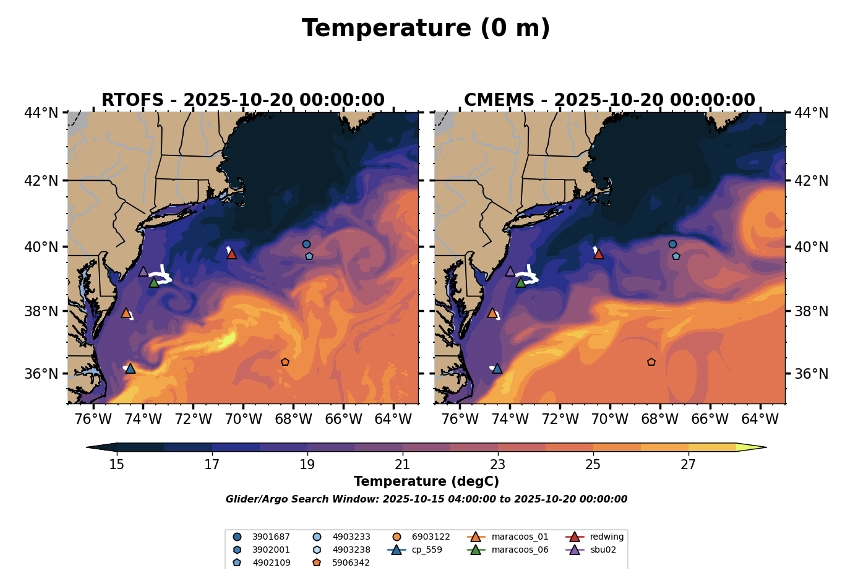
The two maps illustrate the data collected by Redwing after its first 10 days at sea. The white line emanating from the center red triangle indicates the path the vessel has traveled, showcasing the distance covered. Additionally, the maps depict changes in salinity and temperature of the surrounding water, measured from the initial data collection on the 12th to the most recent on the 18th of October 2025. These variations provide valuable insights into the area’s ecological conditions and inform future research efforts.
The Sentinel Mission Begins September 10th, 2025!
After a decade of engineering by Teledyne, and 5 years of planning with the scientists and students at Rutgers University the Sentinel mission begins. The goal is to circumnavigate the Earth’s Ocean following classical nautical rules. The robot to tackle this mission is a state-of-the-art new buoyancy driven system named RedWing. It stands for the Research & Education Doug Webb Inter-National Glider – which will now surf global ocean currents on its epic mission gathering critical ocean data from under-sampled, remote regions of the globe.

The RedWing sentinel glider!
A basic definition of a global circumnavigation would be a route which covers roughly a great circle, and in particular one which passes through at least one pair of points antipodal to each other. For around the world sailing records, there is a rule saying that the length must be at least 21,600 nautical miles calculated along the shortest possible track from the starting port and back that does not cross land and does not go below 63°S. It is allowed to have one single waypoint to lengthen the calculated track. The equator must be crossed. The current proposed path is below.

The RedWing sentinel glider’s proposed path. The spokes out from the path indicate possible offramps to locations where repair/rescue missions can be conducted.
The Sentinel glider was turned on September 10th 2025 in Woods Hole with wonderful celebration of the mission with Teledyne Marine, Rutgers University, and Woods Hole Oceanographic Institution. The glider if successful will stay on as it surfs underwater from Cape Cod to Canary Islands. There we will do inspection, replace batteries with the next goal being Cape Town South Africa. As part of that celebration 20 Rutgers undergraduates joined the event as over the last 3 years they have designed/built navigation tools using state of the art ocean forecast models, analyzed test flight data of Redwing, created hazard maps, and conducted outreach to K-12 school children across the United States.
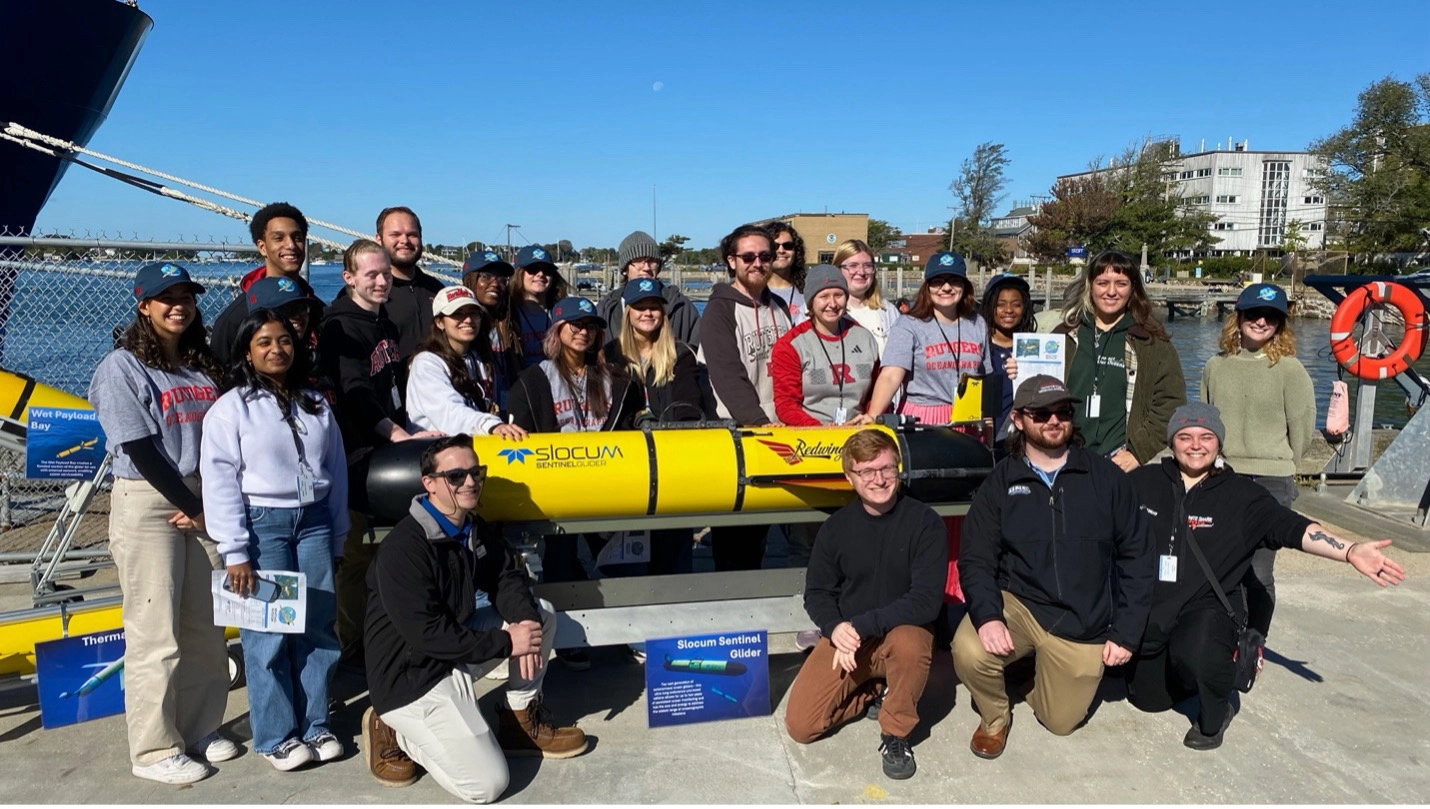
The amazing Rutgers current and alumni students present at the launch ceremony of the Redwing glider.
The glider was officially sent out on the journey October 11th at dawn (see below). The journey begins with Redwing being slammed by a Nor’easter storm less than 12 hours after launch. Coming blogs will highlight the data, the history and the adventure as it unfolds in real time. Come join our team and let’s get Redwing home safely in spite of sharks, giant squid, pirates, storms, and the unknown.
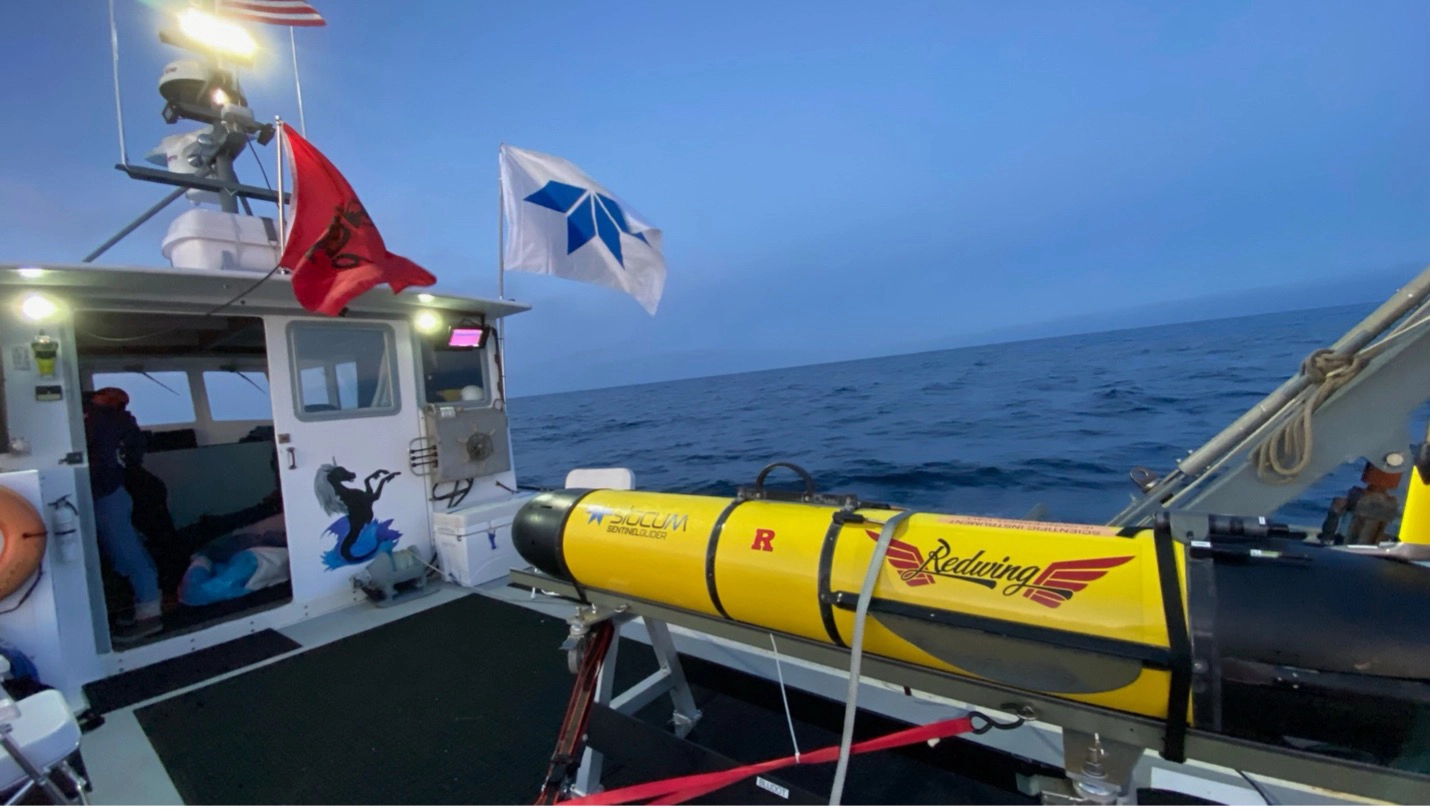
On location getting ready to launch!
This epic adventure with no guarantee of success now begins with much public interest (see below for local NJ headline but the story was picked around the world by news outlets).
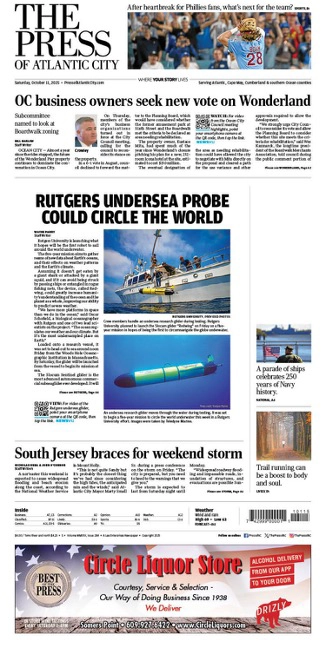
When going to sea, one often salutes those heading out, and my personal favorite mantra comes from my friend Antonio Ramos, so to Redwing I toast tonight “Force, Wind, Sea and Honor”
Oscar Schofield
Spring 2025 Blog Entry 6 – Sentinel and Slocum
Hello everyone! We’ve got a bit of a shorter entry today. We’ll be looking at some data from the Sentinel Gliders that are down in San Diego and comparing them to the standard Slocum Gliders! Let’s get started!
Before we get into the data, let’s get into who is looking through it. Our class, Topics in Marine Sciences, is currently organized into 3 major groups, with some offshoots and independent projects such as the Hazards Group and the Sentinel Bloggers.
The Pathfinding group focuses on planning the routes that the sentinel glider is going to take on its journey. The uncertainty maps that we showcased in previous entries fall within their domain. The Outreach Group is focusing on spreading the word of the Sentinel Mission all over, from local municipalities to the other side of the world. Right now, the Outreach Group is in the middle of its school outreach meetings, which are going quite well. Lastly, we have the Data group, whose primary focus is looking through and working with data. Students in the data group have been learning to use python to visualize data and construct comparative graphs, some of which we will be looking through today!
In order to not make any mistakes, our explanations for what each graph means have been graciously provided by the data group! Thanks data group!
- Graph of Horizontal velocities for the Slocum and Sentinel Gliders
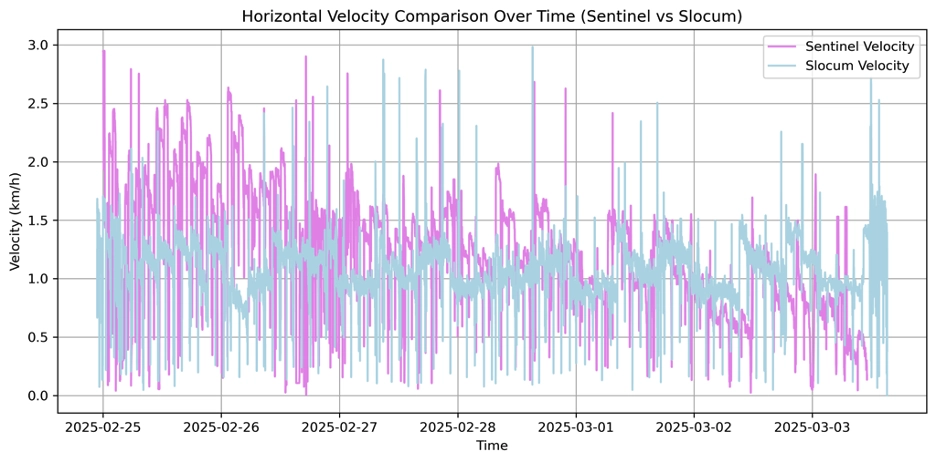 This plot describes the difference between the horizontal velocities of the Sentinel glider and the Slocum glider. As you can see, the Sentinel glider generally has a higher horizontal velocity than the Slocum glider, but there still are some points where the Slocum has a higher horizontal velocity. The difference in flight parameters for each glider likely explains this difference.
 - Slocum and Sentinel Glider Salinity Readings
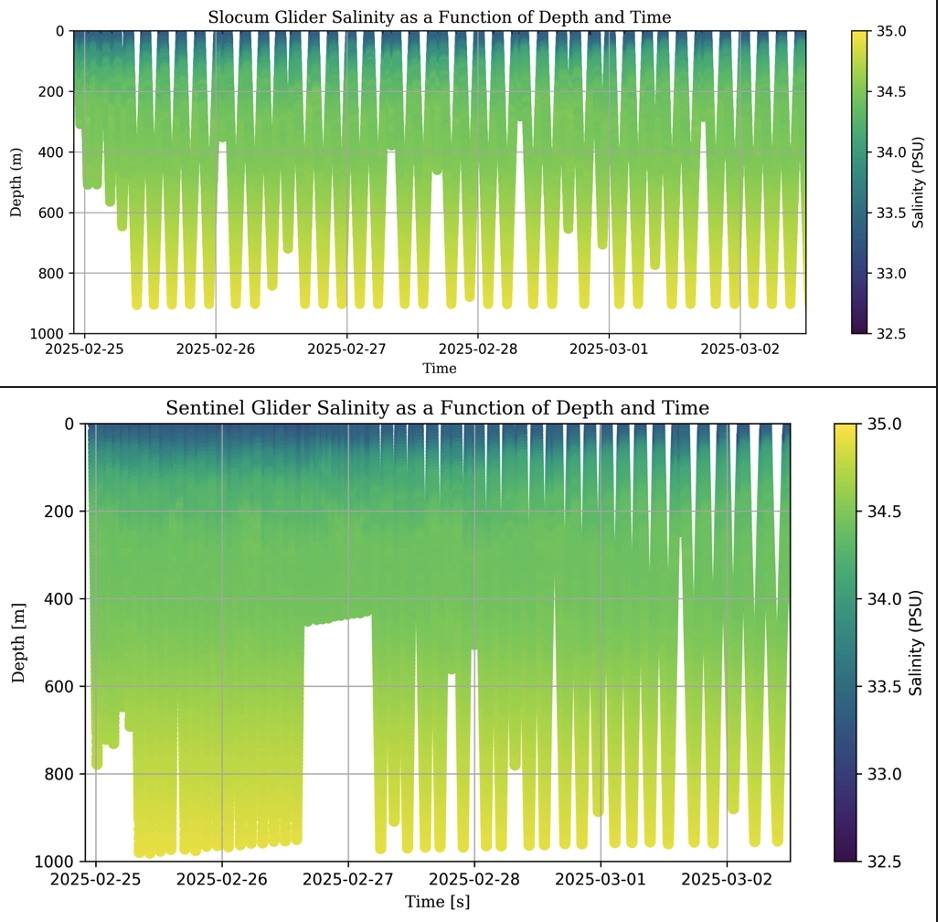 As you can see on the graphs, both the sentinel glider and the slocum glider were run on the same timeframe and in similar depths, but the visualization of salinity in parts of the sentinel graph looks more complete. This could be because the sentinel glider has greater average speeds and a larger battery, making more frequent dives possible.
 - Graph of Vertical Velocity for Sentinel and Slocum
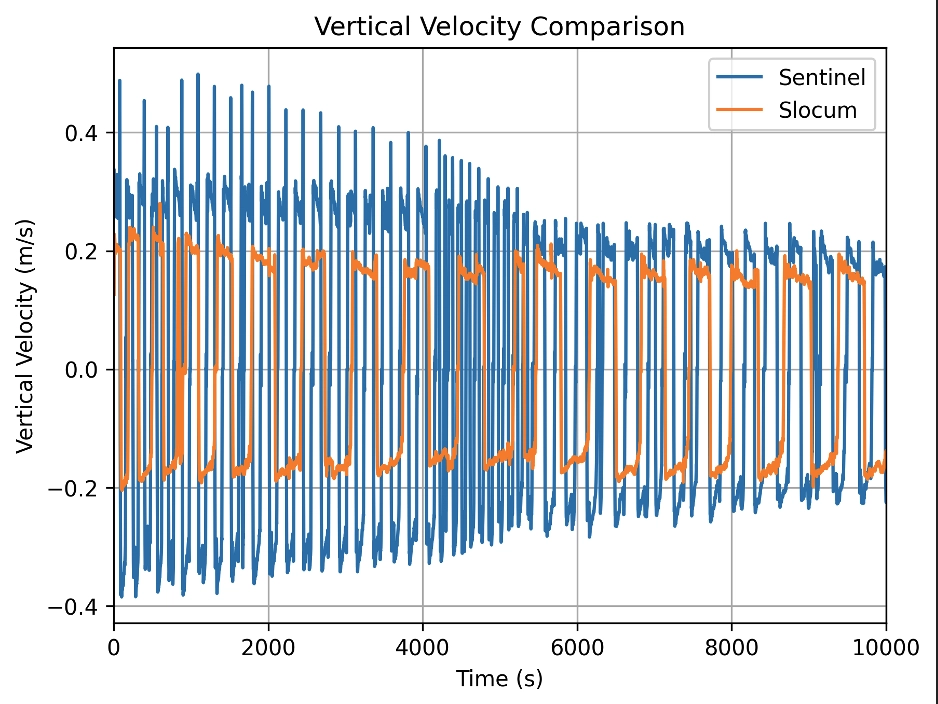 This graph shows a comparison of vertical velocities between the Sentinel and Slocum gliders over time. Looking at the graph, we can see that the Sentinel glider operates at a significantly higher velocity than the Slocum glider. Sentinel exhibits more frequent and more significant fluctuations in velocity, indicating that it ascends and descends much faster. In contrast, Slocum maintains a more stable and slower vertical movement. Over time, both gliders’ velocity variations stabilize somewhat, but Sentinel consistently shows greater speed. The difference in speed is due to the difference in the size of the buoyancy pumps.At the start of the graph, the Sentinel glider has a 99.98% difference in velocity compared to the Slocum glider. This is consistent with our data that shows it has roughly double the speed of the Slocum glider in the beginning. The end of the graph starts to even out and has a 29.65% difference in velocity between the gliders.
 - Graph of Vertical Acceleration for Sentinel and Slocum
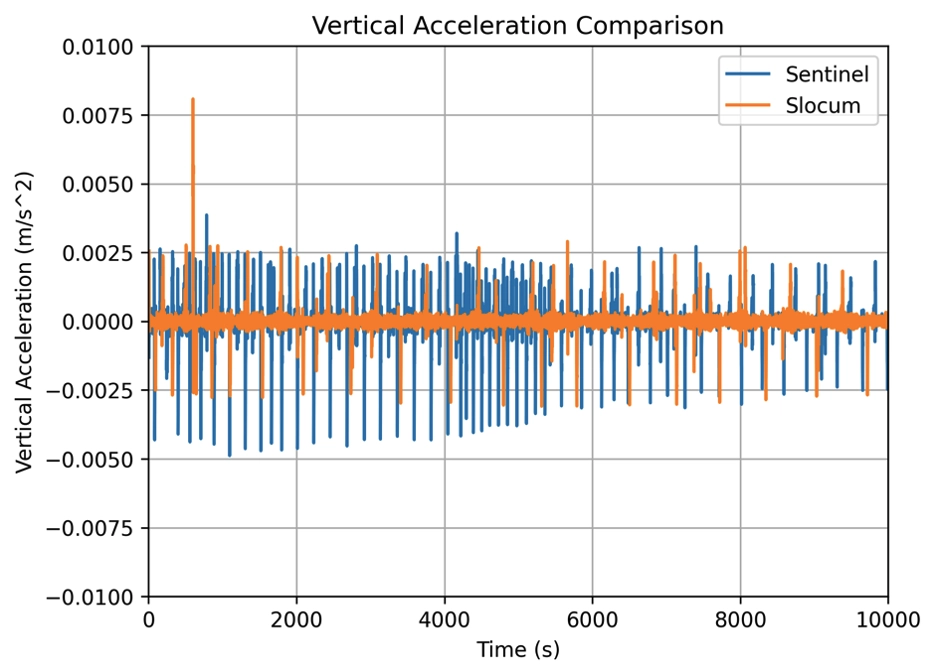 This graph shows a comparison of vertical acceleration between the Sentinel and Slocum gliders over time. Looking at the graph, Sentinel’s acceleration varies much more than Slocum’s, with bigger fluctuations up and down. This suggests that Sentinel is moving almost twice as fast in vertical motion, meaning it experiences greater changes in speed compared to Slocum.Meanwhile, Slocum’s acceleration stays closer to zero, indicating a steadier motion, except for one large spike early on. This sudden jump in acceleration means Slocum experienced a brief but strong movement, possibly due to an external force or an abrupt motion change. Like explained earlier when comparing vertical velocities, the difference in speed is due to the difference in the size of the buoyancy pumps.Alright everyone! That’s just about everything we have to share with you for now! Be shore to check back soon for more updates! Sea you later!
Spring 2025 Blog Entry 5 – Special Interview Pt. 2
Hellow everyone! Today we’ll be continuing our coverage of the interview we did with frequent collaborator Sal Fricano! Let’s get right to it!
Question 5: Can you tell us anything about how you got to where you are? I mean, you’ve been following the sentinel mission since it’s started right?
SAL: Historically the topics in marine science class before the sentinel mission had been introduced was a research class, which taught me a lot in my first few years of how to get involved with research, how to find a question of interest and get some information on it and data out in the world and start to answer some questions about it. That was a really unique perspective to gain as an undergrad for how this research of scientific methods can be applied to answer questions. So I remember one year, my third year as an undergrad, (5th time taking topics) and I go into class and Scott, Oscar, and Josh had all looked at us with a smile on their face ready to drop this bombshell on us to let us know that topics wasn’t just a research course anymore, It was going to be focused on answering scientific questions specifically for the first circumnavigation of a glider. That kind of spun that entire class around and prepared us for what we would now be doing. That course had taken that turn and since I had a lot of history in the course, I got to be very involved in leading the groups in guiding what those questions might be.
SAL: Scott, Oscar, and Josh gave us a lot of perspective on what they had learned historically from that Scarlet Knight voyage from New Jersey to Spain, which was a huge undertaking. There were reports of historical moments after that, where the series of Challenger missions or other Slocum gliders doing these transoceanic crossing of the Indian ocean and other huge ocean basins that we had flown through, and there were a lot of lessons learned in those times. They had shared that wisdom and knowledge with us, giving us the range to start answering the same questions that they still had about how we would facilitate it.
SAL: There was the mapping section where I was largely involved with, how we get from point a to point b and hope that we get there successfully in a time efficient and energy efficient manner. Another huge component of this would be outreach. We’re doing this huge historic scientific mission but we don’t want to do this alone, there’s no way we can do this alone. We are a class of dedicated students with wonderful professors at our disposal, but you can’t do something historic and global without friends around the world and supporters that can give you some insight, some wisdom, and some courage to actually do that mission. So the outreach group was responsible for local and global outreach, like getting local schools involved, getting kids involved to help support the mission, getting the word out there to all of these different communities across the world: that this robot was going to go around the world and help support our understanding of the oceans, and part of that message is helping people realize how important the ocean is to our lives.
SAL: No matter where you live, whether it’s on a coastline, or in the Midwest, in the US you’re affected by the oceans. You can be far or close but the weather is driven by the ocean, we know that this is a relationship and the weather affects everybody, so by helping spread that education and awareness and getting them excited that we’re making so many exciting technological advancements and how we can facilitate this research in our understanding of our ocean, its atmosphere, and its interactions is a huge component of supporting the mission. So how this ropes back into sentinel, we’re going to be flying across the world, but we’re going to be making pitstops along the way and so it’s important that we have friends in all of these different locations where it will stop so we can reach out and say “hey we’re going to fly this glider at your home country and we’re going to need help, can we use your lab space to change batteries along the way, can you get some people in your community involved so we can facilitate this global mission of scientific robustness”.
SAL: We want to send these vehicles out around the world, being out here for long periods of time getting real time data, helping support a global understanding of the oceans, this extends beyond the bounds of any one country or community, this is a global effort and we want all of our friends involved. So that is how I’ve grown with the class, and then of course as I mentioned my path, it was going from the academic side from being in topics helping facilitate some of this research and understanding, to now graduating, but I loved these gliders and didn’t want to leave the glider community, so I had the great opportunity to come to Teledyne and help develop and push the research and development of the sentinel vehicle along so that we can get this deployment underway.
Question 6: What were some of the challenges you faced on your way to where you are now?
SAL: Oh there’s certainly been challenges, I think everyone faces a lot of unique challenges, academic hardships, you may get an F on a test you studied very hard for, and certainly I am no exception to that. Ive failed my fair share of tests, Ive done a lot of work to achieve something that I didn’t meet my personal standards for, but one of the things that college taught me a lot is never be discouraged by one even. I think I kind of grew especially in my research, there’s a lot of bumps and ebbs and flows in how we achieve success and that’s been parallel in my work here, so as you know you set a goal for yourself and there’s never a linear path to get there. There will be ups and downs as you go there, but there’s some incredible lessons you can learn when you get knocked down and you say “ok how did I get here, what went wrong, and what’s something I can do better” and then use those lessons to get to a new high, to get progress towards your end goal, and you follow this curve and learn a lot along the way. It’s not about getting from point a to point b it’s about gaining wisdom and experience from the ups and downs along that path.
SAL: I think that has all tied into Teledyne, how we’ve been working on the sentinel vehicle. It’s been a huge research and development progress for us here and building the vehicle is no easy feat. We have hit a lot of bumps in the road trying to put the vehicle together into a flyable state, and we’ve learned so much along the way that’s opened our eyes to some of the challenges we didn’t know we’d face, and some unique engineering solutions we had to work around, so it’s been exciting being on this side of the aisle and seeing that. The concept never changes whether it applies to an exam, or to your work. You have a goal and you and your team are going to work to get from the start to the end, but you’re going to go through these ups and downs and as long as you’re open to gain wisdom and experience from what knocks you down, you’re guaranteed to go up and up and up until you reach your final goal, so broadly that’s been my experiences. Always been some hardships across every part of that aspect from school, to work but as long as you’re open to learning along the way, you will never fail.
Question 7: How are you feeling about the sentinel mission and its future?
SAL: I am feeling really, really positive. So, as the class knows we have just achieved the first 1000m dive with a sentinel vehicle in San Diego, which for our team was a huge accomplishment. Everyone from production to engineering who’s helped us solve all of the issues we’ve had with the vehicle, Software which has helped us program through bugs, glitches, and the code, and our team who’s been flying it aggressively week after week and finding all these failures, bringing it back to the lab to try and evaluate. It’s been a hard road to get here, but now having the vehicle out in the wild diving to 1000m really emphasizes that this is a flying functional vehicle that we’re at, and there’s certainly small things we want to iron out before we send it to be circumnavigating, but this news is a great sign to show that we’re doing the right things. We learned a lot of good lessons and implemented some good fixes for them. The vehicle is performing really well out in the wild, but the vehicle has been very well in it’s entire deployment. We will probably have it out for a little longer and probably recover it, bring it back home here to do a little bit more testing with it before we get it prepped for later this year and hopefully, deploy it on its first maiden voyage for its circumnavigation.
Question 8: So, One Last question to round things out. Is there anything that you want to tell our readers?
SAL: I would say to definitely keep an eye out for what the future holds. This is going to be a historic moment for all of the ocean nerds that are out there, but I think this is going to be a positive moment in history for all communities around the world. This is going to be a strong sign that the oceanographic research community is going to expand their capacity on how they pull data, and what their people are doing, and broadly that supports how the average person across the world will get information about their world and environment. When you check the weather app you want to know if it is going to rain this week, “I have plans this weekend, it’s going to be rainy this week I need to cancel my plans”, only to find out that the day you canceled your plans for it didn’t rain and your plans were canceled for nothing. This is a shared experience everyone has. When you trace back how we get that information it all comes down to things like this, where we have instruments out in the world. Researchers and scientists are collecting data to get information for global models for the ocean and weather forecast so that people around the world can make use of that. Technology like this (sentinel glider and circumnavigation) is a point in history where we see a change in how much data we can get back. Having a vehicle in the ocean for years at a time constantly collecting data is a huge increase in all these research capacities to keep fueling more data to make predictions and models more accurate, so the average everyday person will benefit from this, and it will be exciting to follow along and see how monumental this will be for the future and everyone’s average use of the forecast weather and predicted storm forecast.
Alright everyone, that’s the end of the interview! Us here at the Sentinel Blog had a great time interviewing Sal, and we thank him for his excellent answers to our questions! That’s everything we have for this week, but be shore to check back soon for more! Sea you later!
Spring 2025 Blog Entry 3 – Reminders + Gliders
Hello Everyone! Welcome back to the Sentinel Blog! Today, we’ve got some information about gliders and some updates/reminders about previously covered topics. Let’s get started!
First up, we’ve got a reminder about a series of events that we’ll be doing!
Over the course of the month of April, we will be having a series of 4 virtual meetings where we will answer questions that educators and some of their students have about the sentinel mission and the oceans. One meeting on April 3rd, One meeting on April 9th, One meeting on April 22nd, which is Earth Day, and one meeting on April 28th. All of us here at Rutgers are getting our knowledge up, so be sure to pack in some heavy hitting questions!
With that topic covered, let’s learn a bit about how gliders work. The Slocum Glider is an autonomous underwater vehicle (AUV) used for long-term ocean monitoring. This robotic glider navigates the water by adjusting its buoyancy, following a distinct sawtooth-like movement pattern to collect essential oceanographic data.
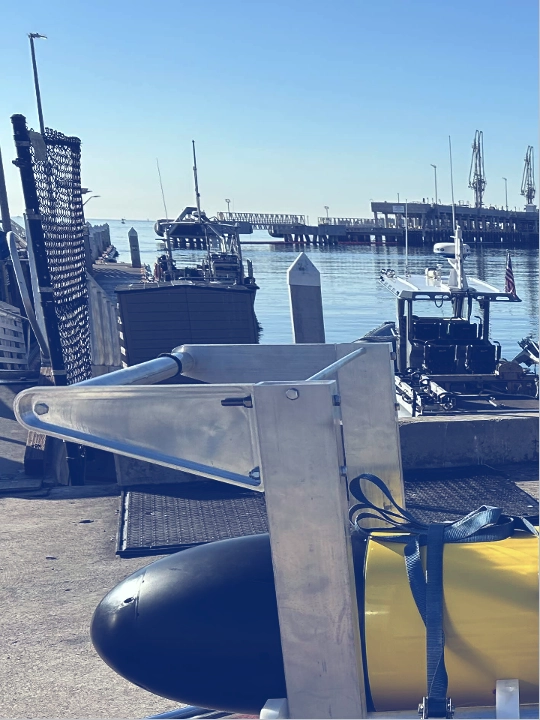
The front section houses the buoyancy control system, allowing it to ascend and descend, while the science bay carries sensors that measure various environmental parameters such as temperature, salinity, and even marine life activity through specialized instruments. The back bay contains the onboard electronics, thrusters, and emergency systems, ensuring the glider operates smoothly and can resurface if necessary.
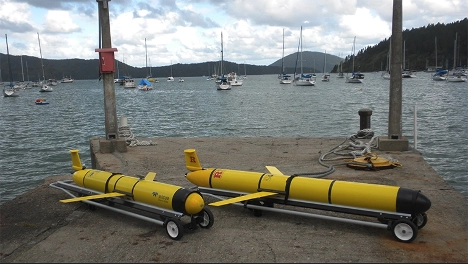
These gliders are critical tools for modern ocean research, and much of their data is publicly accessible through platforms such as Teledyne, Rutgers University, and NOAA, allowing researchers, students, and citizen scientists to engage with real-time ocean monitoring.
Next up, Also about gliders, we have an update regarding the testing for the Sentinel Gliders. We have a deployment!
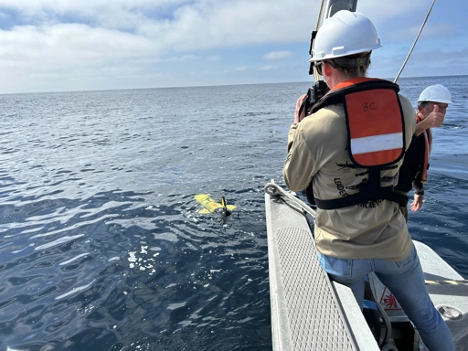
As you might recall, we mentioned some entries ago that there would be some glider testing done in San Diego, as there is easily accessible deep water there. Our people over at Teledyne have been hard at work to make sure that it was possible, and thanks to them we have a glider in the water! These deep water tests are essential to make sure that the sentinel glider is good to go down to those depths, and if it isn’t, then it’s important to know now so that changes can be made.
Alright everyone, that’s just about all the information we have to share with you in this entry. Be sure to check back soon for the next one! Sea you later!
Spring 2025 Blog Entry 2 – Uncertainty Map + Building Tour
Hello there everyone! Welcome back to the Sentinel Blog.Today, we’ve got some information about depth-averaged currents and our Uncertainty map we mentioned last time, and a short walkthrough of a building tour that we experienced! Let’s get started.
The way that gliders move through the water column is by floating up and then gliding down, with a vertical range of around 1000 meters. Gliders have a lot of moving parts in them, so they aren’t the fastest. To fix this issue, we try to have them travel along currents where possible. 1000 meters is a big range, and since ocean currents can vary greatly, we use models of the currents to find the average rates and directions of the currents. Some of the common models we use are the European Model, Copernicus Marine Environmental Service (CMEMS), the NOAA model, Real Time Ocean Forecast System (RTOFS), and the US Navy’s model, Global Ocean Forecast System (GOFS).
Now that we understand depth average currents, we can get back to our map from last week.
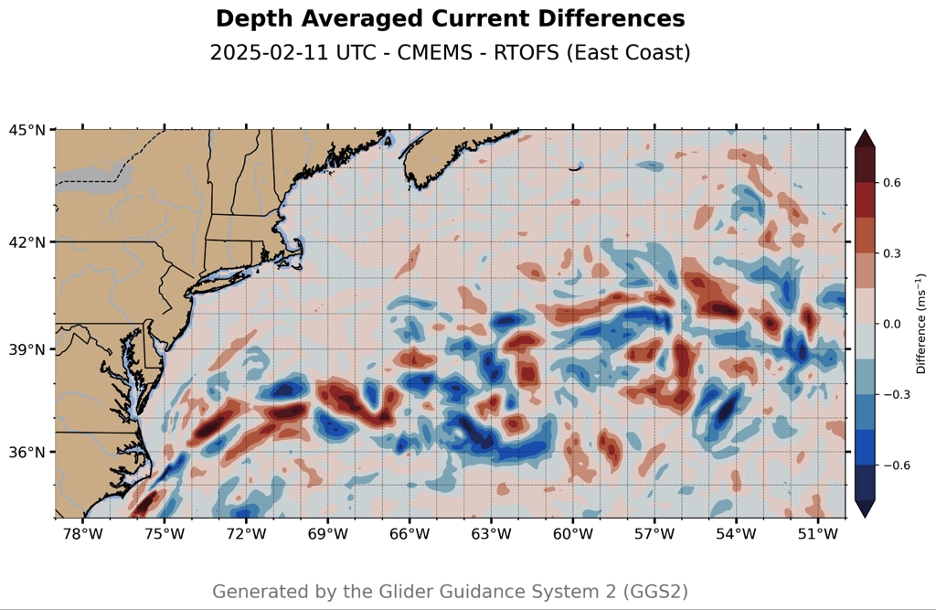
The uncertainty map shows the differences between depth averaged current magnitudes of the CMEMS and RTOFS models. The areas that are shaded in red are areas where CMEMS forecasts a current magnitude that is greater than RTOFS, and the blue shaded areas are where the current magnitude forecasted by RTOFS is greater than CMEMS. Darker colors indicate a higher difference. We can use these plots to understand the uncertainty between model forecasts and avoid areas of high uncertainty and take advantage of areas of low uncertainty.
Last week, our outreach group had the chance to explore the marine science building at Rutgers and check out some of the incredible work being done there. We got to visit two key areas: the COOL(Center of Ocean Observing Leadership) Room and the Water Lab, both of which play an important role in ocean research.
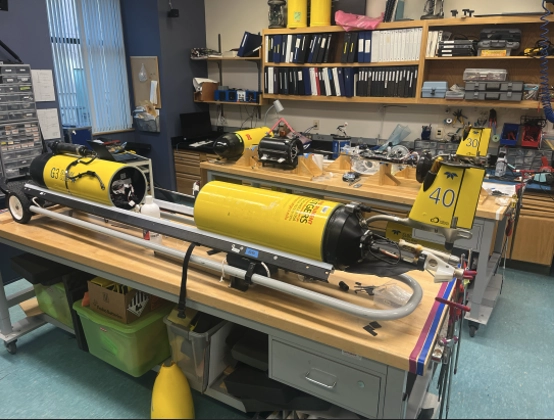
The COOL Room is where oceanographers test and maintain our Slocum gliders. As a quick refresher, these gliders are made by Teledyne-Webb Research and they collect data like temperature, salinity, ocean currents, clarity, chlorophyll concentrations and more, helping scientists understand changes in the ocean. Before they’re sent out into the water, they need to be carefully checked to make sure they’re working properly, and that’s exactly what happens in this room. It was really cool to see these high-tech machines up close and learn how they help with marine research.
Next, we stopped by the Water Lab, which is used to test different oceanographic instruments. The lab has a water source that can be adjusted to different temperatures, salinity levels, and pH levels so researchers can see how their equipment performs in real-world conditions. This kind of testing helps ensure that when the instruments are used in the ocean, they’ll provide accurate and reliable data.
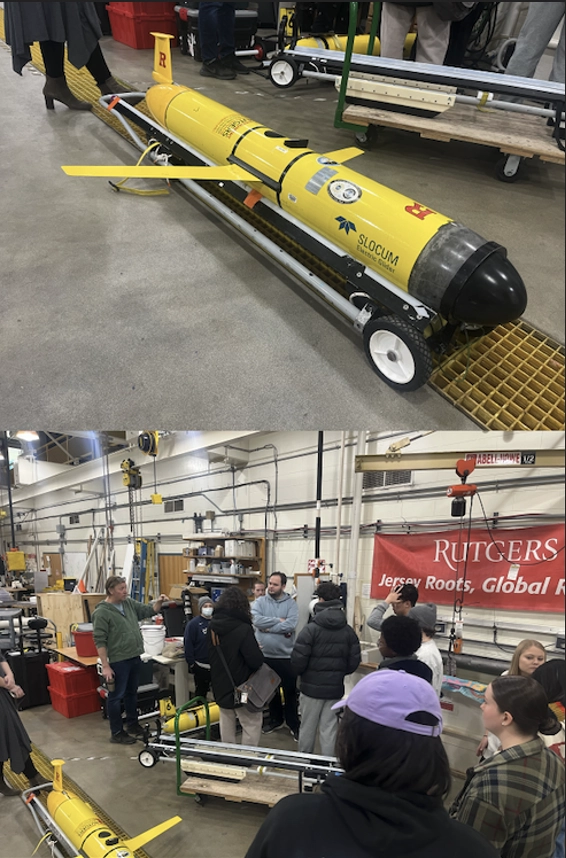
Spring 2025 Blog Entry 1 – Introduction and Timeline
Hello everyone! Welcome back to the Sentinel Blog. We’ve had a refreshing winter break, and we’re ready to give you all some more news and updates about the Sentinel Mission! We’ll be keeping things a little bit light today with a short timeline of events and some information about an outreach event we’ll be doing!
Just in case we have any new readers, let’s do a quick re-introduction of the Sentinel Mission. To give a simple explanation, the Sentinel Mission aims to get an autonomous slocum glider to circumnavigate the earth. If(when) we succeed, we’ll be the 1st people in the world to do this. And perhaps even more exciting than that is all the good we can do with this mission! We’ll be able to collect more data about our oceans and be able to connect with and help educate communities all around the world about them!
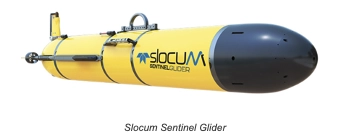
Right now, we’re still testing the Sentinel Gliders. Last week, we did some trials in the cape cod bay, and this week we’ll be doing some deep water testing in San Diego. We are currently using 3 sentinel gliders for testing, with 2 of them in Cape Cod and 1 of them on the way to San Diego. It may seem like we’re doing a lot of tests, but it’s essential to find out what the problems are now and fix them instead of dealing with them in the open ocean.
In previous semesters, we set out with a clear goal: to inspire, educate, inform, and connect the world through the Sentinel Mission. Everyone attached to the sentinel mission has been working themself to the bone to make that mission a reality! We’ve had great successes in international and local outreach, and we’ve got a new program to further those successes and give back to some communities around the US. Take a look at this flyer to learn all about it!
The Rutgers University Center for Ocean Observing Leadership (RU COOL) is offering a unique opportunity for educators and students to explore ocean science through live virtual teleconferences with scientists. Participants will engage with ocean researchers, learn about autonomous ocean robots, and discover how cutting-edge technology helps us study climate change. The program includes interactive lessons, Q&A sessions with scientists, and hands-on STEM activities aligned with NGSS standards.
How to Apply
- Deadline: March 3, 2025
- Apply Online: Scan the QR code or visit this link
- Virtual Meeting with Scientists: March 18, 2025
- Teleconference Dates: April 3, 9, 22 (Earth Day), and 28, 2025
That’s just about everything we have to share with you for this entry, but we do have a sneak peek available for the next one!
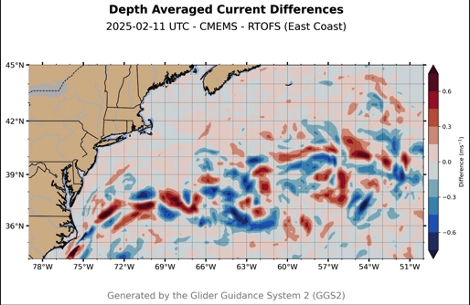
This map shows the differences between the depth averaged current magnitudes of two global models that we’re using. We’ll be going more in depth about this map and depth averaged currents next time. Be sure to check back here next week! Sea you later!
Blog Update 11-5-24:
We would like to update everyone regarding this new post on our blog and more information for the Redwing Sentinel Mission! In our course we have delegated our lecture hall into numerous sections to identify, present, and make targeted audiences aware of our missions underlying history and the future of marine science. Our group is reaching out to audiences such as regions relative to Rutgers, local schools in NJ, and an international outreach. Knowing this, below I will identify certain sections and what they have accomplished so far.
Lego Group:
“This year’s LEGO Challenge for 3rd-8th graders is “Submerged.” They were tasked with the challenge of building a Lego tool that can be used to observe life in the ocean. The students who are currently in robotics courses ranging from third to eight graders in the public schools were very engaged with the content that was being discussed. This group hosted a webinar to inform over 50 teams about our satellites, HF radar, and gliders and how we use them to collect marine data.” It was a great opportunity for aspiring students who are interested in STEM to see a real-life application to the major.
Below is a link provided to the submerged theme building instructions for these robotics’ students:
https://www.fllcasts.com/competitions/first-lego-league/2024-submerged/building-instructions
School Group:
The school group is currently coordinating with teachers and principals to get a day dedicated to teaching students about our mission and raising awareness for marine sciences. They will make it possible for students to take their creations and put them onto a flash drive that will be inside of the Slocum glider that traverses the world. A rough drafted letter has been constructed as a basis for students to share their ideas that will be seen on a global level from many different communities.
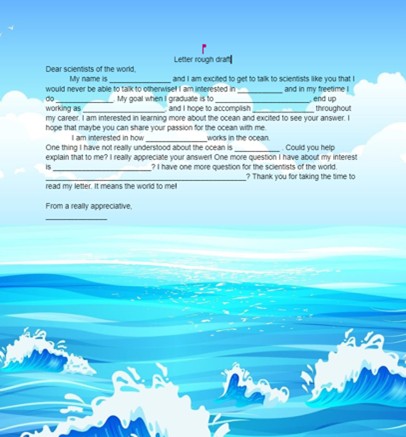

Pathfinders Group:
The map makers are currently reconstructing a more detailed pathway to represent where the redwing will be travelling during the sentinel mission. They are currently in the process of rendering the glider route, as well as navigating any potential hazards that may be encountered during the different legs of the route.
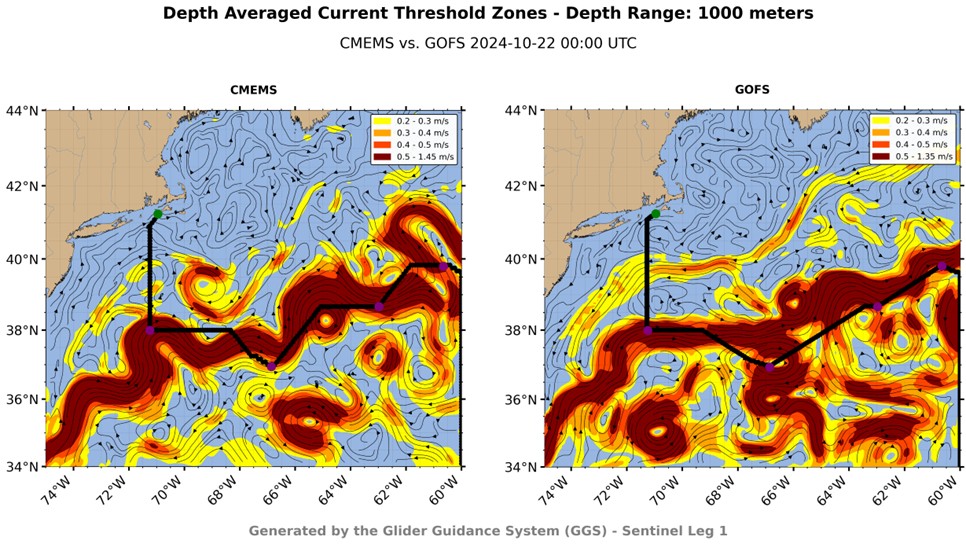
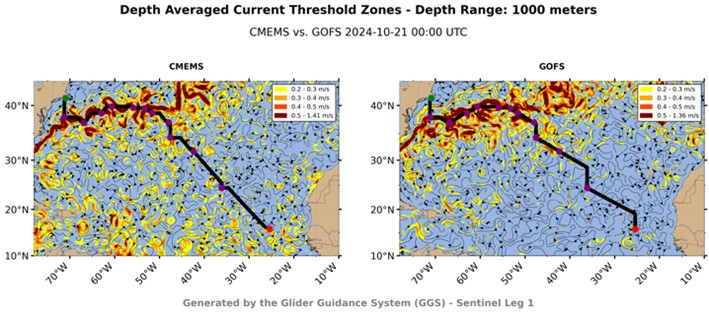
International Group:
The international group is working on expanding accessibility to the glider game. Not only does this include numerous languages such as U.S. Brail, Spanish, and Portuguese, but also adjustments to metric values for these communities (E.g., feet to meters). This group is also drafting letters to send to members around the globe to reach these audiences and raise awareness for the red wing mission. Some of the updates being made to the game is an expansion pack with new questions for the cards, an updated version of the map, and new playable pieces. Shown below is a visual of the game that is being reworked and a sneak peek at the process of developing new questions. As of today, an outreach email was just sent to promote awareness for the mission and the upcoming event
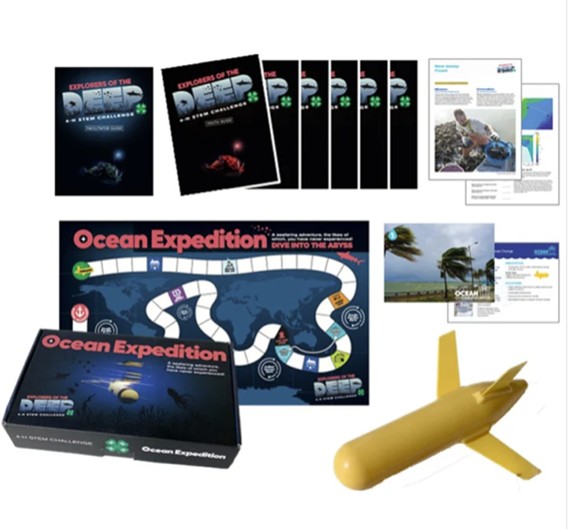
Rutgers Outreach:
For the reach out of Rutgers audiences, a presentation has been developed which outlines the previous data of past missions, challenges of the sentinel mission, technical information on the glider, and information regarding what each section of our course is doing in terms of outreach in preparation for our upcoming event. This presentation will be given to the chancellor to explain what our course is currently trying to achieve
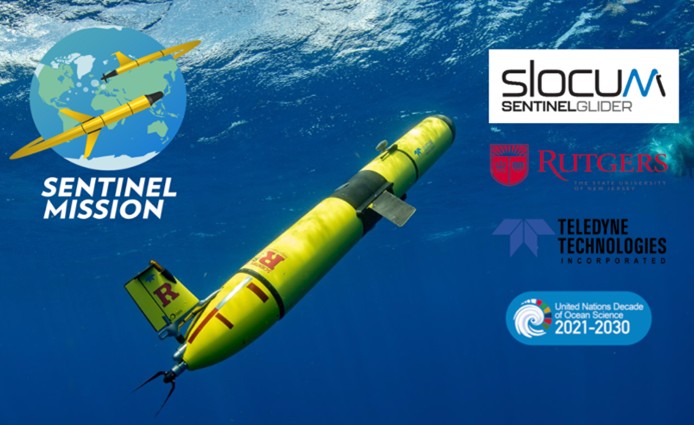
To celebrate the growth and progress of the Slocum redwing glider for the upcoming sentinel mission we would like to announce an event that we are holding. On December 4th we will be hosting an event in the International Food Nutrition and Health (IFNH) Building. It will be an open environment to network with previous marine science alumni, current graduate and undergraduate students, and professors that have worked on and developed this technology. At the event there will be video presentations, tours of the marine science building, networking potential and food! Merch including tee-shirts, hats, and other accessories are currently in development for the upcoming event which will be released soon.
Blog Update 11/12/24
Regarding what our course has done over the past week, we have been further developing our personalized sections to successfully prepare for our upcoming sentinel mission event on December 4th, 2024. Emails have been sent towards teachers, schools, professors, and the chancellor. We are currently working on developing messages to send to our international members as well as previous marine science alumni in preparation for our event. This will allow us to have more people to support and celebrate the growth and progression of this mission while allowing current college students to build a network amongst their peers. The images below were from the last years seminar which revealed the Slocum sentinel glider its designs and functionality
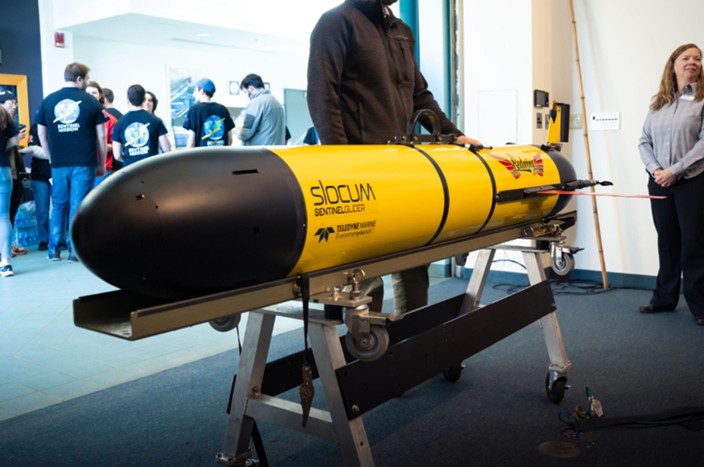
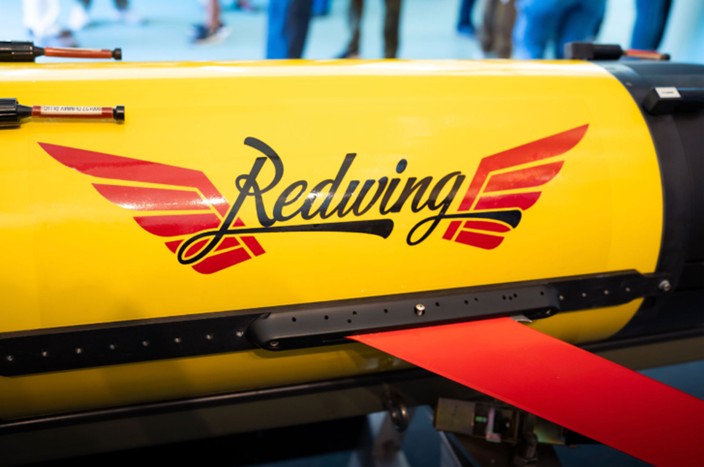
A meeting has been made to discuss the potential time to initiate the launch of the redwing glider and they have concluded that 2025 a set date will be made in the Spring of 2025. To avoid any complications, allow time to fine tune the glider, and to have better oceanic conditions, the members working on the glider felt the need to extend the period of the launch. A date for the launch will be updated as soon as one is presented, and we hope to see your support throughout our process.
An update for our sections is as follows below:
School outreach: we are currently developing a teacher letter and student letters that include mad libs and drawings. The letter is being proposed to teachers for three different age groups to incorporate their ideas into the sentinel mission. In essence we will send our letters towards the schools the schools will send us back all the student’s ideas and we will import them onto a usb drive which will ride inside of the redwing glider on the mission. This allows these students to be a part of a project at this scale which can inspire them to thrive for knowledge being that they are the next generation that have the potential to be oceanographers
RU outreach: they are currently developing letters towards previous alumni to make them aware of the event in December as well as working on a letter to send to the Webb family. A video for Douglas Webb has been in development which will honor his legacy and be presented during the redwing event to commemorate his contributions towards the project
Mapping Group: further developing individual maps and adding them together to represent an overall pathway for the glider to travel.
International group: this group is currently adjusting the game and sending out emails to approve the adjustments.
Blog Update: 11/19
This week, our teams have been hard at work making final strides on their projects, preparing to showcase their efforts at the upcoming event.
Mapping Group:
- Finalizing their data to present both global and localized patterns, creating visuals that will offer a broad yet insightful perspective on the issues at hand. Their work bridges global trends with local impacts, ensuring an engaging presentation.
RU & School Outreach:
- Reaching out to alumni and institutions, they’ve been sending and receiving emails to strengthen connections and broaden engagement. Their efforts are ensuring strong attendance and fostering partnerships that support our mission.
Game Group:
- Focused on inclusivity and creativity, they’re developing an interactive poster board and enhancing their game. Updates include new language options and a Braille version, making the project accessible to a wider audience and ensuring a meaningful experience for all.
We’re excited to see everything come together and to share these projects with you. Don’t forget to mark your calendars for this special event—we can’t wait to connect with you and showcase our hard work!
Blog Update: 11/26
Thanksgiving Break! Enjoy your holiday weekend and take time to relax with your families. Our class is currently preparing for the long weekend off and there will be another blog update prior to the event. We hope to see you all soon and are excited for the upcoming event on the fourth!
Blog Update 12/3
We’re thrilled to share some exciting news! As of today, our team is putting the finishing touches on preparations for the highly anticipated event happening tomorrow at the INFH Building. Over the past few weeks, we’ve been fine-tuning our presentations, making small but impactful adjustments to ensure everything ready to present. We’ve also carefully gathered all the resources we’ll need to create an engaging and memorable experience for everyone attending.
This event is the culmination of our hard work and dedication throughout the fall semester, and we couldn’t be more ecstatic to finally share it with you! It’s not just about showcasing our efforts—it’s also a fantastic opportunity to connect with fellow oceanographers, exchange ideas, and celebrate the incredible work happening in our field.
We sincerely hope you’ll make the time to join us and be part of this special occasion. Your presence would mean so much to us as we unveil our projects and foster connections within our community.
5/9/2024
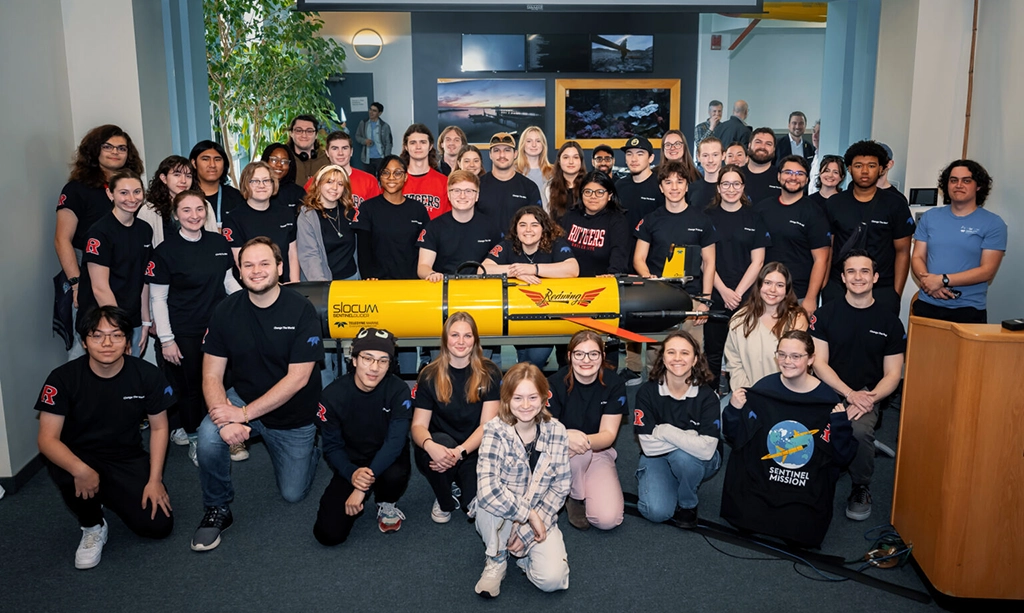
Rutgers University and Teledyne Webb Research unveiled The Sentinel Mission in a remarkable display of academic and technological collaboration. This unprecedented initiative marks the beginning of an ambitious journey as Teledyne’s Slocum Sentinel Glider, “Redwing,” (Research & Education Doug Webb Inter-National Glider) prepares for a historic round-the-world flight. Redwing is an acronym for “Research & Education Doug Webb Inter-National Glider”. The mission is further strengthened by the involvement of NOAA, the Marine Technology Society, and the UN Ocean Decade.
The event, which took place at Rutgers University on April 23, showcased the intricate planning and resilient partnership behind The Sentinel Mission. The Redwing glider, embodying the intersection of Research and Education, pays homage to Doug Webb, a pioneer of autonomous underwater technology. The glider stands not only as an innovative piece of machinery but also as a symbol of global research unity and exploration.
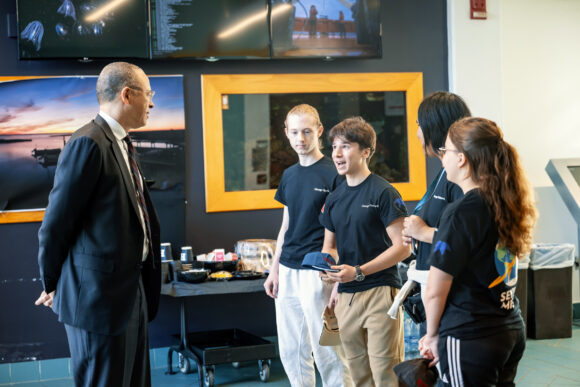 Rutgers President Jonathan Holloway delivered remarks, along with several esteemed faculty members, each sharing their encouragement and support of this mission. Teledyne Marine staff members, Clayton Jones, Senior Director of Technology and Shea Quinn, Slocum Glider Product Line Manager, provided insight into the history of Slocum gliders and how this mission will affect the future of ocean science.
A highlight of the event was the christening of the glider, “Redwing,” with seawater from Cape Cod, signifying its readiness for its summer 2024 launch. Attendees witnessed a blend of time-honored maritime tradition with cutting-edge innovation.
A cohort of Rutgers’ brightest undergraduate students presented the mission’s flight path. Their extensive planning encompassed considerations for ocean currents, water conditions, and other environmental variables. These presentations highlighted the exceptional educational experiences at Rutgers, exemplifying the university’s dedication to hands-on, impactful learning.
Insights from international partners integral to the mission’s global scope further enriched the event. With each presentation, the essence of collaborative spirit and international cooperation became clearer, setting the stage for a truly global expedition.
 The day’s activities culminated with a closer look at the Sentinel Glider, showcasing its capabilities compared to standard models. The academic community, including master’s students and faculty, engaged in fruitful discussions about sensor integrations and future research applications.
The Sentinel Mission’s anticipated launch in the summer of 2024 will contribute to our understanding of the oceans and serve as an inspiring testament to the power of academic-industry partnerships and the indomitable human spirit of discovery.
About Teledyne Webb Research: Teledyne Marine is a group of leading-edge technology companies that are part of Teledyne Technologies Incorporated. Through acquisitions and collaboration, Teledyne Marine has evolved into an industry powerhouse, bringing Imaging, Instruments, Interconnect, Seismic, and Vehicle technology to provide solutions to our customers. For more information, please visit www.teledynemarine.com.
About Rutgers University: Rutgers University is a leading national research institution that has consistently pushed the boundaries of innovation and education. The Sentinel Mission represents the university’s commitment to exploring new frontiers. For more information on the mission’s background and Rutgers’ history with such initiatives, please visit the Challenger Glider Mission website at www.rutgers.edu.
Original article at Rutgers NJAES Newsroom
4/22/2024
Sentinel Mission Blog: Entry 4 – April 23rd
Welcome back to the Sentinel Mission Blog! You may remember that in last week’s post we talked about some of the hazards around our launch and what steps we would take to ensure that it would be successful. As we get closer to our launch date, it’s critical that we spread the word about our Mission. Thankfully, we have a day set aside especially for that: April 23rd.
The Timeline from Today to April 23rd
So, what exactly will we be doing on April 23rd? To put it simply, we will be having a wide variety of people present during our class time. From 8:30 – 9:50, we will have guest speakers that range from Rutgers Administrators, Teledyne and NOAA Representatives, our correspondents in the countries that we’ll make our stops in, to our very own classmates and students.
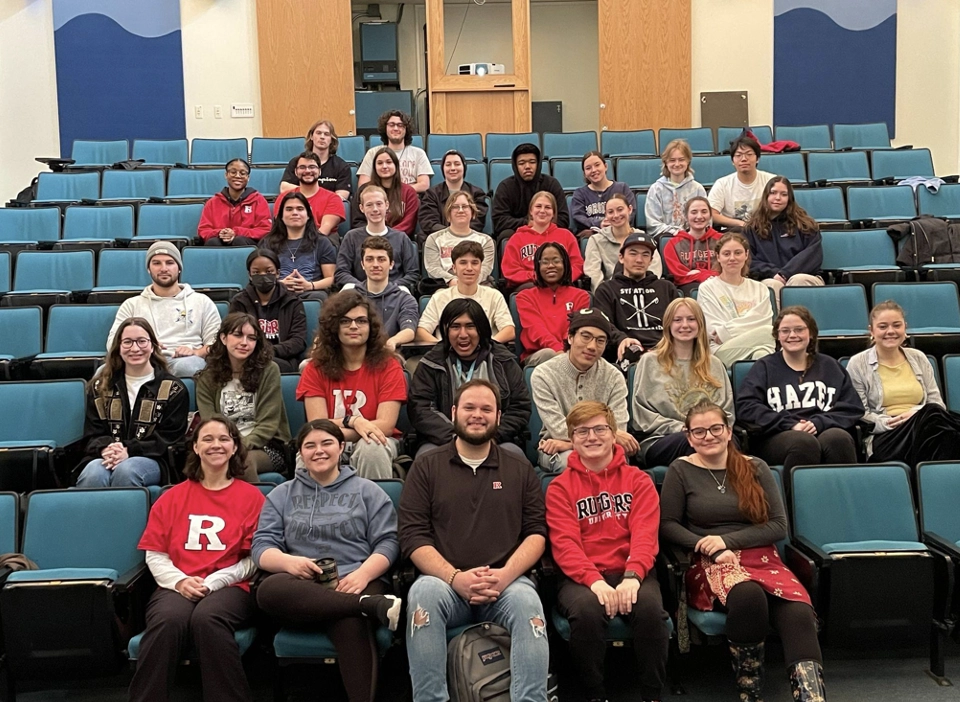
The Students in the Spring 2024 Topics in Marine Sciences Class
Now that we have an idea of what April 23rd is going to look like, we should get more specific with what we will actually be happening. First of all, The President of Rutgers, Jonathan Holloway, and the Dean of the School of Environmental and Biological Sciences, Laura Lawson, will be giving a brief introductory speech and comments.
Once they finish, We’ll move on to our next guest speakers, Craig McClean and Trisha Bergmann from NOAA. This class, Topics in Marine Sciences, has had a relationship with NOAA since its inception. Afterall, they were the ones who officially challenged us to cross the Atlantic with a glider in 2009!
After they finish, we will have some representatives from Teledyne Marine, Clayton Jones and Shea Quinn, introduce the Sentinel Glider. Once they say a few Words, they’ll christen the glider with some seawater!
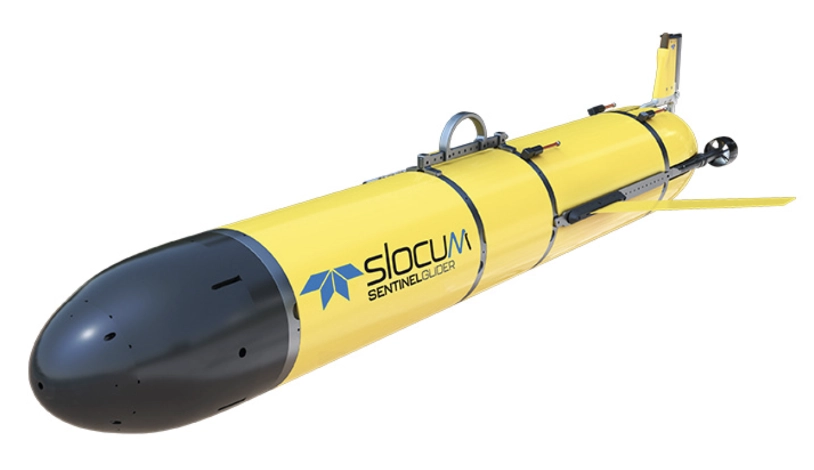
The Sentinel Glider
Once Shea finishes her speech, it’ll be time for the efforts of the students throughout the semester to be revealed in our class presentation! We’ll be discussing a variety of topics, such as, the Sentinel Mission, the Sentinel Glider, any trinkets that we’ll put inside the glider, the route we’ll be taking, the hazards we’ll be dealing with, outreach, and more.
A slide from our Class Presentation
After our class presentation finishes and we have a short Q&A Session, we’ll move on to our last section, Comments from some of our International partners.
From Spain, we have Ana Mancho, who leads the Geophysical Dynamics Group at the Instituto de Ciencias Matematicas, Enrique Alvarez, who is the head of the Physical Oceanography division at Puertos Del Estado, Antonio Ramos, who made the Glider position prediction system Pinzon, and Carlos Barrera, who is the Head of the Ocean-Vehicles Unit with the Oceanic Platform of the Canary Islands. From South Africa, we have Tammy Morris, who is the Senior Manager for Marine at the South African Weather Service. From Australia, we have Chari Pattiarachi, who is the Head of the Coastal Oceanography Group of the University of Western Australia. From New Zealand, we have Joe O’Callaghan, who founded Aotearoa New Zealand’s glider facility.
A big point of our April 23rd presentation is to spread the word about our journey across the world, so that we can hopefully secure some funds for our trip, and increase global knowledge about the ocean!
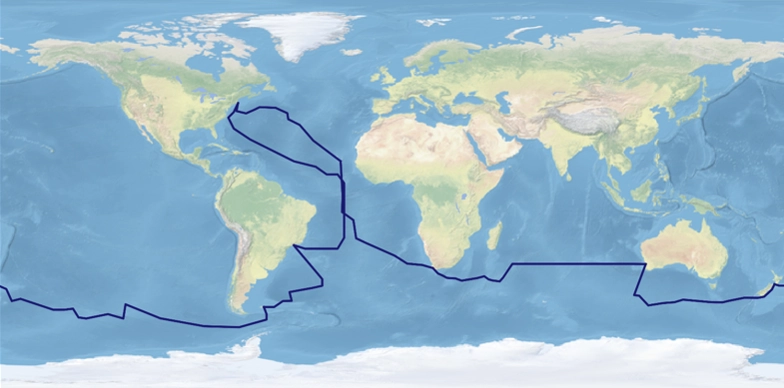
Map of the current flight plan of Sentinel Mission
Alright everyone, that’s all the information we have to share for now. Be sure to check in soon for more! Sea you later!
4/09/2024
Sentinel Mission Blog: Entry 3 – First Week Hazards
Welcome back to the Sentinel Mission Blog! You may remember that in last week’s post we looked at some maps that outlined advantageous paths for our glider! This week, we’re going to be taking a look at some more maps, and this time, they’ll help us determine where exactly we should start off our journey. We’ll be launching off of the coast of Cape Cod in Massachusetts, however, Cape Cod is an area that has a lot of things that could interfere with or damage our glider, so we need to find a launch site that minimizes the risks. To assist us in this task, we will be using the Marcos Ocean viewer. Let’s dive in!
During the first week of its journey, the Sentinel Glider will face a major obstacle: avoiding shipping lanes. Off the coast of Massachusetts, where the glider will depart, there are many fishing, cargo, and other vessels traveling to and from shore. These ships move much faster than the Sentinel Glider, so if the Glider got caught in a shipping lane, its journey would end there. In order to avoid collisions with vessels, the Glider has to dive deep into the water and/or have a route planned around known shipping lanes. Once the Glider successfully makes its way off the continental shelf and into open ocean, shipping lanes are more dispersed, so the chance of colliding with a vessel is much less likely.
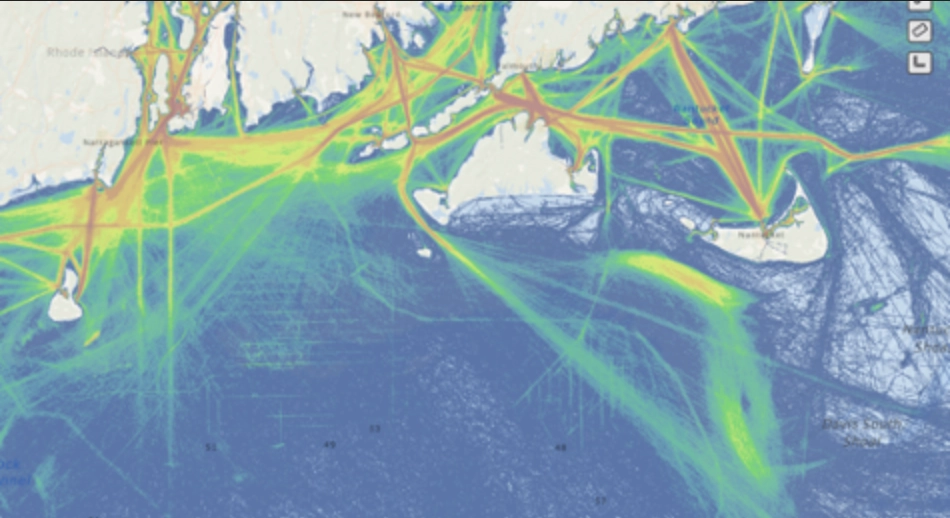
Shipping Routes near Cape Cod, Taken from the Marcos Ocean Viewer
Another obstacle that our navigation team has to prepare for is the construction of offshore wind farms. Currently, off the coast of Rhode Island and Massachusetts, offshore wind turbines are being built. There are already some sites that are up and running as well. Both of these locations are something we are going to have to avoid. Although these sites contribute to sustainable energy goals, it is not a place we want our glider to be as it poses a high risk for our mission. Preparations made by our path planning team will help to curb this risk.
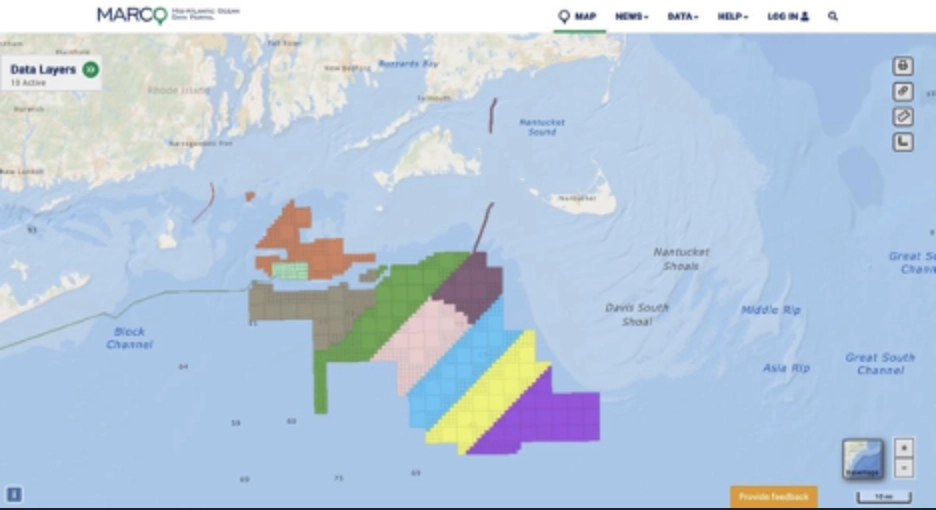
An image of planned offshore wind farm construction sites taken from the Marcos Ocean Viewer. Many of these sites have not been built yet, and some of them won’t be in construction for some time.
While shipping lanes are one of the many dangers that the Sentinel Mission will face, those ships tend to stay in designated “highways”, making them easier to avoid. Smaller ships, especially those used for commercial and recreational fishing, pose a greater level of risk due to the number of unknowns involved.
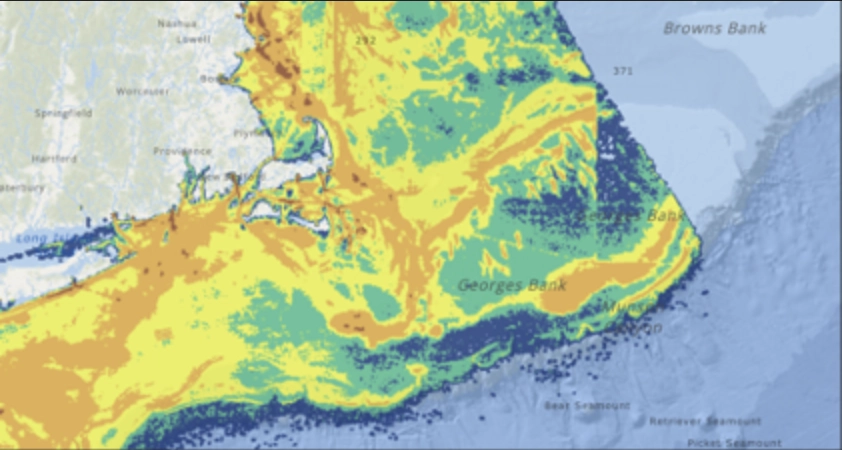
An image of Fishing Activity taken from the Marcos Ocean Viewer.
As seen above, a substantial amount of fishing takes place off the coast of Cape Cod, with red areas having a high volume of ships and blue areas having the least. Charting a course avoiding these hotspots in addition to all the other hazards has not been an easy task.
The center of the Atlantic lacks most of the hazards found along major coastlines, but they return as the glider nears Cape Town, the first of our stopping points. Ships off the coast of South Africa may not match the same level of danger stemming from the high volume of ships off of Cape Cod, but one factor does come into play: illegal fishing. Entire areas of the ocean become filled with unknowns, forcing the glider to take a bit of a wider route.
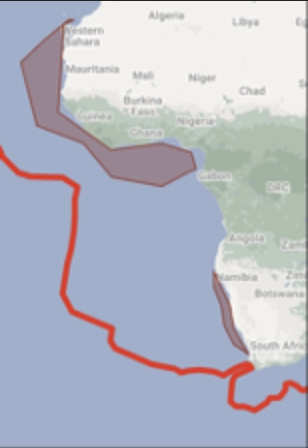
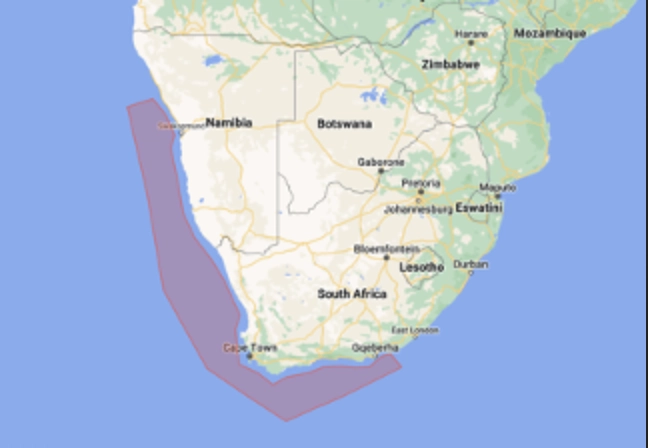
Areas of illegal fishing off the coast of Africa
We’ve covered a few of the hazards surrounding Cape Cod’s coast today. Taking all of them into consideration, the best area for us to launch is around here.
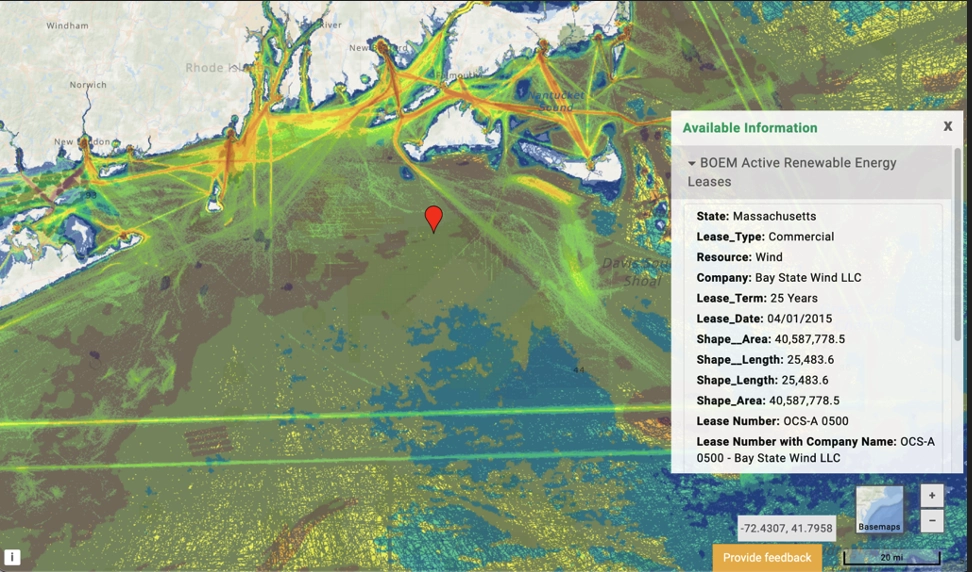
A Map with all of our Hazards included.
The area that we pinpointed has a low fishing rate considering it’s distance to land, has a low shipping rate, and it’s in an offshore wind site that won’t have alot of activity around the time of our launch, making it a prime location to deploy our glider at!
That’s all the information we have to share with you all for now. Be sure to check back next week for more! Sea you later!
4/03/2024
Sentinel Mission Blog: Entry 2 – Flight Planning
Hello there everyone! Welcome back to the Sentinel Mission Blog! You may remember that in last week’s post we mentioned our flight planning group. Today, we’ll be diving into one of the tools that they use to expedite the flight planning Process– The Glider Guidance System!
The main thing that the Glider Guidance System (GGS) does to help pilots guide gliders in a dynamic ocean using predictions of the depth average currents of a given area. Depth-averaged current data is important because gliders are buoyancy-driven, and as they move by flying up and down through the water column (with a vertical range of 1000 meters) by changing their density, the systems profile they “feel” the depth-averaged currents in the ocean. Therefore we need a water column average current estimate to predict the potential glider flight. The vast majority of ocean currents do not flow in the same direction over depth, and surface currents may even have direct opposite counter currents hundreds of meters beneath them. Therefore, we are actively using a newly developed (by Rutgers Operational Masters Student Salvatore Fricano) Glider Guidance System that provide us with depth-average current magnitudes for helping us choose the best path for Sentinel for the glider maximizing efficiency and when possible saving power in the glider batteries by surfing currents in a positive direction to our target.
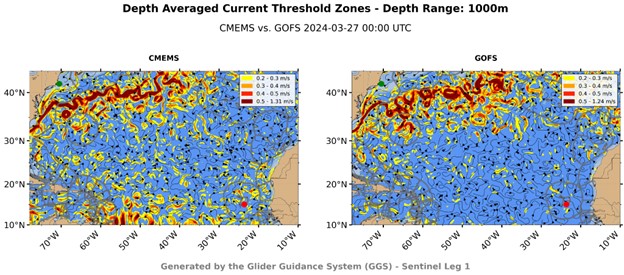
A Map generated by the GGS of the first leg of our journey. The red shows strong current and blue are weak currents. The CMEMS panel reflects the output using the European ocean forecast systems. The GOFS panel is the output using the US Navy ocean forecast system.
Now that we have established the purpose of the GGS, we should find out how it achieves its function. Given the working area for a mission (latitudes, longitudes, and depth range), the GGS can get real-time data from a few different ocean models., those models being, RTOFS, CMEMS, and GOFS. RTOFS is NOAA’s model, CMEMS is the European Model, and GOFS is the US Navy’s Model.
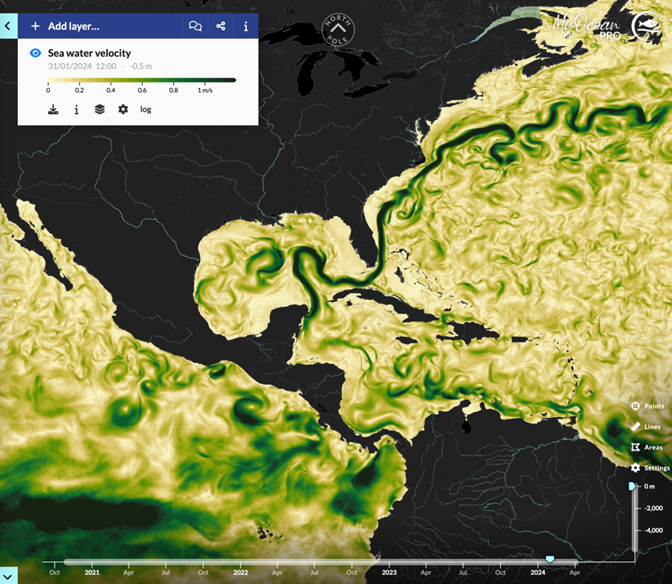
An example of a map taken from the CMEMS Model’s Copernicus Ocean Viewer.
These models compute point-values for ocean currents which are spaced out on a grid across latitude, longitude, and depth. The latitude and longitude grids are usually well spaced, but the depth positions at which data points are calculated tend to vary based on where strong temperature and salinity gradients in the ocean are. This happens because all ocean physics equations are based off of gradients, which results in the depth point values being unevenly spaced. Because of this, the average of the depth point values over the latitude and longitude are improperly weighted and therefore unusable.
Thankfully, we have a solution for this problem: Interpolation! Interpolation allows the GGS to fill in the intermediate values between 2 points values over depth. Since GGS interpolates to a 1 meter resolution, we can take the raw ocean data from the model we’re using, which, for example, could only have 100 data points scattered around 1000 meters of water, and increase the resolution so that we have one data point per meter of depth! Since we now know what the ocean is modeled to look like within our range, we can then average those values to get the depth-average for each grid position!
That whole process we just discussed was only how we got the data for one point. In order to get to our end goal of a map, we’ll need to repeat that process many times. Thankfully, we have a solution to that issue as well; vectorization.
Vectorization is a technique that lets the same operation be applied to multiple data elements at the same time. GGS will use vectorization to apply the depth-averaging method described above to every latitude and longitude positions in the model’s grid at the same time. It’s the same idea as doing a task on your own vs. doing it with a group. Doing it on your own could take a long time, but doing it with others could significantly reduce the time spent on that task! Thanks to vectorization, the GGS can compute depth-averaged ocean current data for any part of the world extremely fast! The program will then plug that data onto a map, which takes a few minutes, and the process is complete!
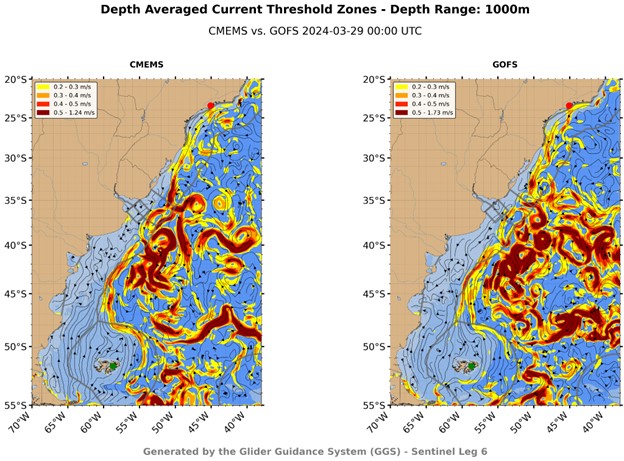
Now that we’ve gotten through the meat and potatoes of the GGS, it’s time for some general/miscellaneous information! Our first item here is automation. The GGS can be run manually by end users or it can be set up on a server for automation. This is done on a case-by-case basis. Automated depth-averaged current maps can be very useful for glider pilots making daily adjustments to a glider, like in an area with a high amount of current activity, such as the Gulf of Mexico, where the GGS is currently being used to support the active glider missions going on as a part of the National Academies Understanding Gulf Ocean Systems (UGOS) Initiative.
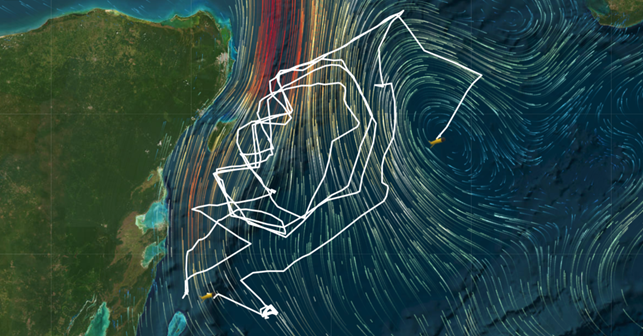
An image of the RU38 and Stommel Gliders and the paths they’ve been on around the Gulf of Mexico.
Lastly, it’s time that we look at the reasoning for the existence of the GGS. The GGS was actually inspired by the Sentinel Mission! When the first route-planners were going at their task, it became clear that a dataset that represented the full range that a glider could go was needed.
Glider pilots usually observe surface current data to plan their missions and get ocean information. However, due to the length and distance of our journey, we need to use all of the range we have access to, and since ocean currents can change with depth, the planners needed a way to represent the currents over our range of depth and any other hydrodynamical forces that the glider would experience. Thus, the GGS was conceptualized, and Sal Fricano began programming it for his Masters in Operational Oceanography Thesis! It has been in development for around 5 months, and has been developed around user feedback during its early applications in supporting glider missions, like the ones going on as a part of the UGOS initiative. After Sal defends his thesis in August, the GGS will be made publicly available as a toolbox for glider pilots around the world!
That’s all the information we have to share with you all for now. Be sure to check back next week for more! Sea you later!
Additionally, We here at the Sentinel Mission blog group would like to extend our sincerest thank-you’s to Sal Fricano for explaining the GGS! Thanks Sal! Good luck on your thesis defense!
3/26/2024
Sentinel Mission Blog: Introductory Message
Hello Everyone! All of us here at the Rutgers Department of Marine and Coastal Sciences have something exciting to share. Introducing… The Sentinel Mission! This will be the first ever mission of an autonomous glider to circumnavigate the world, and we are going to be the ones to do it. Pretty neat right? Let’s start off with a bit of background information: what is a glider?
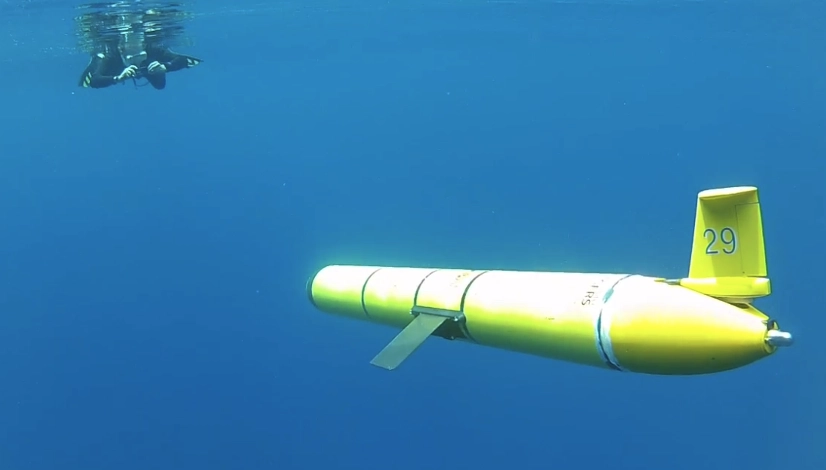
Image of Rutgers Glider
The Slocum Autonomous Underwater Gliding Vehicle is a robot that moves along the water column by climbing and diving down through it. When one is in the water, it can collect data on a variety of parameters, such as: salinity, temperature, chlorophyll in the water, and more!
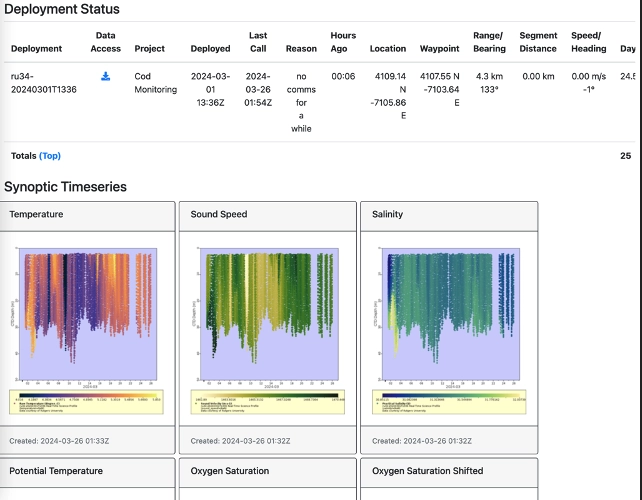
Data taken from current glider ru34 deployment
They’re usually pretty slow, with a horizontal speed of around 0.5 mph. However, Even with their slow speed they are capable of traveling great distances! When we’re sending a glider on a mission, we try to ride any currents that are going in the same direction that we are in order to increase our speed and decrease battery usage! A big example of when we used strategies like this was 2009, when we sent a glider all the way across the Atlantic Ocean!
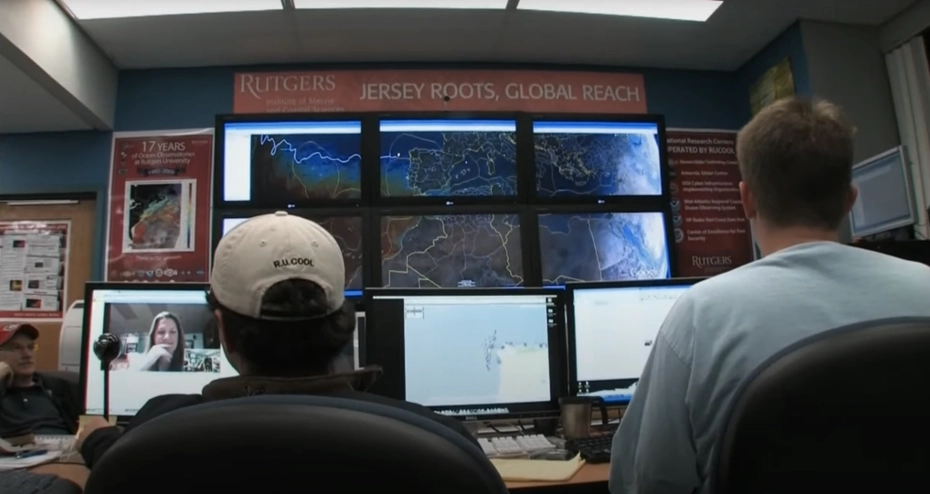
Image of people operating the 2009 glider from the RUCOOL Room at Rutgers
The glider being used for our mission was built by the Teledyne Webb Research Corporation. It is their Sentinel Model, which will eventually be commercially available.
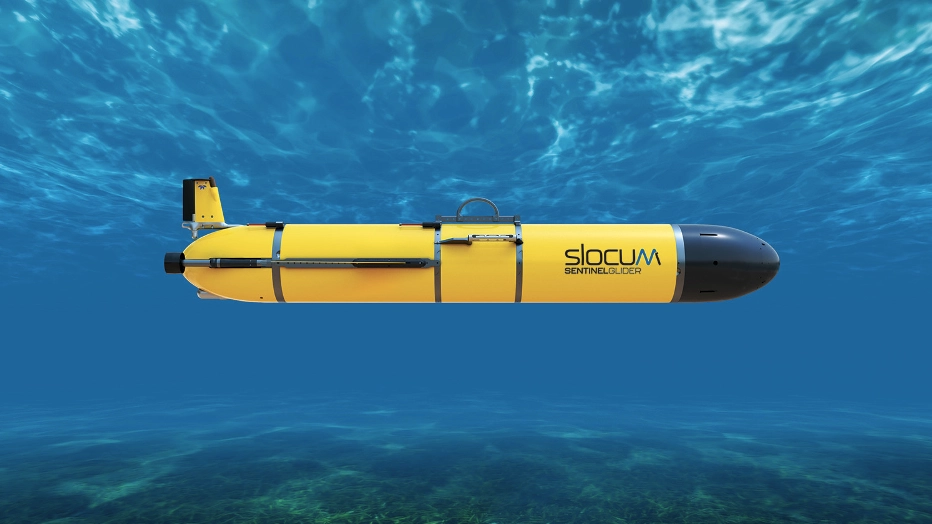
Slocum Sentinel Glider
In this introductory post about the Sentinel Mission, we’re going to be covering what we’re doing, how we’re doing it, and why we’re doing it. Let’s get started!
What we’re doing
The purpose of the Sentinel Mission is to send a glider to circumnavigate the globe. Although glider technology has progressed since 2009, we aren’t at a point where we have the battery power to go around the whole world on one charge. This caused us to need to make a few stops on our journey. However, our stops serve another purpose as well; They allow us to visit our partner universities and allow us to give educational talks about the glider to bring awareness to the mission.
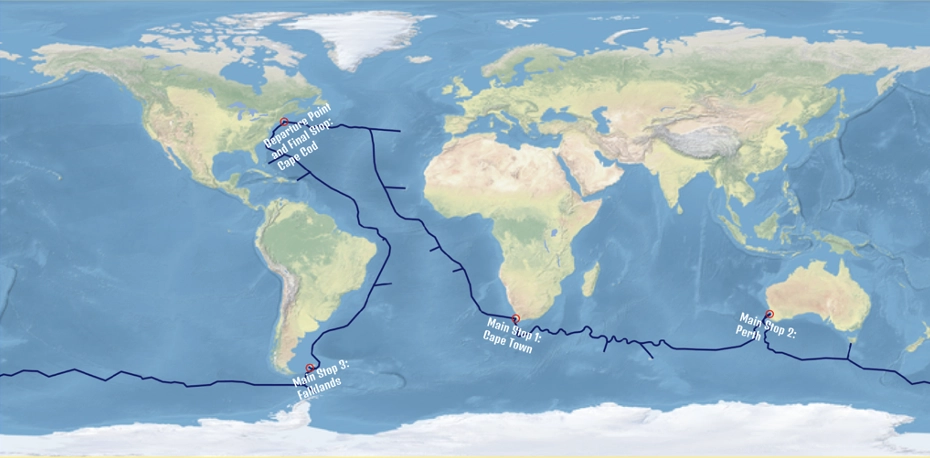
Map of the current flight plan of Sentinel Mission
The first part of our Mission will be taking us from Cape Cod, Massachusetts to Cape Town, South Africa. After that, we will head from Cape Town to Perth, Australia, and then to the Falklands, an island off the coast of South America. Lastly, we’re headed from the Falklands back to Cape Cod. This trip should take around 4 years and we will be launching this summer.
How we’re Doing it
A few things are necessary for our mission to be successful. As stated above, the glider is not very fast. To remedy that, we’ll be utilizing any currents that travel in our desired direction, like the Gulf Stream in the Atlantic Ocean. Our utilization of currents is pivotal as the glider can be taken from its base speed of around 30 km/day to over 150.
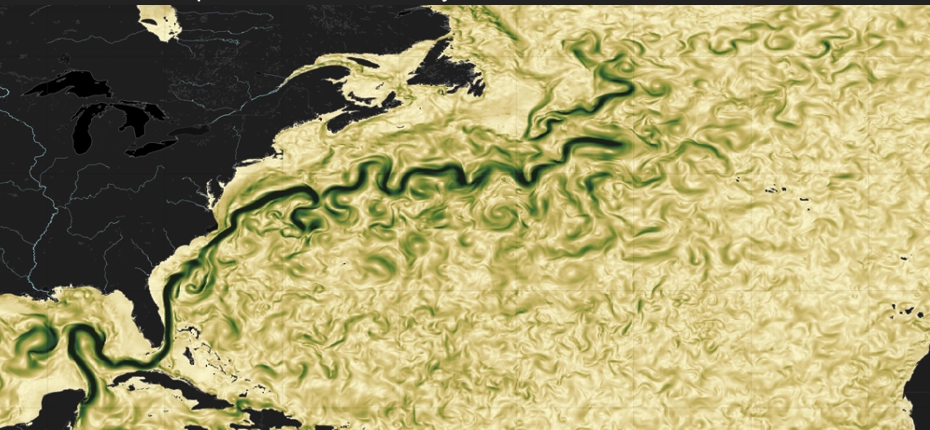
Map of the Gulf Stream and other currents in the Atlantic Ocean
From Cape Cod, we’ll be riding along the Gulf Stream for a while. We have a very talented crew working on our flight path, so they will be the ones in charge of deciding the most efficient path to take. We will be making a few stops on each part of our journey to check in on and recharge our glider. It will be imperative to be in contact with people who will be able to change our batteries and scrub off any biofouling that may affect the glider’s efficiency.
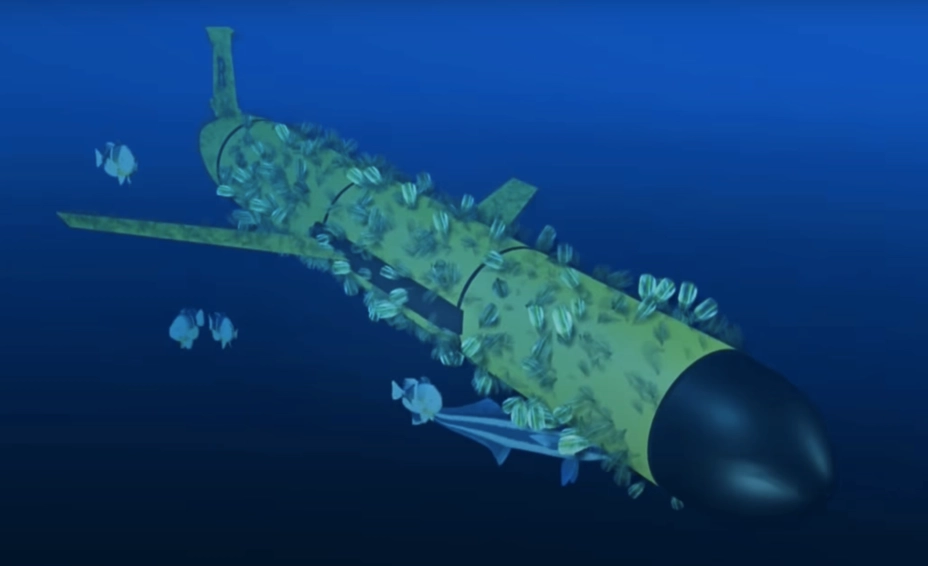
A computer rendering of barnacles growing on the glider taken from the Atlantic Crossing Glider Documentary
Why we’re doing it:
Why send a glider across the world? Water makes up 71% of the Earth’s surface. Despite how much of our planet is covered by the ocean, only 5% of it has been explored. Sending a glider around the world can provide a new perspective on how our ocean works while exploring the unknown. Another goal of the Sentinel Mission is to connect people around the world, just like our ocean does. By making stops at some select locations during its trip, the glider will bring local communities together and spread awareness for studying our vast ocean.
Alright everyone, that’s all that we’ve got to share with you this week! Be sure to stay tuned for any future updates! Sea you later!
3/22/2024
Dear Douglas Webb,
We are a large group of undergraduate students at Rutgers University. We are enrolled in a course Topics in Marine Sciences taught by Scott Glenn, Josh Kohut, and Oscar Schofield. This course is focused on interpreting the data collected by gliders deployed over the world. Every week we start off class by looking at ocean data collected by gliders that are at sea, we analyze the data and then discuss the underlying oceanography together as a class. What is amazing is that these glider tools let us go to sea while we are still taking other classes. As many of us are fully booked in our classes and hold jobs to pay for school, it is amazing that we still have the opportunity to explore the ocean in real time. This is only possible because of the vision you had decades ago and the work you did to make this vision a reality. We want to thank you for giving us an amazing opportunity.
We wanted to write to you today to tell you about the Sentinel Mission. Teledyne Marine has been working diligently on the Sentinel glider and they partnered with our class for conducting the first glider circumnavigation of this planet. We have been working on this mission for the past 18 months in preparation and this is a mission that will be anchored tirelessly by undergraduate students from around the world. We have been working on everything from mapping the route, to promoting the mission to our communities, businesses, other countries and universities from around the world.
Your vision decades ago has given us so many opportunities to learn more about the ocean and teach us, the next generation, about the great adventures in exploring this ocean planet. As we embark on this global mission, we are striving to “work hard, have fun, and change the world”. We want this mission to be in honor of your legacy that has permanently changed how we can interact with the ocean. We thank you for changing how we go to school, learn, and get inspired to meet the many global challenges facing us all. We have enclosed the sticker designed by us and really look forward to starting this mission in summer of 2024 and sharing our nautical adventures with you. Thank you Doug!
Yours truly,
The Sentinel Mission Undergraduates (Class of Spring 2024)
Peterson Baldera, Charlotte Bsile, Ireland Benson, Aiden Blanos, Gabrielle Bond, Christine Capria, Jason Cardona, Jonathan Chin, Shea Cinquemani, Sophia D’Arienzo, Terrika Davis, Jessica Defo, Justin Dirosa, Jaheem Ellison, Baylee Foreman, Tyonna Griffin, Michael Hasselmann, Sarah Keppler, Ezekiel Kloza, Tolga Kose, Shea Lawless, Matt Learn, Karolina Leleniewski, Amanda Lemasters, Christopher Maderia, Brendan McCann, Grace Mchugh, Helena Messihi, Elizabeth Morocho, Jefferey Mowen, Kenneth Navarrete, Hailey Nowak, Hirkari Oshiro, Giaminh Phan, Ashley Rosales, Victoria Samuel, Luis Saula, Sonia Sharma, Zoe Sousa, Abigail Stisi, Jessica Stochel, Greg Wareham, Keva Wilson, Marc Youhana, Devorah Zambas