


-
Leaning towards the regional models
Posted on August 24th, 2020 No commentsThe following is cut and pasted from the National Hurricane Center (NHC) Forecast Discussion at 5 am this morning:
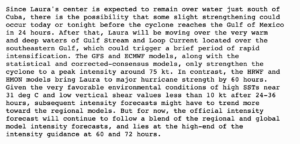
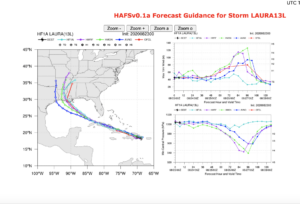
We also started a similar discussion in yesterday’s Hurricane Blog. The two operational regional models are continuing to agree this morning, and NHC may be leaning towards this consensus. Below is what this looks like from the NWS HAFS website. On the left, all the models are in tight agreement on the forecast track of Laura over Cuba, and across the Gulf up until landfall. On the upper right, the differences in the intensity forecast remain significant. The two regional models, HWRF (purple) and HMON (green), now using the same ocean initial condition derived from the data assimilative global GOFS model, still have Laura intensifying at 60 hours to a Cat 3 hurricane. One experimental model (light blue) is consistent with the consensus intensity of a tropical storm until 60 hours, but after 60 hours, instead of rapidly intensifying, keeps Laura as a weak tropical storm. The official intensity forecast from the NHC as described above is shown in red.
-
A good day for data assimilation
Posted on August 23rd, 2020 No commentsLet’s now look at Navy Glider NG645. Part of the annual Hurricane Glider Picket Line. The glider that is closest to the forecast track of Marco and Laura before the hurricane comes through.
Remember that the Hurricane Glider Picket Line has two purposes. The first purpose is to act in a coordinated fashion to resolve the Essential Ocean Features that impact hurricane intensity in each region that the hurricanes may pass over. This requirement to have a realistic ocean model forecast exists whether there is a hurricane or not, and benefits all users of the ocean model, including hurricane forecasters and models. The second purpose is to have at least one glider, and hopefully more, in place to witness the rapid evolution of the ocean as the hurricane passes. This provides data for the process and sensitivity studies that help improve the forecast models of the future. The two purposes have different sampling requirements, and the gliders have the flexibility for both.
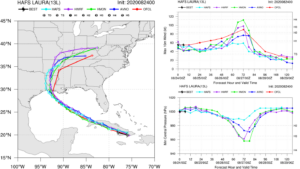
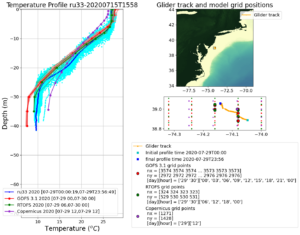
The first plot below is the temperature profiles provided by Navy Glider ng645 compared to the Navy global ocean model GOFS, the NOAA global ocean model RTOFS, and the European global ocean model Copernicus. My immediate impression is that the glider and the data assimilation schemes are doing their jobs. The daily spread in the glider profiles is nearly imperceptible, as is the difference between the US and European models. We see the surface layer of warm water above 26C is well less than 100 m deep, a shallow warm layer as expected based on the Sea Surface Height maps we looked in yesterday’s blog post. Our older textbooks say Marco will cool this layer through vertical mixing and leave a cooler ocean behind for Laura.
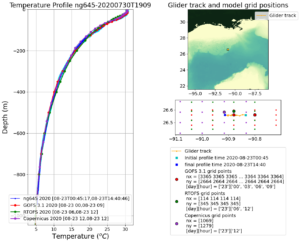
Now let’s look at salinity. Navy Glider ng645 daily salinity profile spread in light blue and the daily average in dark blue are compared to the three operational global models. Again, the differences are imperceptible. All the global models have a proper shape for the salinity profile, and even include a shallow fresh water barrier layer in the upper 40 m. The new textbook says this barrier layer is going to inhibit the mixing, so that Marco will not cool the ocean as much as expected, leaving behind a less cooled ocean for Laura. The Navy glider was out well before the storm, and there was plenty of time for the data to work its way through the system and into the models through the data assimilation system. The ocean model at the beginning of the hurricane forecast value chain, the Navy’s data assimilative GOFS model, could not be more ready. The Navy glider, and the Navy data assimilation into GOFS, is fulfilling the first purpose of the Hurricane Glider Picket Line as described above.
Tomorrow, and throughout the week, we watch Navy Glider ng645 fulfill the second purpose of the Hurricane Glider Picket Line to capture the rapid evolution of the ocean as two hurricanes pass over it.
-
Ocean conditions for Marco and Laura
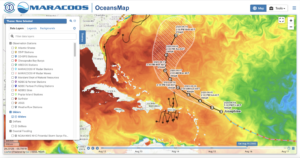
Posted on August 23rd, 2020 No commentsBoth Marco and Laura are forecast to intensify as they cross the Gulf and approach the coast of Louisiana. Lets check the ocean conditions they are encountering (Marco) or will encounter (Laura).
First we look at Sea Surface Temperature (SST) from the data assimilative Navy GOFS model. Here the temperature scale ranges from 25C to 32C. Marco is already over the Loop Current and Laura will pass over it. Both storms will be crossing over some of the warmest sea surface temperatures in the northern Gulf off the coast of Louisiana. A good contrast in what Marco will do to the deep warm waters of the Loop Current compared to the shallow warm waters of the northern Gulf before Laura passes over them.
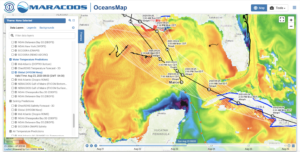
Below is the Sea Surface Salinity (SSS) map for the Gulf, with the color scale going from 34 to 37. The low surface salinity waters of the Mississippi River are evident on the Texas, Louisiana, Mississippi, Florida shelf. Our experience in the Caribbean during Isaias reminds us that the low salinity barrier layers inhibit mixing, resulting in less cooling of the surface waters, and greater potential to intensify the hurricanes.
Another natural experiment on the coupled ocean-atmosphere response to 2 hurricanes will unfold over the next few days. In our textbooks, we are told that the first hurricane is supposed to mix and cool the waters so the second hurricane has less warm water to promote intensification. But the warm water in the south is the deep Loop Current that does not cool rapidly. And the warm water is blanketed by a low salinity barrier layer that inhibits mixing. The storms will be passing by Navy Glider NG645 which has been on station this season as part of the annual Hurricane Glider Picket Line. Again, much more to learn if we form the research teams to look.
-
Laura – another science storm for 2020
Posted on August 23rd, 2020 No commentsThis morning’s NHC forecast calls for Laura to continue tracking from Hispaniola along the spine of Cuba, enter the warm 31C waters of the Gulf and intensify as it moves across the Gulf towards landfall in Louisiana. With the new HWRF v13.0.0 moved to operational status on Aug 5 at 12Z, the focus of our discussions changes. All operational and many experimental models are now using the same ocean, the high quality representation derived from the Navy’s data assimilative GOFS, which is used to initialize the NOAA global RTOFS that layers in the NOAA global winds, which is then used to initialize the ocean models coupled to HWRF, HMON, and FV3 (in HAFS v0.1.a). Lets begin by looking at how this high quality ocean forecast may be influencing the hurricane forecasts.
Yesterday was a remarkable day for Laura hurricane forecasts. We noted there were significant differences in track between the 3 models (HWRF, HMON, and HAFS (v0.1.a)), and that there were significant differences in the resulting intensity as Laura entered the warm Gulf. HWRF took a more easterly track that resulted a rapid intensification to Cat4, HMON and HAFS tracked more towards Texas and was forecast to stay near or below Cat1. But how much of the difference in intensity forecast is due to the different atmospheric models, and how much is due to the different atmospheric and ocean conditions encountered along the different tracks. It is hard to separate the two. You either want the same model along two different tracks to look at the influence of track differences, or different models along the same track to look at model differences.
That makes today’s forecasts for Laura an even more remarkable day for hurricane science. Below are the forecast model results from the NOAA NWS HWRF website. Here on the left we see the HWRF (purple) and HMON (green) forecasts follow almost the exact same track into Louisiana until just before landfall. On the upper right, we see the intensity forecasts. Both HWRF (purple) and HMON (green) are predicting the rapid intensification event at the exact same time, 72 hours into the forecast. Both have it rapidly intensifying to Cat 4. Different models, same track, same ocean, same intensity forecast.
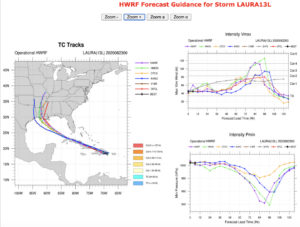
Now lets check in on one of the experimental models in HAFS, specifically version 0.1.a that is coupled to the same ocean as HWRF and HMON. Below on the left, HAFS in light blue is also crossing the Gulf on essentially the same route as HWRF and HMON, also landfalling in Louisiana, but a bit west of the others. But HAFS keeps Laura below hurricane strength the entire time.
This example illustrates the challenges of hurricane forecasting. We are 4 days before the forecast landfall in Louisiana, and with Laura, we see the models converging on a similar solution for track, but still diverging on the solution for intensity. We see that for Laura, the different HWRF and HMON models, now using the same ocean since Aug 5, converge to the same intensity forecast once the track converges. This was not the case as recently as Isaias, the storm just before Aug 5 when HMON used the high quality ocean derived from the Navy’s data assimilative GOFS, and HWRF was still using climatology.
We are learning much from this hurricane season. We are seeing improvements along the entire value chain, from the observing systems we deploy, to our ability to assimilate the data, and on to the coupled atmosphere-ocean models used for the hurricane models. And we are seeing what the NWS annual reviews have been saying for years, that we continue to make progress on track forecasts, but that improvements to intensity forecasts lag. We desperately need the research to figure out why. We have a vast pool of researchers at NOAA, the Navy, in universities and in industry that are willing to contribute, and we have the regional expertise already assembled and coordinated through U.S. IOOS and the OAR Cooperative Institutes. It is time to expand the Hurricane Forecast Improvement Program (HFIP) across agencies, across sectors, and across disciplines. If the answer is HFIP is already doing this, my question will be the same as it has been since Sandy, are we doing enough?
-
Laura and the Loop
Posted on August 22nd, 2020 No commentsThe NHC forecast discussion from this morning nicely summaries the expectations for Tropical Storm Laura as at moves into the Gulf of Mexico over the weekend. The intensity forecast approaching the Gulf is highly track dependent. If the track is mostly Hispaniola and Cuba, the rugged terrain favors keeping the intensity low. If the track is more over the water, the warm ocean favors an earlier increase in intensity. The larger intensity uncertainty occurs when Laura enters the Gulf.
For the operational models in the Gulf, HWRF track is more to the east, landfalling in MS and has a significant intensity increase to Cat 4 crossing the Gulf. HMON has a track more to the west and keeps the intensity relatively steady below Cat 1 until approaching landfall in TX. The new experimental HAFS model favors a track similar to HMON but with an intensity that never increases beyond tropical storm.
https://www.emc.ncep.noaa.gov/gc_wmb/vxt/HMON/tcall.php
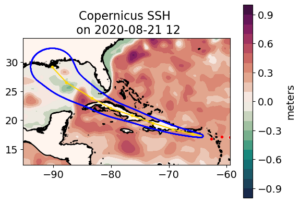
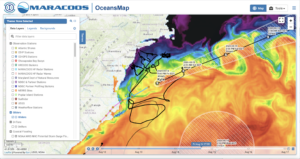
It has been a season for science storms. What this storm does after it enters the Gulf will be a test case for future model improvements. Part of those studies will be to better understand the impact of the ocean on intensity. As Laura enters the Gulf, it will be crossing the Gulf’s most significant Essential Ocean Feature for hurricane intensity, the Loop Current. We start with a look at the Loop Current state in the two data assimilative global ocean models, the Navy GOFS and European Copernicus. Maps of Sea Surface Height (SSH) are plotted below from both models.
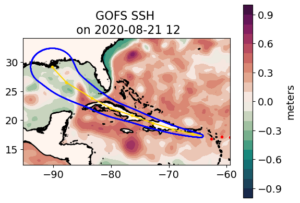
In the figure above and below, the Loop Current is high (red) sea surface height area that enters the Gulf between Yucatan and Cuba and then leaves the Gulf between Florida and Cuba. Comparing the two models we see the Loop Current position is very similar, with some slight variations in the east-west width. The models also agree that there is warm eddy north of the Loop Current and just south of Mississippi that will likely play a role in the intensity forecasts. We see the eastern path of Laura towards MS is near this warm water feature, while the western path towards TX is over more cold water (low SSH in green) features until you approach the coast of TX, when HMON says the storm could intensify.
In one more plot, that warm eddy we looked at during Cristobal that was along 90W. It is now in the western Gulf centered around 94W. It is shown in the GOFS SSH plot below and is to the west of the forecast track cone for Marco.
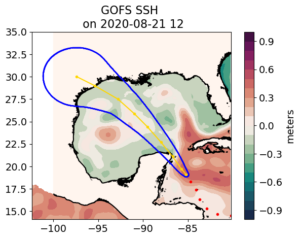
Looks like the focal points for the oceanographers for these storms will be the details of the Loop Current shape and the warm eddy south of Mississippi.
-
Two storms approach the Gulf
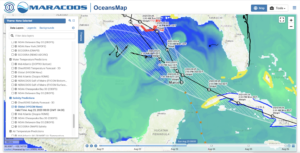
Posted on August 21st, 2020 No commentsTwo tropical storms are approaching the Gulf of Mexico. Tropical Storm Laura is currently over the Caribbean’s Windward Islands and is forecast to travel along the Greater Antilles along the cooler northern side of the Islands and into the very warm Sea Surface Temperatures (SST) of the Gulf were it is expected to intensify into a hurricane. Fourteen is moving northward over the warm waters of the western Caribbean towards Yucatan, then into the very warm Gulf where it is expected to intensify to a hurricane. By Tuesday next week we could have 2 hurricanes intensifying in the Gulf and about to be making landfall along the northern Gulf Coast. The very warm ocean features of the Gulf will be something to watch over the next few days. Here we are looking at the general ocean features in the Navy’s data assimilative Global Ocean Forecast System (GOFS), the start of the value chain for 3 US coupled hurricane forecast models, the operational HWRF and HMON as well as the experimental HAFS with the new FV3 core. The temperature range of the SST color bar is 25C to 31C.
In parallel, we also watch for the low salinity barrier layers due to freshwater inputs from rivers. They are viewed below in the Sea Surface Salinity (SSS) fields also derived from the data assimilative GOFS. We see the fresh water barrier layers in the eastern Caribbean due to the Amazon and Orinoco, and the fresh water spread along the northern Gulf from the Mississippi. Here the color bar range is for salinities from 34 to 37.
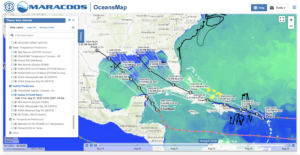
So two storms entering the Gulf this weekend, both expected to intensify into hurricanes over the Gulf’s warm water early in the week, and both will be passing over the Mississippi’s freshwater barrier layers
-
A milestone week for distributed autonomy
Posted on August 14th, 2020 No commentsJust a quick shot of Kyle off the Mid Atlantic from OceansMap. Kyle is forecast to hit the warm water in the many Gulf Stream meander crests as it travels northeast. Below that is a view of Josephine as it skirts the edge of the warm water on its path just east of the Caribbean’s Windward Islands toward our friends in Bermuda operating the BIOS gliders. Two tropical storms, but the significance for us will be looking at how the new version of HWRF performs in each.
Isaias was a grand success with hurricane gliders deployed along its entire track through the IOOS regions CARICOOS, SECOORA and MARACOOS.
A science storm. Strong enough to get our attention and motivating even broader collaborations with scientists from the Argo float, underwater Glider and surface drifter communities starting to coordinate their observations and science through NOAA OAR’s Ocean Observing for Extreme Events (OOEE) working group. But Isaias used the previous version of HWRF that did not benefit from the modern suite of data assimilative ocean models.
Josephine and Kyle are being forecast using the new version of HWRF, version 13.0.0, made operational by NWS on August 5 at 12Z. We have already seen some excellent new HWRF features like improved bathymetry and an initial ocean condition derived from the NOAA global RTOFS that, in turn, is derived from the data assimilative Navy GOFS model shown in the figures above. Josephine and Kyle are the first two storms where both operational hurricane models, HWRF and HMON, have an initial ocean condition that can trace its roots to a data-assimilative ocean model. For the first time we have complete end-to-end data flow from the Hurricane Glider Picket Line to both operational hurricane models. Construction of the value chain running from ocean data delivered by a distributed network of autonomous ocean gliders to inclusion in operational forecasts is now complete.
It took so many people, and a process we began in 2014, to deliver this week on the promise of distributed autonomy for hurricane forecasting. The Concept of Operations (the ConOps as we call it) for this is new. Different gliders on different missions operated by different groups funded for different purposes by different government agencies like NOAA, Navy, NSF, industry partners like Shell in the Gulf or Orsted in the Mid Atlantic, or foundations like Vetlesen in the Caribbean, all contributing their near real time quality-controlled data in standard formats through the IOOS Glider DAC so that it can be delivered via GTS to the global modeling centers for improved hurricane forecasts. We are a distributed team with so many collaborators from NOAA OAR, NOS and NWS, the Navy, IOOS and its North Atlantic hurricane-prone Regional Associations (MARACOOS, SECOORA, GCOOS and CARICOOS), industry partners (energy sector, data management, glider manufacturers, sensor manufacturers) and academics from the Caribbean to the Gulf of Mexico to the Gulf of Maine. We have dedicated time and effort to deliver the technology, the scientific justification, and the real time data streams we need to support improved forecasts for all. We have demonstrated that by engaging the many strengths of our distributed community, it can be done.
Work hard, have fun, change the world. Thank you Doug Webb for these words to live by.
Happy Friday All.
-
RUCOOL Updates: June & July, 2020
Posted on August 12th, 2020 No commentsDespite the COVID-19 pandemic, RUCOOL remains active. Core technologies (storm gliders, HF-Radar and the Tuckerton meteorological station) were deemed critical research tools based on national security requirements and continue to be supported. These activities are guided by an operations plan that maintains recommended COVID best practices.
State
- Working with Atlantic Shores Offshore Wind, RUCOOL installed a wind LiDAR (Light Detection And Ranging) instrument alongside the causeway leading to RUMFS in Tuckerton, NJ. This fully autonomous sensor platform, owned and operated by Atlantic Shores, will provide observations of the atmospheric wind profile for the next several years, and provide vital information on the wind to stakeholders in the area.
- RUCOOL continues to participate in the public comment actions of both BOEM and NJBPU to contribute our expertise on ocean and atmospheric related monitoring and mitigation as it applies to the implementation of the offshore wind industry along the New Jersey and Mid-Atlantic coasts.
- The RUCOOL Education Team worked on the Virtual 4-H STEM Ambassadors program that supported 60 teens from Trenton, Union, Atlantic City, Passaic, New Brunswick, and Newark in an online summer program.
- Glider RU34, a new Slocum glider purchased for the Orsted ECO-PAM project, was deployed on July 29. The glider is equipped with the passive acoustic sensor designed to track vocalizing right whales in the area within and around Orsted’s Ocean Wind lease area off of NJ. Within hours of deployment, the glider identified tagged marine animals.
- On July 22, a catamaran flipped off the NJ coast, and was left to drift when the operators were rescued. The derelict boat became a drifting marine hazard. Operational Oceanography Graduate Student Joe Anarumo ran several drift simulations that predicted the current and future locations of the boat, guiding the recovery effort.
- The first two Masters of Operational Oceanography students will be defending their theses in August! They have already acquired jobs as oceanographic data analysts at NOAA CO-OPS and a consulting company. The second cohort of students are preparing for classes this fall. Students will ‘adopt-an-instrument’ and follow the full life-cycle collection of data this fall for improved hurricane forecasting, ocean acidification monitoring, and offshore wind assessment.
- The R/V Arabella, Rutgers’ flagship research vessel throughout the 90’s and early 2000’s, returned to service on May 20, 2019. Progress has been made in recent months to enhance capabilities and meet specifications largely outside of typical operations, with a short term goal of qualifying as a support vessel for local, sustainable wind energy development offshore. Bon voyage, Arabella!
National
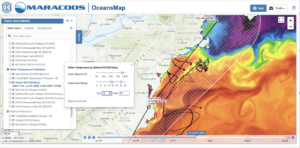
- During the busiest hurricane season ever through July 31, the RUCOOL glider team organized glider deployments throughout the Mid Atlantic, funded by NOAA. Partners this year include UMass Dartmouth, Virginia Institute of Marine Science, the University of Delaware, SUNY Stony Brook, Monmouth University and the US Navy. In July, RUCOOL, in partnership with Monmouth University, deployed two US Navy gliders along the NJ Coast. Additionally, RU33 was deployed in support of the NOAA Hurricanes project. These three gliders are the first in what is expected to be a fleet of 7-10 gliders in the mid-Atlantic this summer focused on studying the ocean physics that impacts hurricane intensity. Information on and data from these gliders can be accessed at https://oceansmap.maracoos.org/ and https://marine.rutgers.edu/cool/data/gliders/
- RUCOOL maintains the high profile Hurricane Blog. It documents in real-time research findings focused on Fay, Gonzalo, Hanna and Isaias. The blog site (https://rucool.marine.rutgers.edu/blog/category/hurricanes/)is circulated by NOAA leadership and was distributed through the US IOOS Eyes-on-the-Ocean as a recommended data resource.
- The RUCOOL Education team’s Polar Literacy project is creating replicable means of bringing polar education to informal learning environments, extending our understanding of how polar education initiatives can be delivered to youth, and designing a professional development model to improve the capacity for Polar Region researchers to craft meaningful broader impacts. This summer we are offering several virtual online weeklong programs for middle school youth including July 27-31 Ohio 4-H Program, July 27-31 The Franklin Institute, PA, August 3-7 NJ 4-H (Newark), August 10-14, NJ 4-H (Trenton).
- Given the response to COVID, The NSF funded residential summer internship program, RIOS, had to be quickly reimagined. Working with NSF and the Data Labs project team, we were able to offer fully virtual experiences to an exceptions cohort of students across the country, including all time zones between Guam and Puerto Rico See https://datalab.marine.rutgers.edu/2020-virtual-reu/.
- The Data Labs team, in partnership with Rutgers RIOS, hosted an 8-week Research Experience for Undergraduates (REU) program for 16 students across the country, including Alaska, Guam and Puerto Rico. The experience started with a 2-week workshop with daily Zoom sessions on working with large datasets, an introduction to Python programming, science communication and career and graduate student panels. Students then spent 6-weeks working with mentors across the country on individual research projects. Their final posters are available on the project site, along with a map.
- The Data Labs team continues to work with faculty partners on the Data Labs Notebook which will be pilot tested this fall by 15 faculty. We are also continuing to work with our 2020 Fellows as they finalize their projects.
- The Data Labs Blog continues to feature articles on Ocean Observing Education, Python tutorials and examples of Labs.
International
- Travis Miles joined Scott Glenn on the NOAA Global Ocean Monitoring and Observation (GOMO) Program, specifically to work on their Ocean Observing for Extreme Events (OOEE) Team. The team is coordinating glider, Argo and surface drifter deployments for the 2020 hurricane season. Response to Isaias was the first coordinated event.
Student Awards
- Congratulations to Jessica Valenti on being selected to receive a National Science Foundation Postdoctoral Award. Using the Rutgers University Marine Field Station’s larval fish collection spanning the last 30 years, Jessica will investigate microplastic ingestion in larval fish from past and present to better understand the potential for microplastic accumulation in larval fish predators and examine larval fish characteristics that may influence microplastic ingestion. In addition, Jessica will help improve methods commonly used to identify microplastics, mentor undergraduate students on independent research projects.
Newly Funded Research
- US Integrated Ocean Observing System (IOOS), NOAA, 2020-2021, “Mid Atlantic Regional Association Coastal Ocean Observation System” ($4,053,639), S. Glenn.
- Office of Naval Research, 2020-2022, “Onboard Processing of Slocum Glider Velocity Profiles” ($545,809), T. Miles.
- Consortium for Ocean Leadership (through NSF), 2020, modification to “OOI Educational Support and Synthesis Based on the Initial Phase,” ($20,000), S. Glenn.
Papers Published: (**Current or Former Graduate Student or Postdoctoral Researchers)
- Beaird, N. L., Shroyer, E. L., Juranek, L. W., Hales, B., & Goñi, M. A. 2020. Nutrient‐rich gravity current formed by upwelling in Barrow Canyon: High‐resolution observations. Journal of Geophysical Research: Oceans, 125, e2020JC016160. DOI: 10.1029/2020JC016160
- Sherman, J.,, Gorbunov, M., Schofield, O., Falkowski, P. 2020. Photosynthetic energy conversion efficiency in the West Antarctic Peninsula. Limonlogy and Oceanography. DOI: 10.1002/lno.11562
- Carvalho, F., Gorbunov, M., Haskins, C., Oliver, M. J., Kohut, J., Aragon, D., Schofield, O. 2020. Mapping variable chlorophyll fluorescence using autonomous underwater gliders. Limnology and Oceanography Methods. DOI:10.1002/lom3.10380PDF
- Eichhorn, M., Aragon, D., Yuri A.W. Shardt, Hugh Roarty. August 2020. Modeling for the performance of navigation, control and data post-processing of underwater gliders. Applied Ocean Research Volume 101. DOI:10.1016/j.apor.2020.102191
RUCOOL Meetings & Conferences
- Though there were no in person meetings due to COVID, there were plenty of virtual meetings during the last two months: MARACOOS Board Meetings (several meetings), LTER Executive meeting, SCAR West Antarctic Working Group, Marine Technology Society Board Meeting, MAC Fish Habitat Workshop, Microrider Training 3 Day Workshop, Mid Atlantic Harbor Operations Meeting, USCG Wind Turbine Mitigation Meeting, Presentations to several local NJ Schools on various oceanography topics, Modeling, Prediction and Sensor Network for Coastal Flooding on the US East Coast, Weekly GOGO OOEE Meetings, Biweekly National Academies’ Ocean Studies Board meetings on the US Contribution to the Ocean Decade, and on Diversity, Equity and Inclusion in Ocean Sciences, Weekly NOAA Science Advisory Board (SAB) Environmental Information Services Working Group reviewing NOAA’s response to the Weather Act, Interagency Ocean Observing Committee (IOOC) meeting on the UN Ocean Decade, IOOS Data Management Monthly Call.
-
Preparing for Isaias with a Great Global Model
Posted on July 31st, 2020 No commentsThis morning’s MARACOOS operations meeting focused on the final preparations before the forecast passage of Hurricane Isaias. Here is a quick update on the operational models they support.
First is a 3 day composite satellite sea surface temperature map of the Mid Atlantic generated by Matt Oliver with the underwater glider tracks in black and the forecast track (black) and cone (white) of Isaias plotted on top. The color bar on the SST is adjusted to highlight temperatures from 18C to 30C. We see the warm Gulf Stream offshore with Robert Todd’s gliders in them. The cluster of NSF OOI gliders south of Cape Cod that are in that cold water that is advecting south along the shelf break, and the MARACOOS and Navy gliders on the shelf mapping the bottom cold pool that lies below the very warm shelf surface water – nearly as warm as the Gulf Stream.
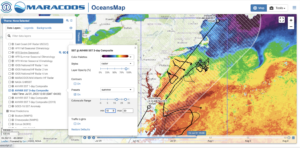
First we look at the Navy Global Ocean Forecast System (GOFS) from the top. Here we plot SST from GOFS using the same color scale as above. Se see the warm Gulf Stream Offshore. The advection of the cold surface water through the NSF OOI array. And the warm surface water over the shelf.
But what is happening below the surface? Is GOFS, the start of our data assimilative value chain, getting the Mid Atlantic’s Cold Pool?
Here is one of those glider data/model comparisons that Maria generates every day. Blue is the data from the glider, with light blue being all the profiles and dark blue being the average. Red is the Navy GOFS, start of the ocean component of the hurricane forecast value chain. The surface temperature is spot on. The thermocline is spot on. Bottom temperature is close. The European model is a little cooler at the top and warmer at the bottom, which reduces the slope and therefore the stratification. Getting the shelf response right is all about the stratification. Then in green is the NOAA ROTFS model, next step in the hurricane value chain where the NOAA winds are layered on. The surface temperature is right. The surface mixed layer temperature is right. The slope of the temperature change in the thermocline is right. The bottom temperature is right. And this is from a suite of global models – informed by local data.
Results like this have been a long time in the making. In the Mid-Atlantic, in MARACOOS, and in our Universities with our students, we have been working this issue since the back to back impact years of Irene and Sandy. It represents the persistent efforts of our dedicated field crews that work to maintain our observation network, our modelers for ROMS and WRF, and our data managers up at RPS in Rhode Island that keep OceansMap working every day. It is the work of our many glider partners from the people that make the gliders at TWR in Massachusetts, to the people that fly them, to the people that manage the data at the US IOOS Glider DAC, the pilots at the Navy GOC, to the people at NDBC that send the data off through the GTS, and to the people that pull it out of the data tanks and into their operational models. It is the work of the Navy modelers at NRL Stennis that spent countless hours helping us track the data through the assimilation system, and the NOAA modelers at NCEP that keep RTOFS running and answer our many, many questions about the operational system, especially our good friends Hyun Sook and Zulema who work with Maria everyday. To our partners in research at AOML, and across the IOOS Regional Associations along the hurricane pathways – together we have defined the Essential Ocean Features that impact hurricane intensity in our regions, and together with IOOS, OAR, Navy, NSF, the universities, the energy industry, and the glider manufacturers, we have assembled the hurricane glider picket line that monitors those features and protects our nation’s coasts like the soccer goalie protects the goal. Literally the work of hundreds of people going into what is summarized above in 3 simple plots – the Mid Atlantic is Ready.
Bravo Zulu.
Force, wind and honor.
Work hard, have fun, change the world.
They all apply. We are getting the job done.
Happy Friday All.
-
One Ocean for Potential TS Nine
Posted on July 28th, 2020 No commentsIn terms of the ocean, we have never been more ready. Potential Tropical Storm Nine is crossing over the same ocean in all the forecast models.
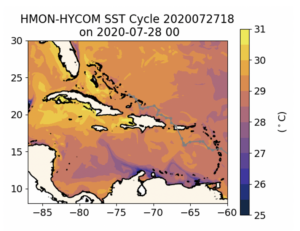
Here is SST from HMON’s HYCOM. This is part of the global GOFS to global RTOFS to regional HYCOM value chain.
We see the same features we talked about in the morning blog on the global models.
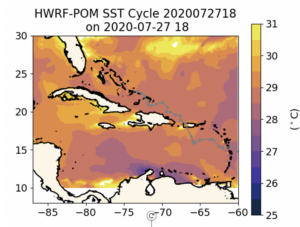
Here is the SST from HWRF that is coupled to MPIPOM. Focus on the Caribbean and along the track of the storm. The features are nearly the same. The cold water upwelled along the coast of South America is being advected around the Caribbean-wide anticyclonic feature south of Hispaniola in HMON and HWRF. The warmest water is up by Puerto Rico where AOML has the densest part of glider picket line in place well in advance. We saw in the morning blog that within that region covered by the gliders, the global models are all in really good agreement, telling us that even the different assimilation schemes appear to be bringing us closer together. The temperature ranges are so similar in these plots. All the US models are lining up in agreement on the basic Essential Ocean Features and temperature range before the storm, with the European Copernicus now representing a similarly structured but slightly warmer version of the ocean.
Much more to look at tonight. But from this initial look at the ocean side, we can’t be more ready.
