


-
Preparing for Isaias with a Great Global Model
Posted on July 31st, 2020 No commentsThis morning’s MARACOOS operations meeting focused on the final preparations before the forecast passage of Hurricane Isaias. Here is a quick update on the operational models they support.
First is a 3 day composite satellite sea surface temperature map of the Mid Atlantic generated by Matt Oliver with the underwater glider tracks in black and the forecast track (black) and cone (white) of Isaias plotted on top. The color bar on the SST is adjusted to highlight temperatures from 18C to 30C. We see the warm Gulf Stream offshore with Robert Todd’s gliders in them. The cluster of NSF OOI gliders south of Cape Cod that are in that cold water that is advecting south along the shelf break, and the MARACOOS and Navy gliders on the shelf mapping the bottom cold pool that lies below the very warm shelf surface water – nearly as warm as the Gulf Stream.
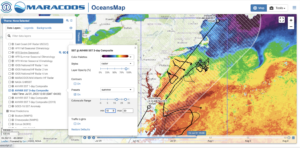
First we look at the Navy Global Ocean Forecast System (GOFS) from the top. Here we plot SST from GOFS using the same color scale as above. Se see the warm Gulf Stream Offshore. The advection of the cold surface water through the NSF OOI array. And the warm surface water over the shelf.
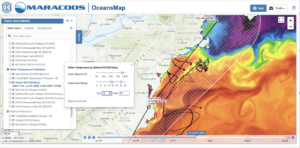
But what is happening below the surface? Is GOFS, the start of our data assimilative value chain, getting the Mid Atlantic’s Cold Pool?
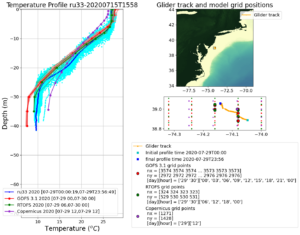
Here is one of those glider data/model comparisons that Maria generates every day. Blue is the data from the glider, with light blue being all the profiles and dark blue being the average. Red is the Navy GOFS, start of the ocean component of the hurricane forecast value chain. The surface temperature is spot on. The thermocline is spot on. Bottom temperature is close. The European model is a little cooler at the top and warmer at the bottom, which reduces the slope and therefore the stratification. Getting the shelf response right is all about the stratification. Then in green is the NOAA ROTFS model, next step in the hurricane value chain where the NOAA winds are layered on. The surface temperature is right. The surface mixed layer temperature is right. The slope of the temperature change in the thermocline is right. The bottom temperature is right. And this is from a suite of global models – informed by local data.
Results like this have been a long time in the making. In the Mid-Atlantic, in MARACOOS, and in our Universities with our students, we have been working this issue since the back to back impact years of Irene and Sandy. It represents the persistent efforts of our dedicated field crews that work to maintain our observation network, our modelers for ROMS and WRF, and our data managers up at RPS in Rhode Island that keep OceansMap working every day. It is the work of our many glider partners from the people that make the gliders at TWR in Massachusetts, to the people that fly them, to the people that manage the data at the US IOOS Glider DAC, the pilots at the Navy GOC, to the people at NDBC that send the data off through the GTS, and to the people that pull it out of the data tanks and into their operational models. It is the work of the Navy modelers at NRL Stennis that spent countless hours helping us track the data through the assimilation system, and the NOAA modelers at NCEP that keep RTOFS running and answer our many, many questions about the operational system, especially our good friends Hyun Sook and Zulema who work with Maria everyday. To our partners in research at AOML, and across the IOOS Regional Associations along the hurricane pathways – together we have defined the Essential Ocean Features that impact hurricane intensity in our regions, and together with IOOS, OAR, Navy, NSF, the universities, the energy industry, and the glider manufacturers, we have assembled the hurricane glider picket line that monitors those features and protects our nation’s coasts like the soccer goalie protects the goal. Literally the work of hundreds of people going into what is summarized above in 3 simple plots – the Mid Atlantic is Ready.
Bravo Zulu.
Force, wind and honor.
Work hard, have fun, change the world.
They all apply. We are getting the job done.
Happy Friday All.
Last 5 posts by Scott Glenn
- Early Season in the Mid Atlantic - June 17th, 2021
- Disturbance in the Gulf - June 16th, 2021
- Hurricane Gliders 2021 - May 3rd, 2021
- Hurricane Iota - November 16th, 2020
- Hurricane Eta - Low Wind Shear, High SST - November 2nd, 2020
