


-
Hurricane Hanna
Posted on July 25th, 2020 No commentsHanna is forecast to become a hurricane today as it approaches landfall. Lets look at the ocean’s Sea Surface Temperature (SST) in the 3 global models beneath Hanna.
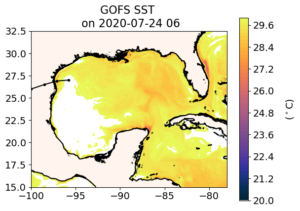
Keeping with the “It starts with us” tradition, here is the Navy Global Ocean Forecast System (GOFS 3.1). The track of Hanna is shown as the black line with the eye location dots approaching the Texas coast in the western Gulf. The SST is very warm, so warm it goes off of our standard scale and turns white for above 30C. In this region, forecasters often look to see if the surface temperature is above 26C for a quick assessment of how much the ocean supports intensification. Looks like it does. Hanna is currently over the warmest water, and that water cools down to the 28C range as it approaches shore. Note that the cooling down goes to 28C, which is still above the 26C diagnostic.
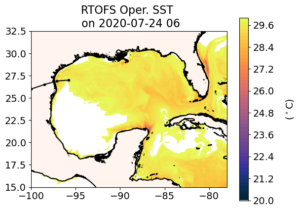
Now lets move to GOFS descendent RTOFS. Recall that RTOFS backs up two days into GOFS to get its initial conditions, giving up 2 days of data assimilation in favor of getting the NOAA global windfields over the ocean. The fields are nearly identical, with a slight shift of the over 30C water south along the Texas coast and east along the Yucatan coast. In this case, the warm water extending beyond our color bar turns into an unexpected benefit.
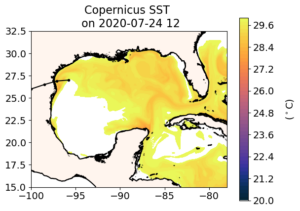
Now on to the European model. The western Gulf looks similar to GOFS – both are assimilating the same satellite SST data and SST dominates at the surface. Details differ, and offer room for investigation. But what really catches my eye is the western Caribbean where we see warming in the progression of models from GOFS to RTOFS to Copernicus. This area of the Caribbean between the Nicaraguan Bank and the Yucatan Strait between Mexico and Cuba is on the hurricane pathway into the Gulf of Mexico. The fresh water barrier layers we find so important east of the Nicaraguan Bank appear to be absent in this region.
At some point I hope to add similar snapshots of the ocean under the operational hurricane models, the regional HMON and HWRF. HMON uses the regional HYCOM derived from RTOFS. It is the endpoint in the GOFS to ROTFS to HYCOM value chain. We can already imagine what the regional HYCOM will look like, similar to the models from which it is derived. But operational HWRF is coupled to MPIPOM which uses a different value chain to get its initial condition. So the critical step here is getting MPIPOM, but this still requires human intervention. Access to the global models is public, and is easily automated so our model/data comparisons run in the middle of the night while we sleep. The operational models are where they should be, protected behind the firewall. This is one reason why the ocean community is looking forward to the new, more open, Hurricane Analysis and Forecast System (HAFS). The first model scheduled to move into the HAFS environment is HWRF. Which ocean is coupled to the version of HWRF that will someday be in HAFS is of high interest.
Last 5 posts by Scott Glenn
- Early Season in the Mid Atlantic - June 17th, 2021
- Disturbance in the Gulf - June 16th, 2021
- Hurricane Gliders 2021 - May 3rd, 2021
- Hurricane Iota - November 16th, 2020
- Hurricane Eta - Low Wind Shear, High SST - November 2nd, 2020
