


-
PELAGIA data-model comparison
Posted on September 11th, 2018 No commentsSending these along quickly to get them to partners at SECOORA and Skidaway University as fast as possible for the briefs they are giving.
They are of Glider PELAGIA deployed yesterday by Catherine Edwards for SECOORA.
Today’s plot is especially interesting, the mirror image of the issues in the Mid Atlantic.
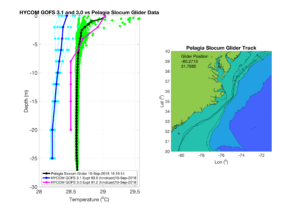
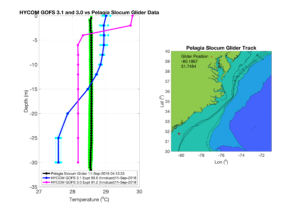
In this case the glider data is nearly isothermal, very warm, like 28.5 C.
But here the operational models have a two-layer structure with warmer surface temperatures and colder bottom temperatures.
There still is a lot to discover on how the operational ocean models respond compared to the real ocean observed by the glider.
And we need to remember that this is a global model, designed more for deepwater –
But it is a seamless ocean boundary condition for HWRF that runs from deepwater across the shelf – just like a hurricane.
We have the published evidence that the MAB shelf can impact the hurricane intensity, and now we will see in real time how the SAB shelf responds and possibly see if it has an impact on intensity.
We are making great progress and continuing to learn how to improve our forecast models.
Good luck to our friends in the South Atlantic Bight.
Scott
Last 5 posts by Scott Glenn
- Early Season in the Mid Atlantic - June 17th, 2021
- Disturbance in the Gulf - June 16th, 2021
- Hurricane Gliders 2021 - May 3rd, 2021
- Hurricane Iota - November 16th, 2020
- Hurricane Eta - Low Wind Shear, High SST - November 2nd, 2020
