


-
Sept 11 Sentinel Glider Tour
Posted on September 14th, 2018 No commentsA first tour of the Hurricane Sentinel Glider Fleet on Sept 11 as Florence was still approaching and a comparison to the operational models. Note that the data was transmitted over the GTS so it was available for assimilation in the models. All plots were prepared by Maria Aristizabal.
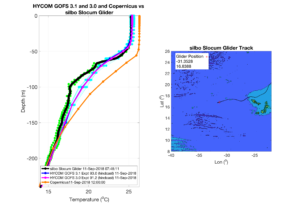
The first picket line is off Africa in the formation zone where the north-south extent is relatively narrow.
TWR Glider SILBO indicates the GOFS models are getting the surface layer quite well. All models miss the colder temperature layer near 100 m, but all are back in good agreement between 150 and 200 m.
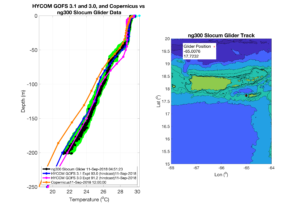
Second picket line. The Caribbean and Tropical Atlantic.
First is the station keeping Navy Glider NG300. GOFS models doing well, especially GOFS 3.1
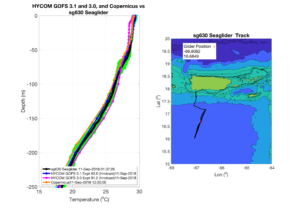
Next is the AOML Glider SG630 occupying the transect south of PR. All models agree well.
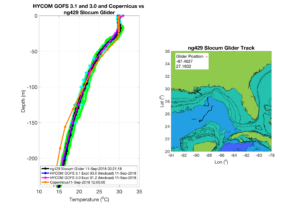
Then the third picket line protecting the US Mainland.
Gulf of Mexico first.
Navy Glider NG429 is in deepwater. GOFS models do well in deepwater.
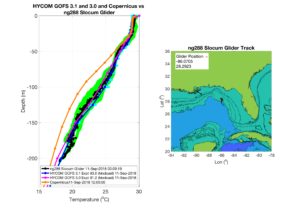
Navy Glider NG288 is on the outer shelf. Not only do GOFS models do well, GOFS 3.1 even matches some of the curves in the profile. Data assimilation might be doing very well here.
Now South Atlantic Bight
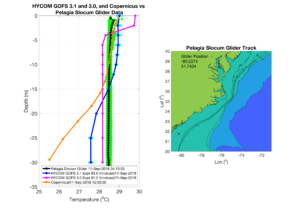
Skidaway Institute of Oceanography glider PELAGIA. We have told this story before. GOFS 3.0 is closest, but it might be for the wrong reasons. GOFS 3.1 is designed to have more vertical resolution in shallow water, and PELAGIA is definitely in shallow water.
Into the Mid Atlantic Bight.
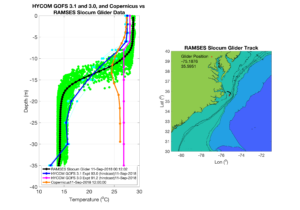
Here is RAMSES, the UNC glider operated by SIO for the NSF PEACH program. An early favorite in the reporting. Here is where GOFS 3.1 shines bright even in shallow water.
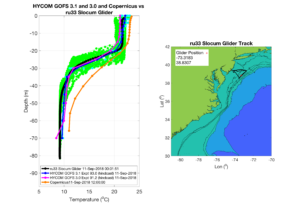
Moving north, we find Rutgers glider RU33 running along the shelf break. We are on the deeper side of the shelf. The Stratification Factor maps showed that both GOFS 3.0 and 3.1 were stratified on the outer shelf, and that is what this comparison demonstrates.
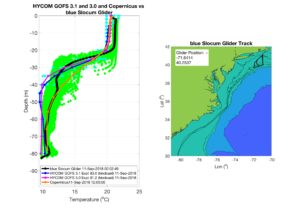
Continuing north to UMass Glider BLUE, we see a complicated structure at mid shelf that no model likes. Copernicus seems to lock onto the profile sooner, near 40 m.
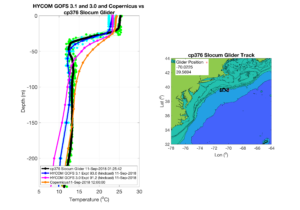
One final step north, we move on to the NSF OOI Coastal Pioneer Glider CP376. Another profile that no model seems to like, even with this glider in deepwater. Surface temperatures are off. GOFS 3.1 is good at getting the near surface variation. Copernicus is good at getting the deep variation.
-
Isothermal shelf waters and Florence
Posted on September 14th, 2018 No commentsFlorence is approaching Wilmington NC as a category 1 storm according to the National Hurricane Center https://www.nhc.noaa.gov/text/refresh/MIATCDAT1+shtml/140842.shtml
It’s slowed down significantly and is still sitting over warm coastal ocean waters. Glider data profiles from RAMSES to the north of Florence and PELAGIA to the south of Florence in previous posts have shown that the continental shelf of the South Atlantic Bight is isothermal, or uniformly warm from top to bottom. Additionally, with the approach angle of Florence winds look to be downwelling favorable meaning that any cold bottom water on the outer shelf was or is likely being advected offshore, while warm surface water is potentially being advected onshore.
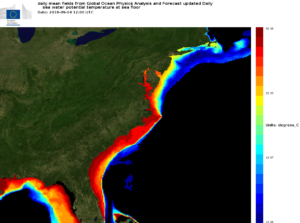
This means that despite vigorous mixing in the coastal ocean there is not likely to be any ocean cooling on the shelf, as there simply isn’t any cold water available to mix to the surface. Bottom temperatures from the European Mercator model show warm bottom temperatures across the entire SAB in contrast to the cold bottom temperatures in the MAB.
Florence has been a slow moving storm over the continental shelf and with little ocean cooling these warm waters will likely not help weaken the storm.
A new batch of glider profiles are coming in this morning to confirm this, but overall this highlights the large differences in regional coastal ocean water masses and highlights processes that we’ll want to investigate in the coming years to better understand how coastal oceans affect storm intensity ahead of landfall.
