


-
Anchors aweigh!
Posted on September 13th, 2018 No comments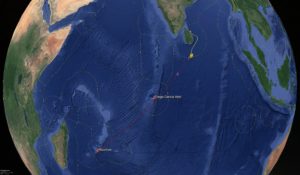
RU 29 has officially left Sri Lanka on August 12, 2018. Operating at a standard safe speed of 20 km per day RU 29 is scheduled to arrive at Mauritius, roughly 4,300 km away, in early March. The glider was granted scientific permission to enter British Indian Ocean Territory and anticipated to come within 50 miles off of the Diego Garcia Atoll. With this mission we will see exactly how well our global forecast models predict the variability in the Indian Ocean and what are the optimal paths for gliders to maximize their forecasting impact among other fascinating scientific discoveries that may occur throughout our journey. Stay tuned.
-
Hurricane Glider Picket Lines
Posted on September 13th, 2018 No commentsHere is the evolving figure for the Hurricane Glider Picket Lines. It was just submitted as a placeholder to the OceanObs19 white paper entitled OceanGliders: a component of GOOS. The final figure is due in October. Other suggestions welcomed.
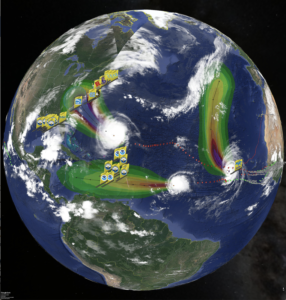
Caption:
Hurricane Florence, Isaac and Helene cloudtops (left to right) on September 11, 2018, with NHC best tracks behind each hurricane, NHC probability of tropical storm force winds ahead of each hurricane, and the tails of the diverse fleet of ocean gliders in the picket lines transmitting upper ocean data in near-real time to forecasters.
-
Gliders NG330 & SG630 in the Caribbean
Posted on September 13th, 2018 No commentsNow standard glider data/operational model comparison plots for the Caribbean hours ahead of Isaac. First is Navy Glider NG300 station keeping west of St. Croix.
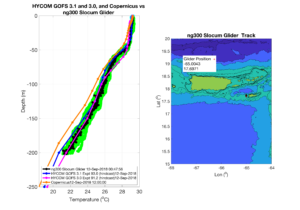
Second is the NOAA AOML Seaglider SG630 running the north-south transect on the southern side of Puerto Rico.

As we discovered over the last few days, all the operational models are doing fairly well in this region. GOFS 3.1 has been a consistent good performer.
The issue we now want to investigate in the Caribbean is salinity. Our focus for this first week of work has been temperature, to see how we are doing with heat content before the storms arrive. Salinity has an important impact during the storm, specifically, the fresh water layers we expect to see near the surface that inhibit mixing.
-
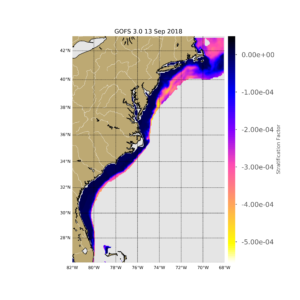
Stratification Factor Maps
Posted on September 13th, 2018 No commentsBelow is today’s Stratification Factor map for GOFS 3.1. Very little stratification in the South Atlantic Bight, much larger stratification in the Middle Atlantic Bight especially from midshelf and beyond. Light colors are strong stratification, dark colors are weak stratification.
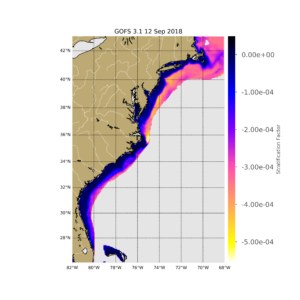
Stratification in GOFS 3.0 is significantly reduced in both the SAB and MAB.
-
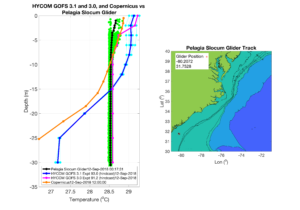
Gliders Pelagia and Ramses
Posted on September 13th, 2018 No commentsHere are glider data-model comparisons for the two gliders being flown by Catherine Edwards at Skidaway.
Pelagia is located near the SC/GA border and is nearly isothermal but with the daily variation in temperature near the surface averaging to a small increase in the daily average temperature. GOFS 3.1 has the least vertical variability.
Ramses deployed north of Cape Hatteras indicates there is strong two-layer system with significant stratification, and GOFS 3.1 is doing the best job of capturing it.
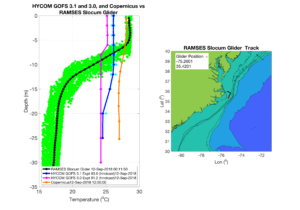
From Maria:
“It is interesting to see that for Ramses the water column is very stratified, with a surface to bottom temperature difference of about 12 degrees celsius, but some of the models show weak stratification (about 1 degree surface to bottom temperature differences). For Pelagia the situation is completely opposite: the temperature is almost vertically uniform but the models present some stratification.”
