


-
Pelagia & GOFS and Copernicus Mercator
Posted on September 11th, 2018 No commentsHere is a first look at what the European global ocean model is saying for Pelagia.
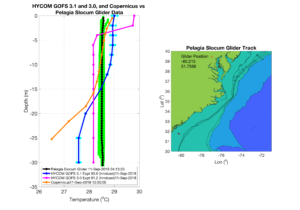
SST for Copernicus and GOFS 3.1 (the data assimilative initial condition for RTOFS) both have about the same surface temp.
That would be expected because they are both assimilating the similar global SST products.
Subsurface varies quite a bit between the models. All colder than the models.
GOFS 3.0 is closest to the glider, but likely for the wrong reason, the lower spatial resolution of GOFS 3.0 in shallow water tends to produce isothermal layers in shallow water that then adjust the surface temperature to match the satellite SST.
GOFS 3.1 and Copernicus clearly have the resolution to produce stratified continental shelves.
RTOFS is coming in closer to the glider. It takes a bit of time for the data flow to go through the system from the glider control center to the glider dac to ndbc to gts, so the PELAGIA profiles are probably just starting to appear in the NCEP tanks.
So these model profiles likely have very little data other than SST contributing to the assimilation.
This is what we hope to modify with the glider data and the GOFS 3.1 assimilation scheme.
As before – sending this out as fast as Maria is producing them so we can get this to Debra and Catherine for their briefs.
Thanks Maria. Thanks all.
Scott
-
PELAGIA data-model comparison
Posted on September 11th, 2018 No commentsSending these along quickly to get them to partners at SECOORA and Skidaway University as fast as possible for the briefs they are giving.
They are of Glider PELAGIA deployed yesterday by Catherine Edwards for SECOORA.
Today’s plot is especially interesting, the mirror image of the issues in the Mid Atlantic.
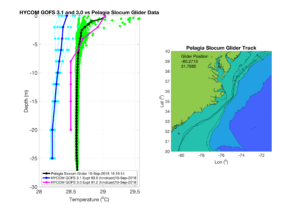
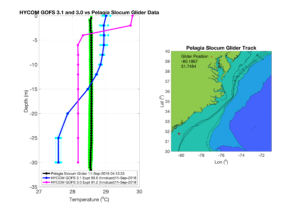
In this case the glider data is nearly isothermal, very warm, like 28.5 C.
But here the operational models have a two-layer structure with warmer surface temperatures and colder bottom temperatures.
There still is a lot to discover on how the operational ocean models respond compared to the real ocean observed by the glider.
And we need to remember that this is a global model, designed more for deepwater –
But it is a seamless ocean boundary condition for HWRF that runs from deepwater across the shelf – just like a hurricane.
We have the published evidence that the MAB shelf can impact the hurricane intensity, and now we will see in real time how the SAB shelf responds and possibly see if it has an impact on intensity.
We are making great progress and continuing to learn how to improve our forecast models.
Good luck to our friends in the South Atlantic Bight.
Scott
