


-
SAB & MAB Stratification in GOFS 3.1
Posted on September 12th, 2018 No commentsWe use the Non-dimensional Potential Energy Anomaly, what we call the Stratification Factor, to represent the stratification structure on the continental shelf with one number so we can plot it as a map.
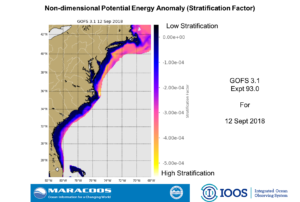
This first plot says that according to GOFS 3.1, the MAB shelf is highly stratified and the SAB shelf is much less stratified.
You can even see the very high stratification in the PEACH area just north of Cape Hatteras.
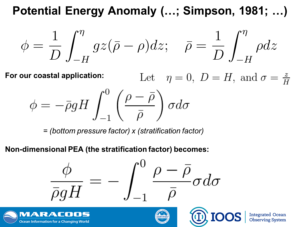
The first slide is the derivation of the Stratification Factor, and the second slide shows the current conditions in 3.1
Thanks.
Scott
-
OOI Gliders in the Glider DAC
Posted on September 12th, 2018 No commentsHere are 3 maps people may find useful for their daily briefs.
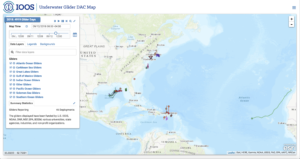
First image is the IOOS Glider DAC showing the entire North Atlantic fleet.
The change from yesterday is the NSF OOI gliders are back in. Yesterday afternoon Mike Crowley worked on resolving the metadata issues and John Kerfoot was able to get the OOI Pioneer Array gliders back into the DAC. So now this NSF OOI data is also going to the DAC and onto the GTS and into the models.
This image is an unprecendented combination of NOAA, Navy, NSF and Industry (TWR’s glider SILBO in Helene) supported gliders all collaborating through the IOOS Glider DAC to support our Weather-Ready Nation’s efforts to be better prepared for hurricanes.
Its inspiring, but with my own memories of Sandy, still difficult knowing what is in store for the southeast.
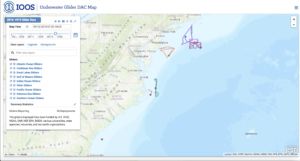
Second image zooms into the East Coast picket line, where you can now see the individual OOI gliders that were added to the mix last night.
The line up from south to north is
Catherine Edwards PELIGIA deployed for SECOORA.
Catherine Edwards deployed UNC RAMSES for NSF PEACH.
NOAA Spray
Travis Miles RU33
Wendell Brown UMass BLUE.
NSF OOI.
I know this is a glider distribution list, but there is a similar level of involvement in the IOOS HF Radar community.
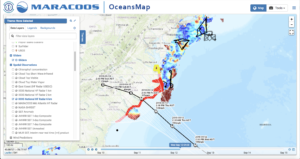
Third image is from the MARACOOS OceansMap were we have taken the IOOS Glider DAC gliders, added the NHC Florence forecast cone, and also turned on the IOOS National HF Radar network 6 km grid (as you see in the menu on the left).
In the MAB, it was the combination of the gliders, the HFR, the satellites, and the 30-year time series of NDBC buoy data that made possible the scientific analysis and essential ocean process discovery that led to the science papers that provided the scientific basis for the change in approach that we see active today.
Thanks to the long list of people that worked with increasing intensity for months so that this array can be in place.
We will be looking at more gliders in the model data comparisons today. If anyone needs something special, let me know, and we will jump it in the queue.
Thanks all. Stay safe.
Scott
