-
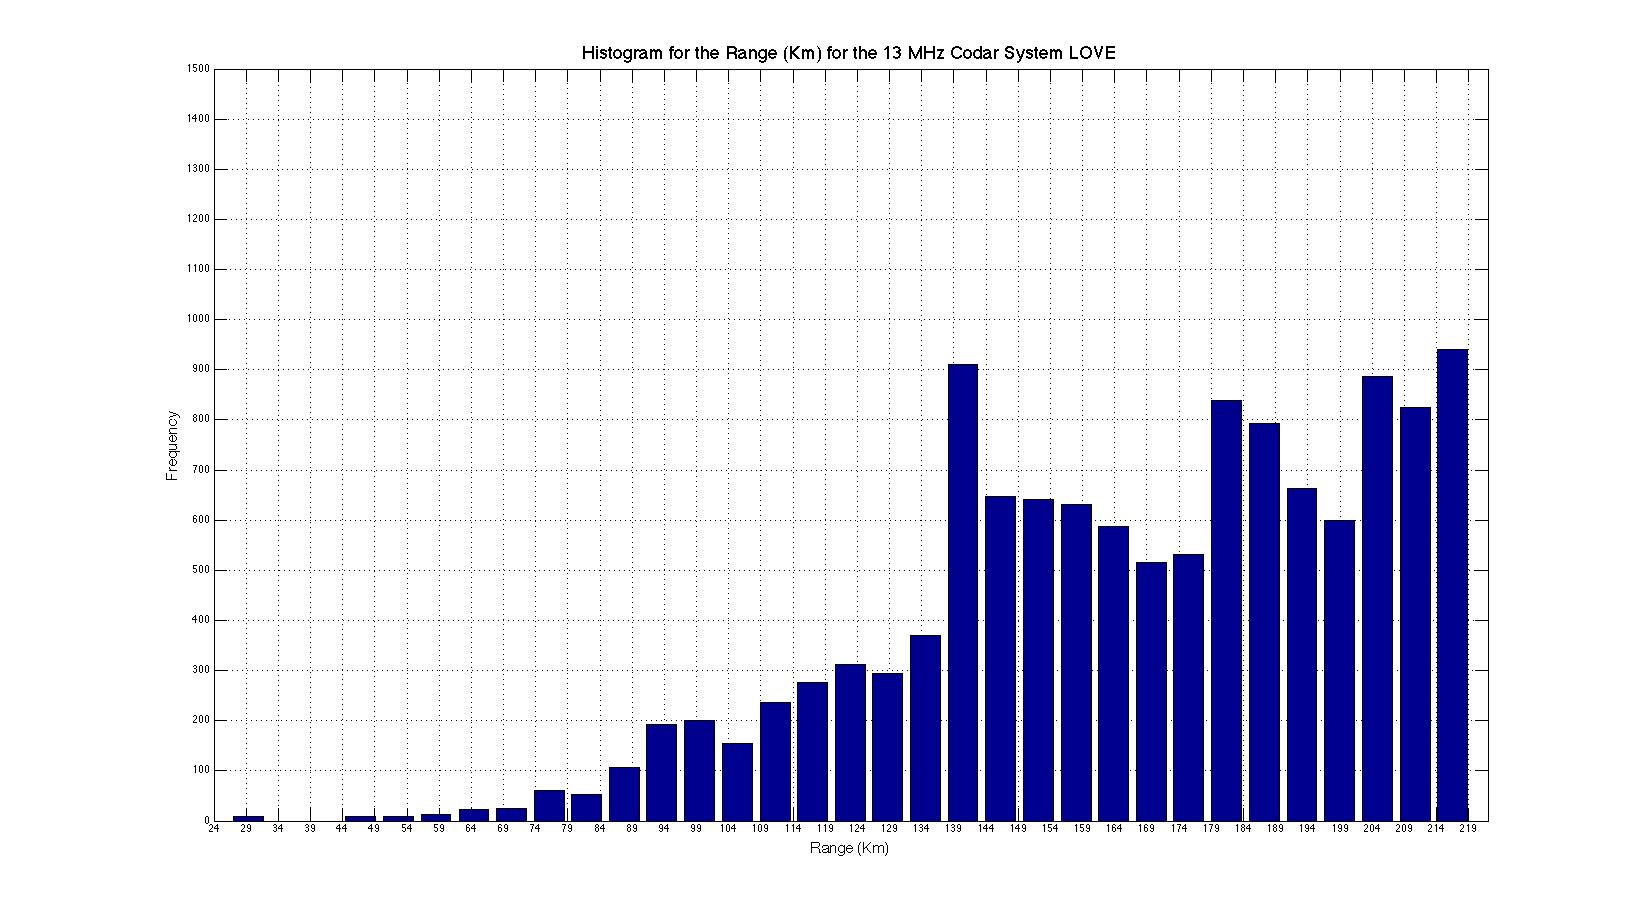
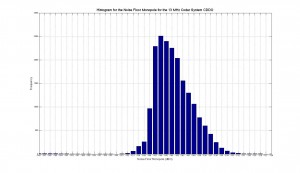
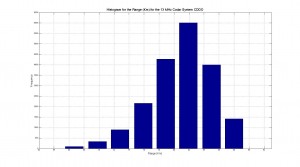
Histogram of Range (Km) for the 13 MHz Codar System CDDO and the 5 MHz Codar System LOVE
Posted on June 26th, 2009 No commentsThe histograms plotted were done using the radial diagnostic files from the CDDO 13 MHz site and from the LOVE 5 MHz site. The difference in range is clearly visible and the data is coherent with the theory. The theory states that the lower the frequency the higher the range but at the same time the less resolution of the data. We can appreciate that the 13 MHz codar system CDDO clearly has a lower range than the 5 MHz LOVE site, being this coherent with the theory.

-
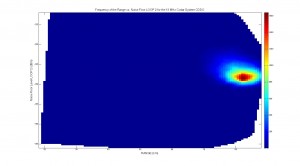
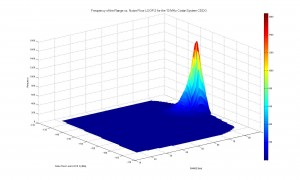
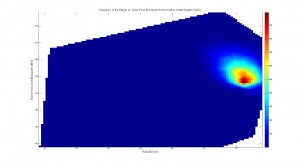
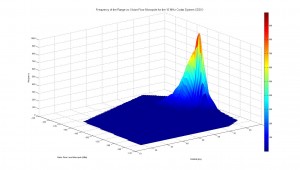
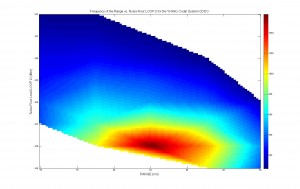
Filtered out Range and Noise Floor relationship data for the 13 MHz Codar System CDDO
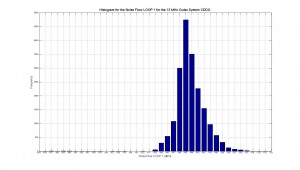
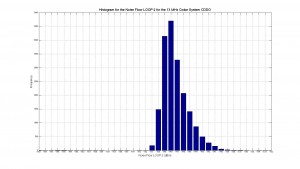
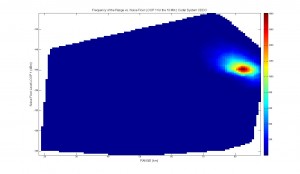
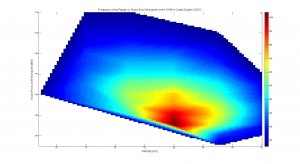
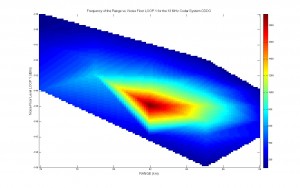
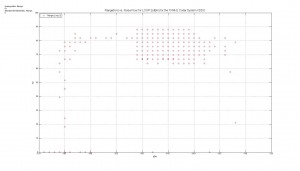
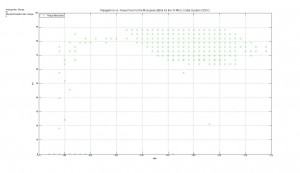
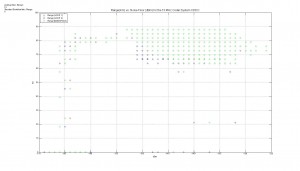
Posted on June 26th, 2009 No commentsThe following plots represent the frequency with which a specific pair of Noise floor and Range repeat throughout the data. These plots were made using the radial diagnostic data from the CDDO site for the time period of 02/08/2009 to 06/07/2009. These plots were made to explain the phenomenon saw in the previous blog title “Range and Noise Floor relationship plots for the 13 MHz Codar System CDDO”. In this previous blog it was seen that the frequency of having a high range with a low noise level was the same with a high noise level. This phenomenon contradicted the theory and it was stated that it was due to a graphical limitation of presenting values of frequency less than 100 implying that the pairs with a frequency of less than 100 had the same color as the ones that really did.
To prove the hypothesis an extra set of plots were made. In the first set of plots all the pairs that had frequency of less or equal to 50 were eliminated. Te second set of plots all the pairs that had frequency of less or equal to 100 were eliminated. As it can be seen, in the new plots the data matches with the theory. In the plots it can be clearly seen that the frequency of having a high range with a high noise level is none. As the noise levels start to drop it can be appreciated the linear relationship where the range increases proportionally as the noise level decreases.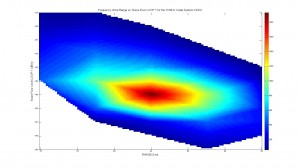
-
Range and Noise Floor relationship plots for the 13 MHz Codar System CDDO
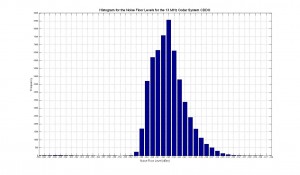
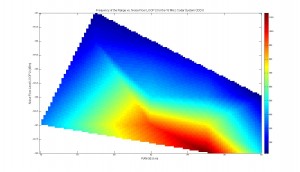
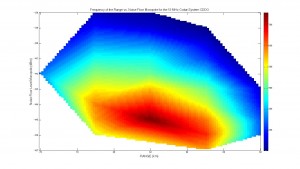
Posted on June 24th, 2009 No commentsThe plots below were made using the radial diagnostic data from the CDDO site for the time period of 02/08/2009 to 06/07/2009. The plots below represent two main things. The first 4 plots are histograms for the Noise Floor and the next 6 are plots of the frequency of noise floor and range as pairs.
The first 3 histogram represent the frequency with which the noise floor repeats for: LOOP 1, LOOP 2 and Monopole. The last histogram is the frequency of all of the noise floor register for this time period. As we can see the Noise Floor levels for the CDDO site are between -150 and -140 dBm, being the values in the middle the dominant ones. Having these values as average and constant is a good thing since this range of value is good and provides a bigger SNR which is what we always want. Also this allows us to have always an idea of what is the range to expect.
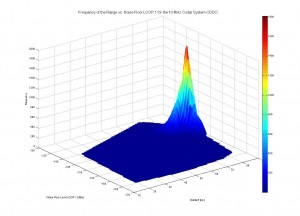
The next 6 graphs represent the frequency with which a specific pair of noise floor and range repeats. The plots were made for each component separately always using the same range data. The color bar represents the frequency of the pairs. As we can see the 2D graphs are a top view of the 3D plots. What we are looking in these plots is to see what relationship there is between the noise floor and the range. As we can see in the plots the frequency of having high or very low Noise Floor levels is low as we saw in the histograms, but something interesting to see is that the frequency of getting high values of range is about the same for very low or very high levels of noise. This behavior is contradictory from the theory which states that for low noise the range should be higher. One way to explain this is that the colors represent only a certain minimum number for the frequency. For this reason they appear to be the same but maybe in reality we have more number of higher range values with low noise than the opposite.
As it was expected the most common and repeated pair of noise and range with a frequency around 1000 times is around the range the -145 dBm for the noise with a range of 83 Km. This behavior could be expected from what we had saw in the plots made before of Range vs. Noise floor. Also having such a high frequency for these pair of values allows us to have a good idea of what to expect for the data. -
Range (km) versus Noise Floor (dBm) levels for the 13 MHz Codar System CDDO
Posted on June 19th, 2009 No commentsAs it can be seen on the plots the average of the range we obtained for the average Noise Floor we have (-145 dBm) is 81 Km. The plots obtain for the CDDO site demonstrate that during its time functioning the range has maintain considerably stable around 80 km with a noise floor level around -144 dBm which is relatively good. In a plot where the Noise Floor levels have a lot of fluctuation the expected behavior of the plot is to see low range at high noise levels (less negatives values) and higher ranges in the lower noise levels. Because the Noise Floor level stays relatively stable at -145 dBm we obtain about the same range most of the time. It’s important to clarify that the “range” that is being analyzed is the distance from the radar which the data will have a good level of confidence. The distance that the signal travels is going to be always the same but the distance at which the data becomes realistic depends on the external and internal components interfering with it.
One important component that interferes with the signal is noise. Noise can be either internal or external and can limit the range of systems for a given transmitted power. Some of the external noises that can affect the signal are produce by: wind, the atmosphere, the galaxy, interference with communication sources, thunderstorms, sun, man-made noises such as electrics motors, automobiles, neon signs, power lines, etc.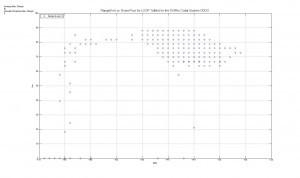
-
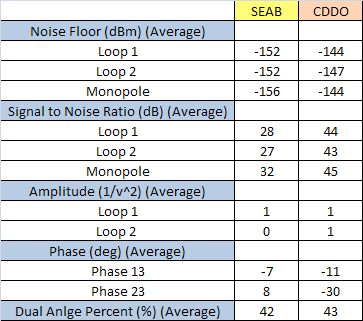
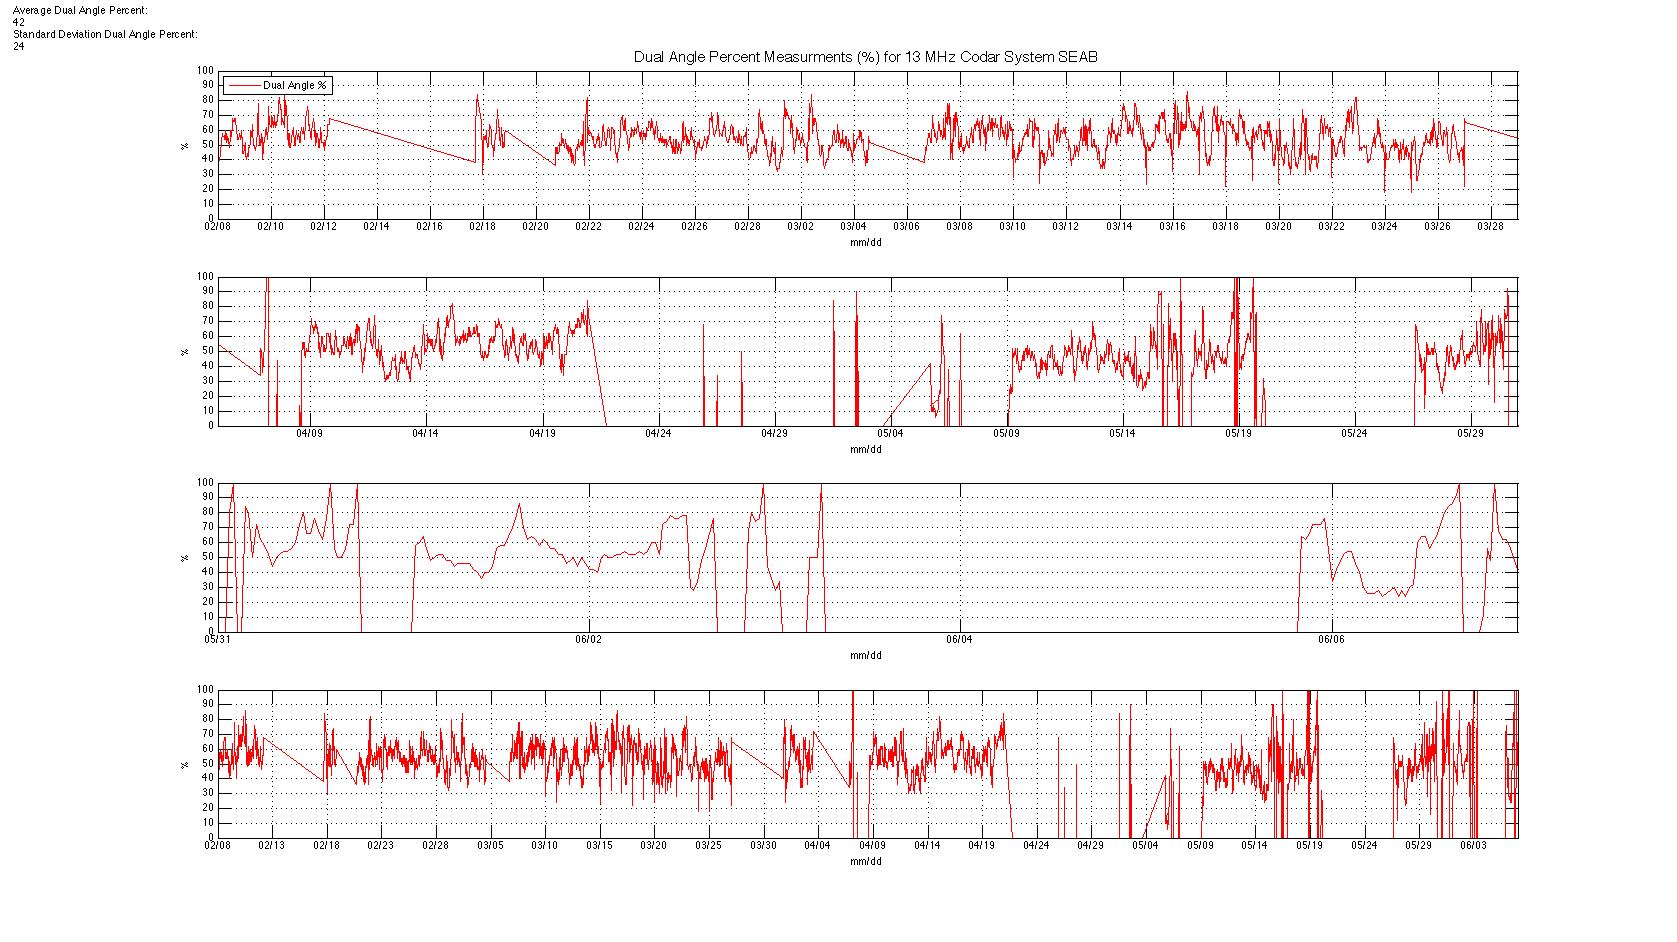
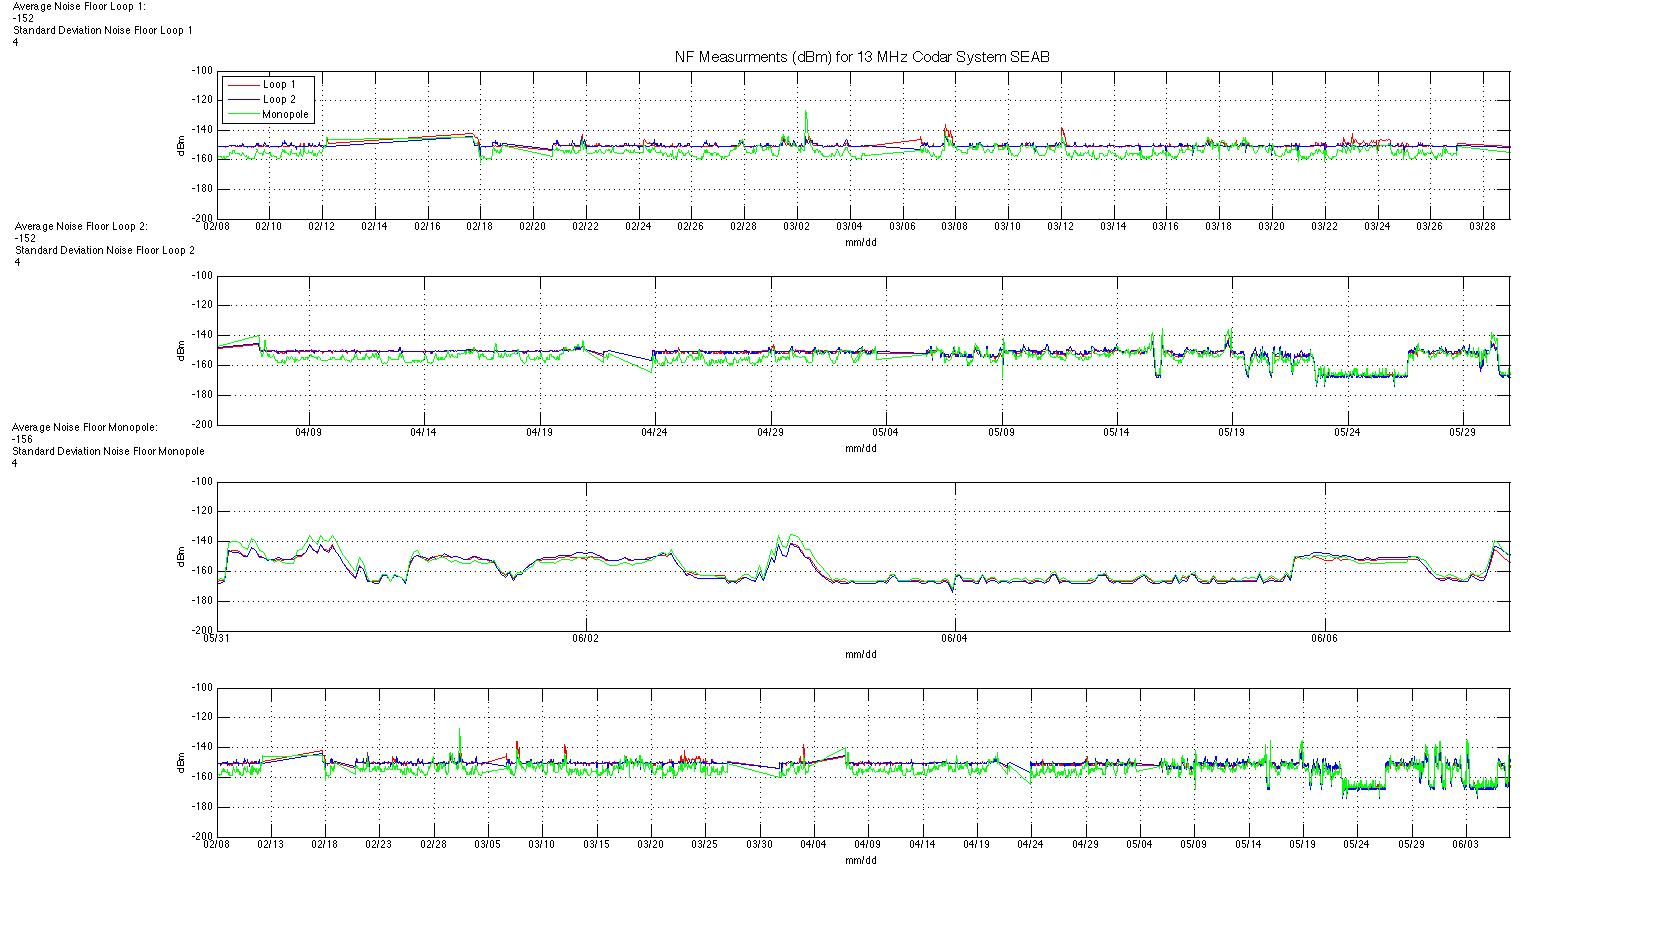
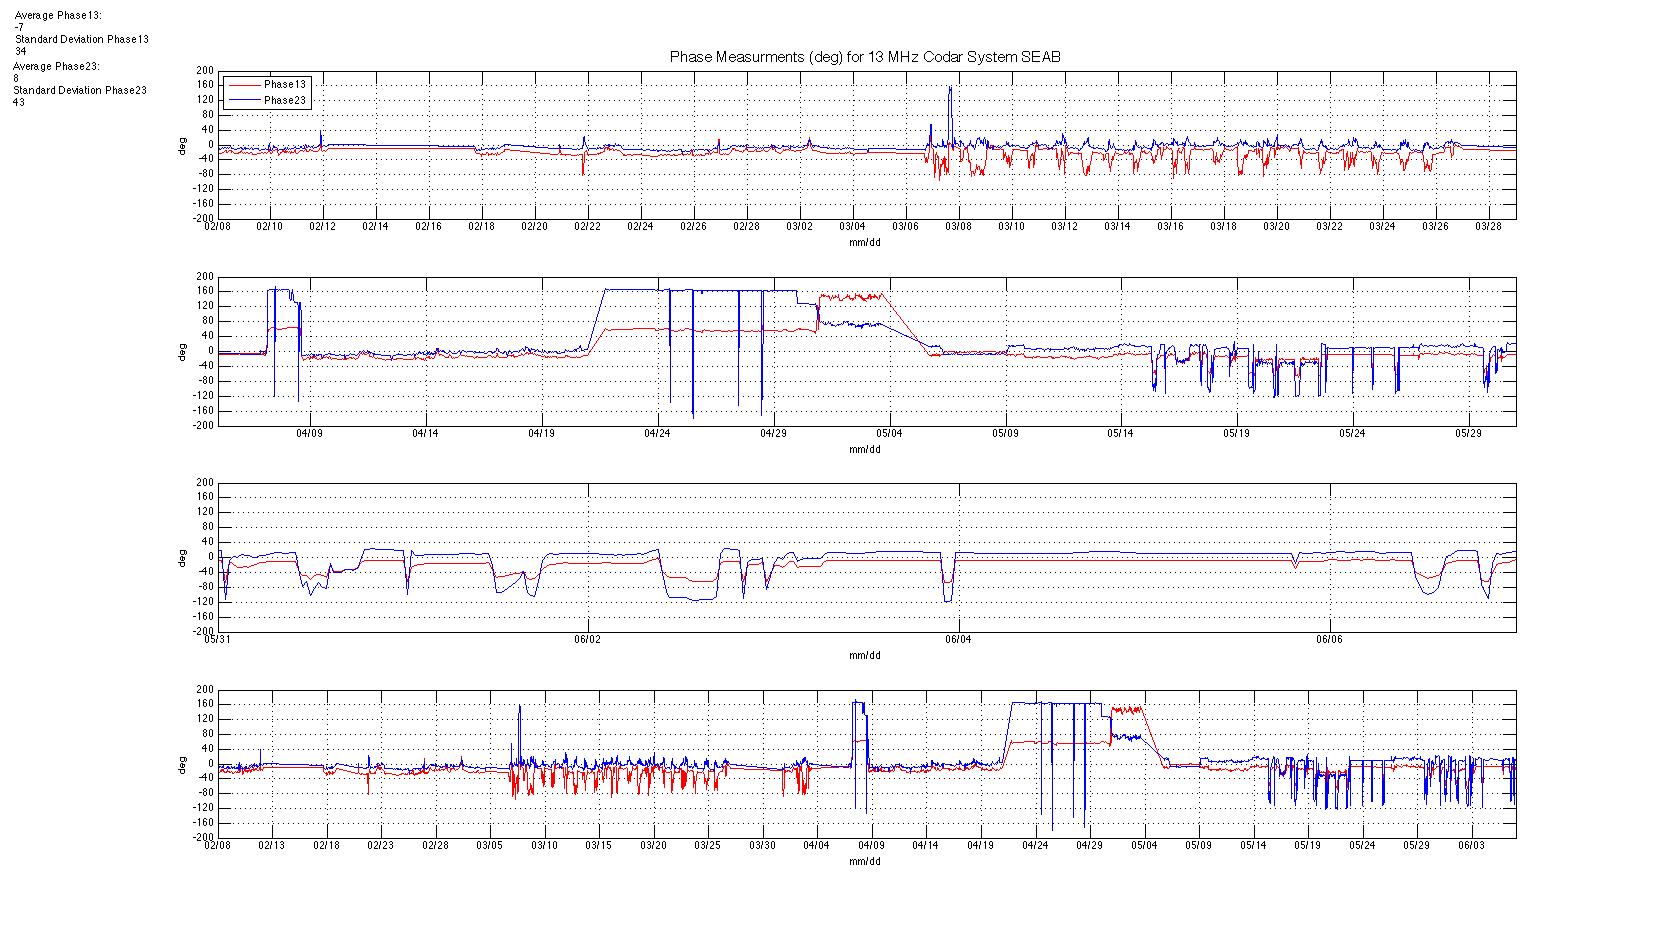
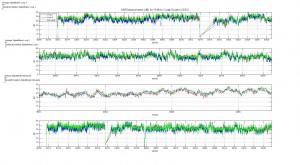
Generic Diagnostic Plots for 13MHz SEAB SeaSonde Site for the time period of Feb./08/09 – June/07/09
Posted on June 16th, 2009 No commentsAll of the plots shown below are from the diagnostic files obtain from the SEAB site for the time period of 02/08/2009 to 06/07/2009. For this specific time span the site seems to be experiencing some problems either with the power supply or the data processing done by the hardware due to all of the gaps in the plots. This gaps represent missing data for that specific time.
Since the SEAB site was working before the time span plotted we can compare briefly the values obtain for both sites, since they resemble in a lot of ways.If we compare the values from this site with the values obtain for the CDDO site we can see some differences and similarities.
-
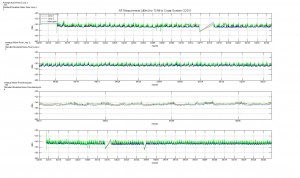
Comparing Median and IIR method
Posted on June 16th, 2009 No commentsThe following is a comparison between the Median method and the IIR method. The first figure indicates the detection rate for different FFT and threshold.

This figure indicates the Number of possible targets for the IIR method using a fix FFT 256 and changing the threshold. Notice that as time increases the number of possible targets is reduced . These figures are from February 26 2009 using the 13 mHz system

This figure indicates the Median method is more variable to detect the number of possible targets, however the values are small compare to IIR method

The follwing set of figures are a comparison between both methods using only the minimum values of FFT and Threshold

This figure is to represent the maximum values of each of the sites

-
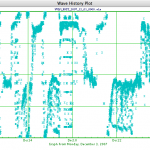
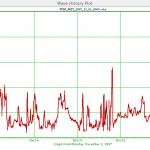
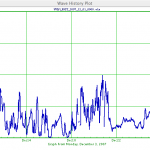
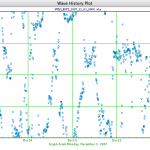
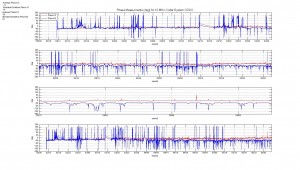
Data Plot: Wave Period, Wave Height, Wave Direction and Wind direction
Posted on June 12th, 2009 No commentsThese plots are for Breezy Point December 1, 2007. The plots are from the Codar data. I will be posting the AWAC and RDI 1200 and 600 plots next time so that we can compare the two.
The plot for Wave Direction seems odd because there isn’t an average for each unit of time, rather only for 2 days or so (Dec 17 and Dec 24).
-
-
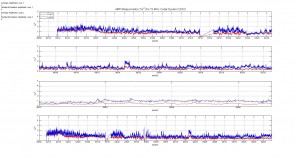
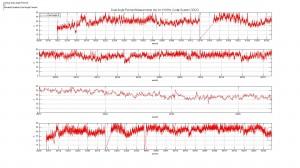
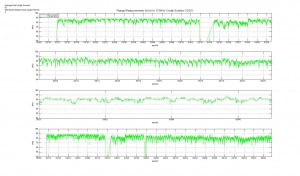
Generic Diagnostic Plots for 13MHz CDDO SeaSonde Site for the time period of Feb./08/09 – June/07/09
Posted on June 12th, 2009 No commentsAll of the plots below are from the diagnostic files obtain from CDDO for the time period of 02/08/2009 to 06/07/2009. All plots have 4 subplots that represent different time spans. In all of them there seems to a problem with the CDDO radar from March 14-17 and April 3. The gap in all plots from March 14-17 was due to a power supply problem. The CDDO radar did not had any electrical power supplied to it because the transformer that supplied energy to the system caught fire. Except for this time periods the CDDO radar seems to be working well with expected values in all of the plots. To obtain more information about any individual plot click on it.
-
Seagrant ADCP Wave Project
Posted on June 10th, 2009 No commentsI have uploaded the archived spectra data from BRZY, HOOK, and HOSR to repro-2. It is located in a folder on the desktop called “SeagrantWaves.” I have also uploaded the spectra data from HOMR, but it is located on coolmedia in a desktop folder called “SeagrantWaves.”
Some of the spectra data was missing in small gaps. Data from HOSR was missing from 2/20/07 to 2/25/07 and also from 12/18/07 to 12/30/07. Data from BRZY was missing from 4/18/07 to 4/24/07. Data from HOOK was missing from 4/10/07 to 4/24/07 and from 12/18/07 to 2/10/08. Data from HOMR was missing from 12/20/05 to 12/30/05 and from 12/18/07 to 2/10/08.
-
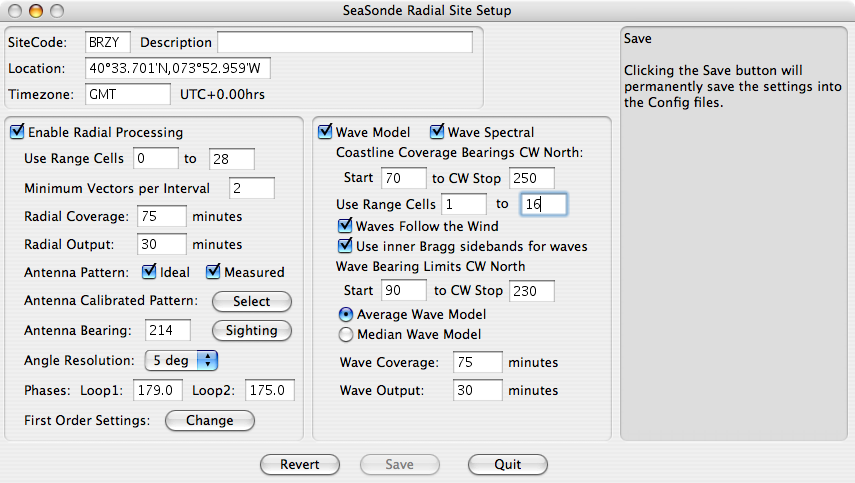
Reprocessing Wave Data at Breezy Point
Posted on June 9th, 2009 No commentsJune 9, 2009
We took the data from CODAR at Breezy Point, New York during the period February 7 2007 to December 30 2007 and reprocessed it using the settings as shown in the figure. The program used was Release 5 Update 4. The CODAR data will be compared to the RDI ADCP.