-
Generic Diagnostic Plots for 13MHz SEAB SeaSonde Site for the time period of Feb./08/09 – June/07/09
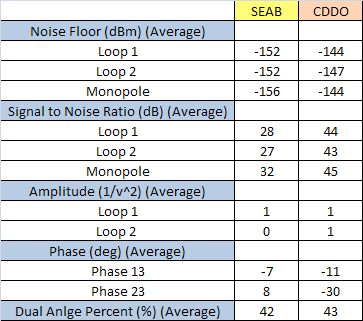
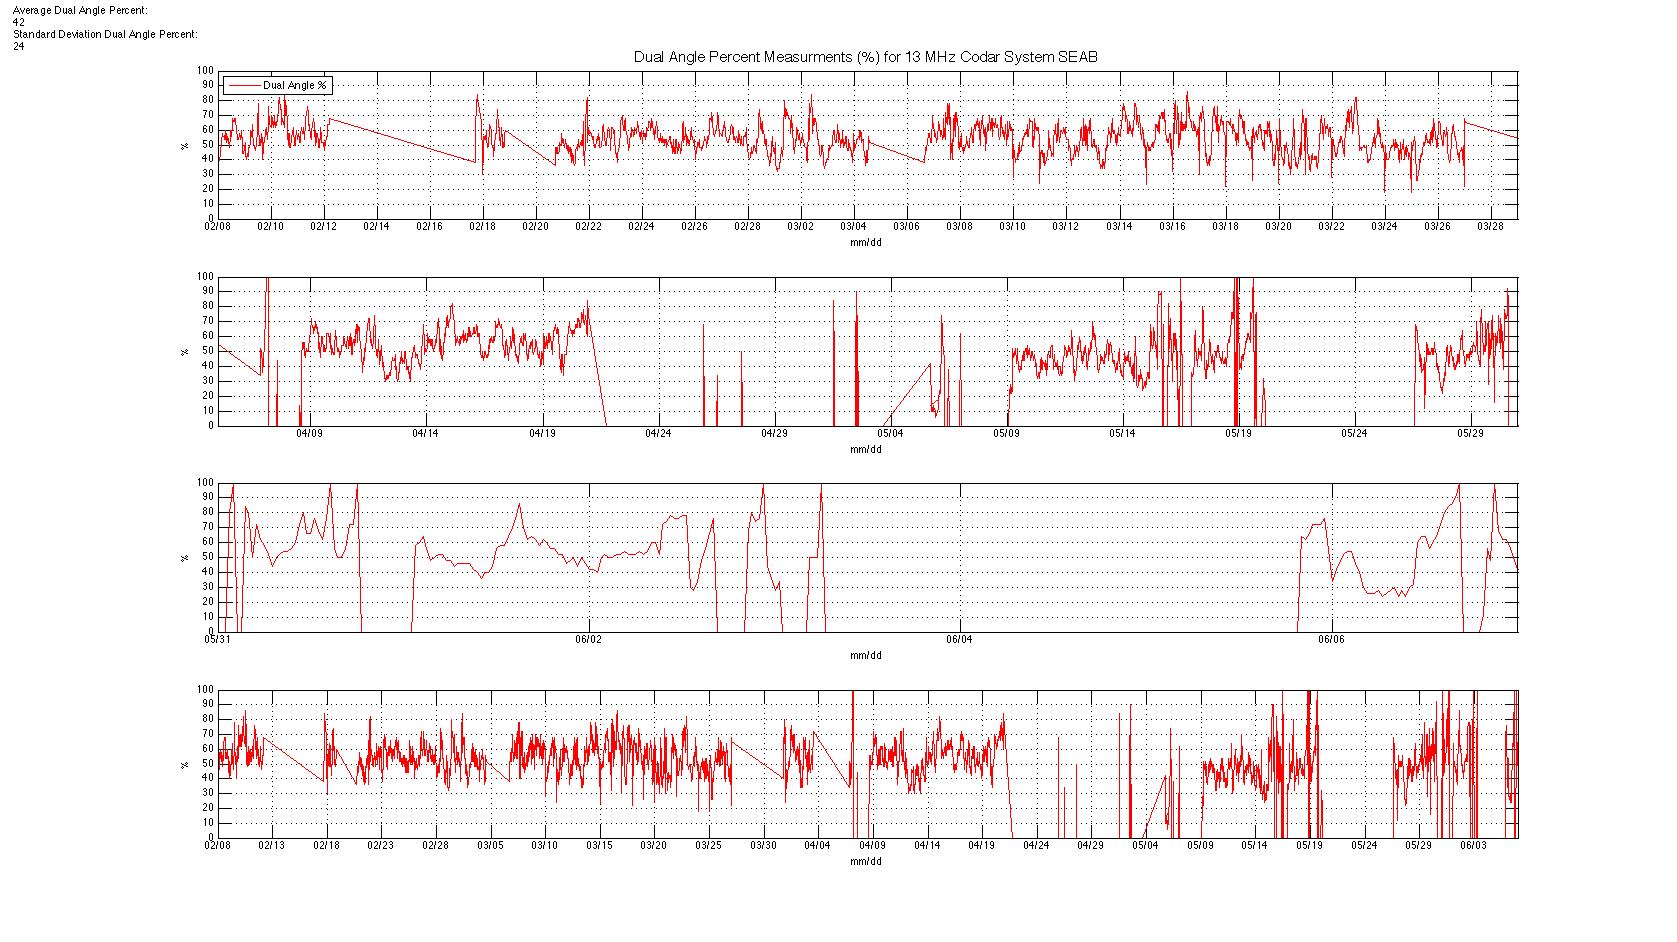
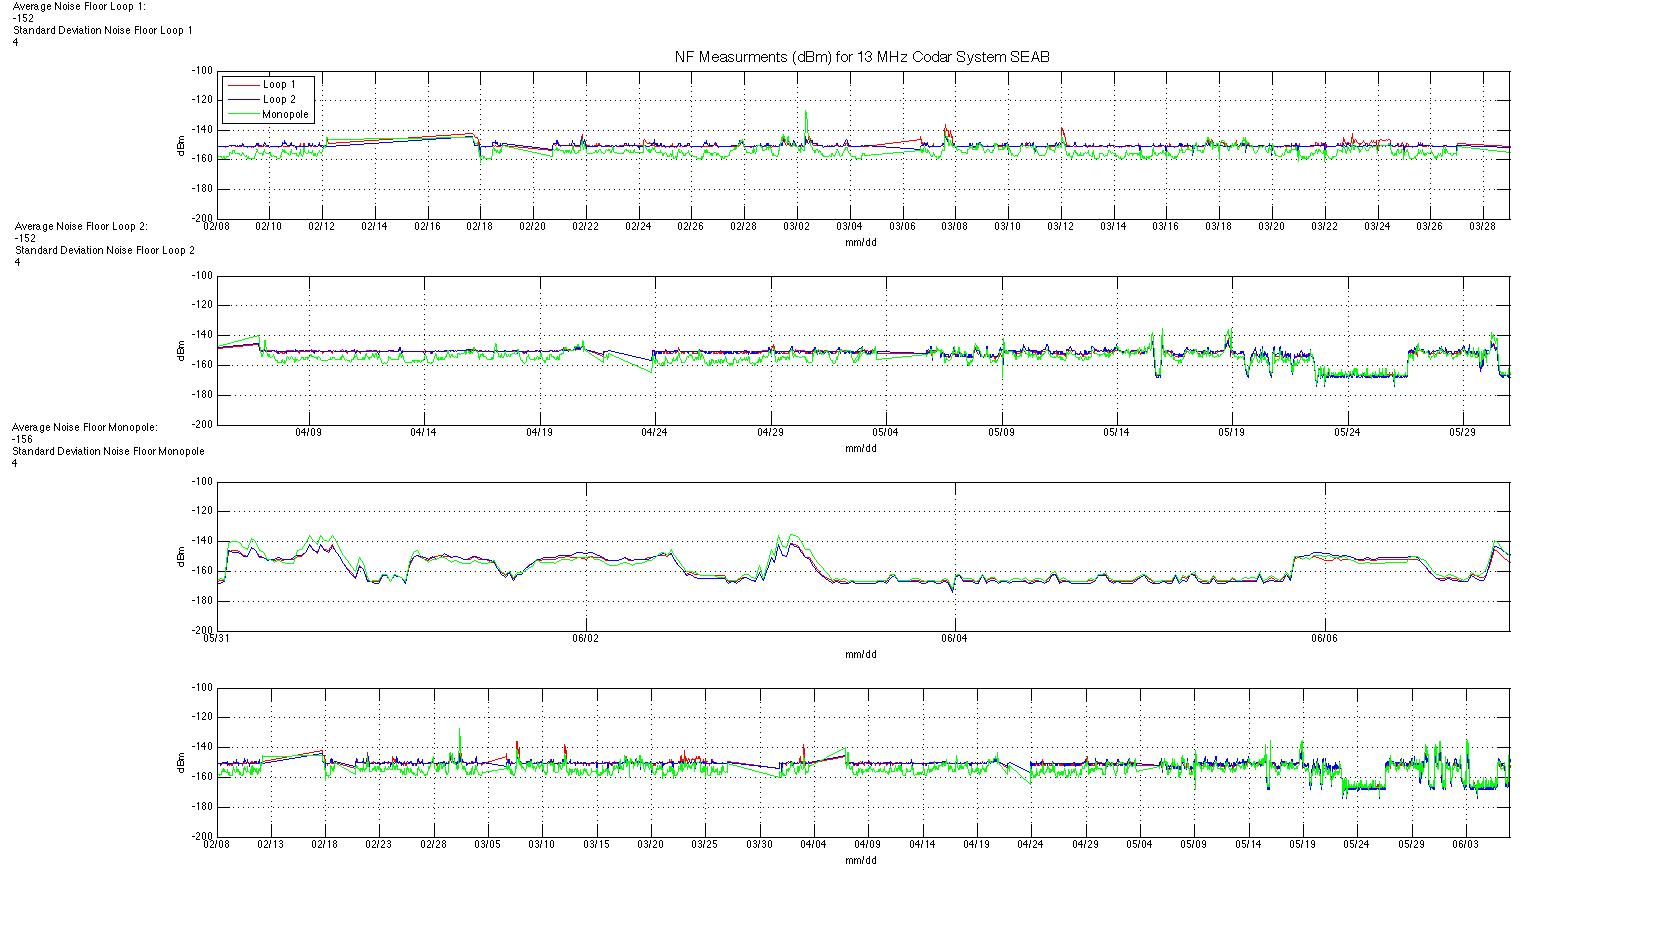
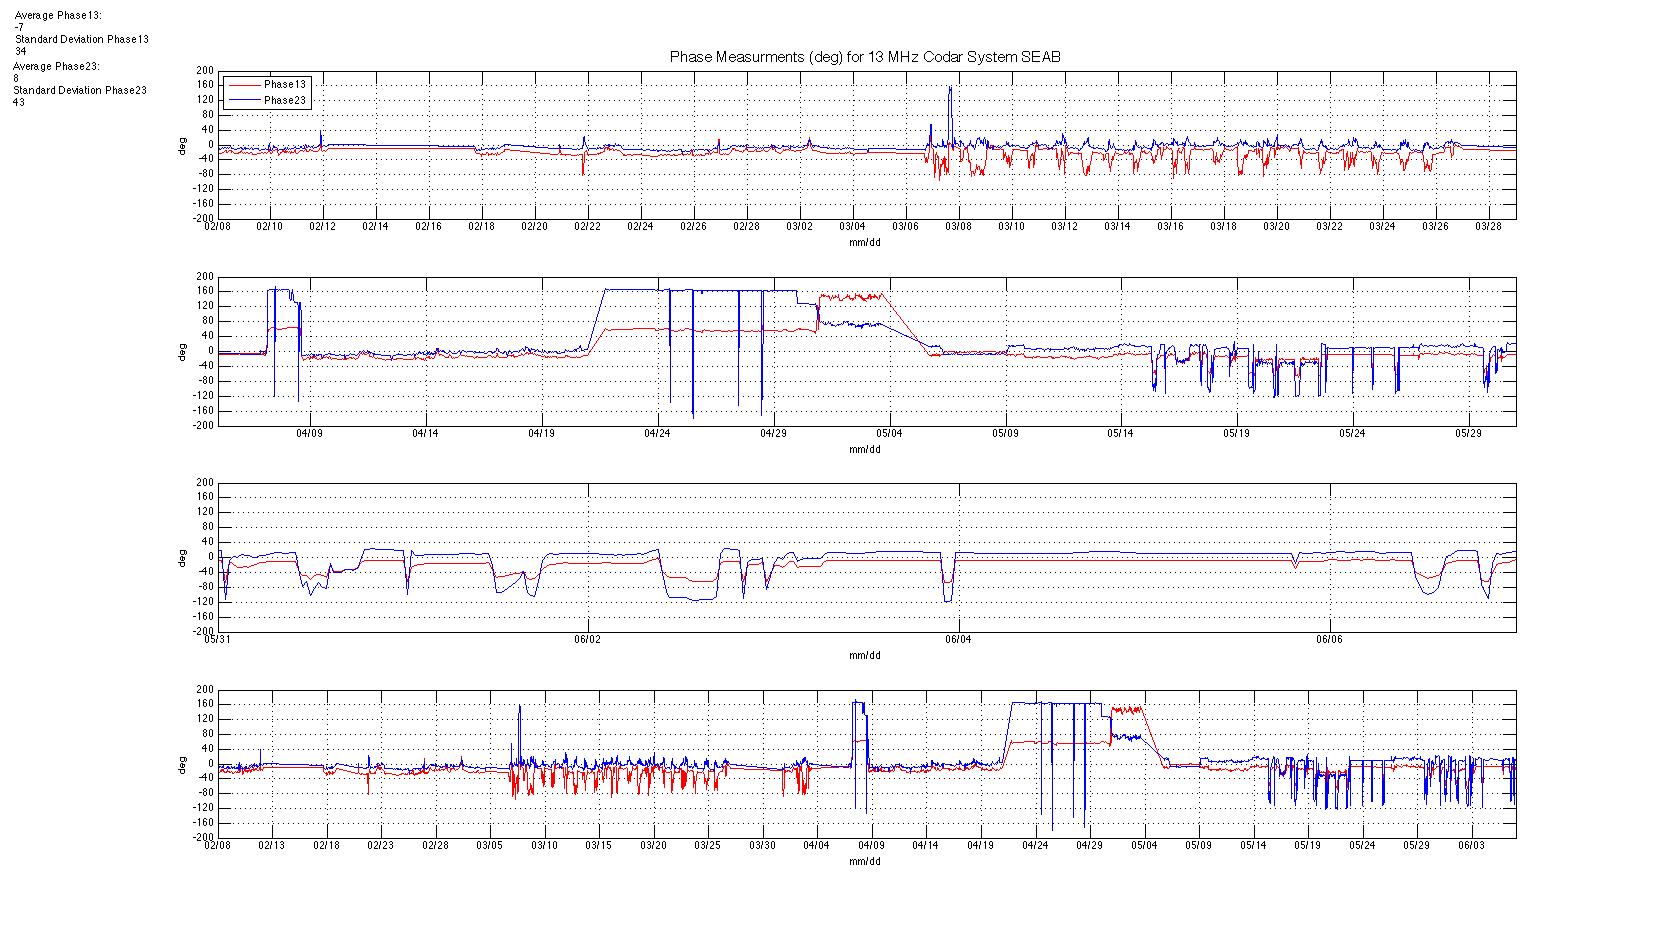
Posted on June 16th, 2009 No commentsAll of the plots shown below are from the diagnostic files obtain from the SEAB site for the time period of 02/08/2009 to 06/07/2009. For this specific time span the site seems to be experiencing some problems either with the power supply or the data processing done by the hardware due to all of the gaps in the plots. This gaps represent missing data for that specific time.
Since the SEAB site was working before the time span plotted we can compare briefly the values obtain for both sites, since they resemble in a lot of ways.If we compare the values from this site with the values obtain for the CDDO site we can see some differences and similarities.
-
Comparing Median and IIR method
Posted on June 16th, 2009 No commentsThe following is a comparison between the Median method and the IIR method. The first figure indicates the detection rate for different FFT and threshold.

This figure indicates the Number of possible targets for the IIR method using a fix FFT 256 and changing the threshold. Notice that as time increases the number of possible targets is reduced . These figures are from February 26 2009 using the 13 mHz system

This figure indicates the Median method is more variable to detect the number of possible targets, however the values are small compare to IIR method

The follwing set of figures are a comparison between both methods using only the minimum values of FFT and Threshold

This figure is to represent the maximum values of each of the sites