-
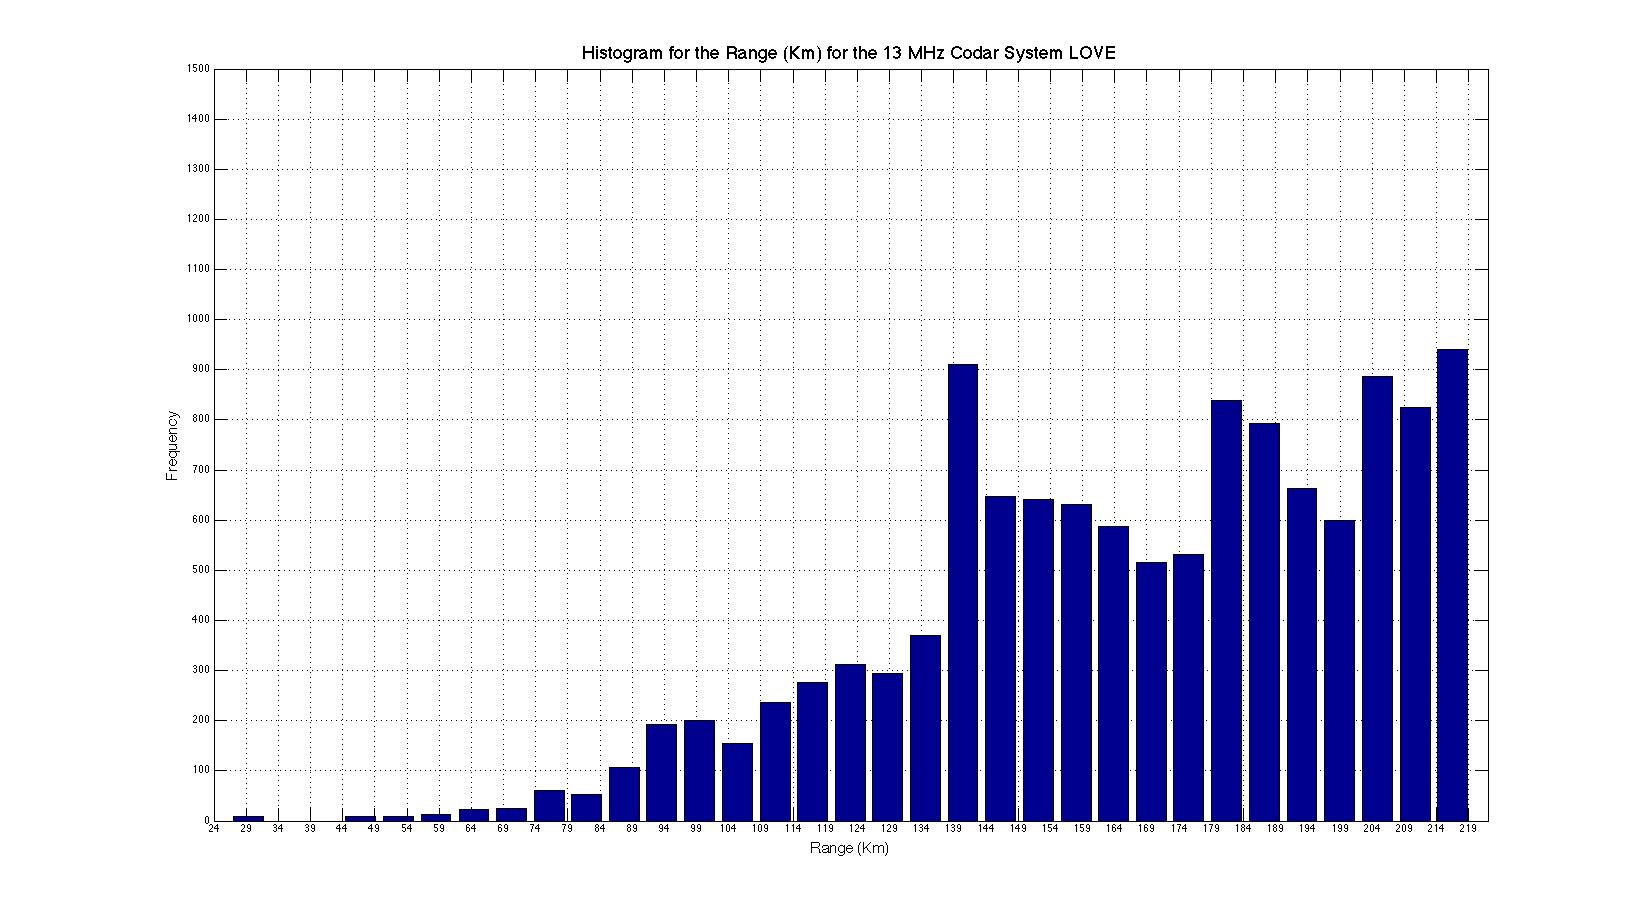
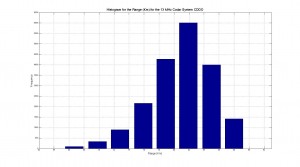
Histogram of Range (Km) for the 13 MHz Codar System CDDO and the 5 MHz Codar System LOVE
Posted on June 26th, 2009 No commentsThe histograms plotted were done using the radial diagnostic files from the CDDO 13 MHz site and from the LOVE 5 MHz site. The difference in range is clearly visible and the data is coherent with the theory. The theory states that the lower the frequency the higher the range but at the same time the less resolution of the data. We can appreciate that the 13 MHz codar system CDDO clearly has a lower range than the 5 MHz LOVE site, being this coherent with the theory.

-
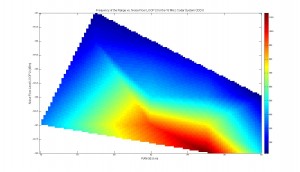
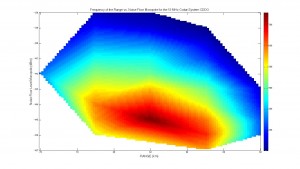
Filtered out Range and Noise Floor relationship data for the 13 MHz Codar System CDDO
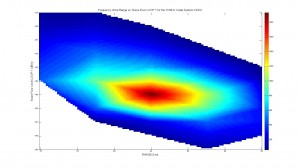
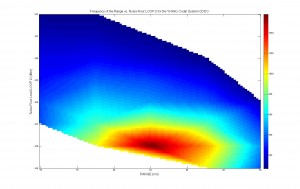
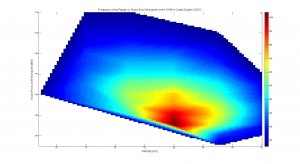
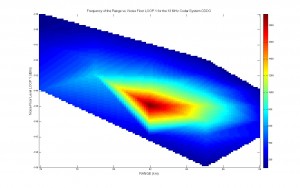
Posted on June 26th, 2009 No commentsThe following plots represent the frequency with which a specific pair of Noise floor and Range repeat throughout the data. These plots were made using the radial diagnostic data from the CDDO site for the time period of 02/08/2009 to 06/07/2009. These plots were made to explain the phenomenon saw in the previous blog title “Range and Noise Floor relationship plots for the 13 MHz Codar System CDDO”. In this previous blog it was seen that the frequency of having a high range with a low noise level was the same with a high noise level. This phenomenon contradicted the theory and it was stated that it was due to a graphical limitation of presenting values of frequency less than 100 implying that the pairs with a frequency of less than 100 had the same color as the ones that really did.
To prove the hypothesis an extra set of plots were made. In the first set of plots all the pairs that had frequency of less or equal to 50 were eliminated. Te second set of plots all the pairs that had frequency of less or equal to 100 were eliminated. As it can be seen, in the new plots the data matches with the theory. In the plots it can be clearly seen that the frequency of having a high range with a high noise level is none. As the noise levels start to drop it can be appreciated the linear relationship where the range increases proportionally as the noise level decreases.