-
Range and Noise Floor relationship plots for the 13 MHz Codar System CDDO
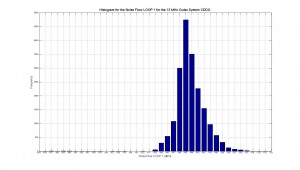
Posted on June 24th, 2009 No commentsThe plots below were made using the radial diagnostic data from the CDDO site for the time period of 02/08/2009 to 06/07/2009. The plots below represent two main things. The first 4 plots are histograms for the Noise Floor and the next 6 are plots of the frequency of noise floor and range as pairs.
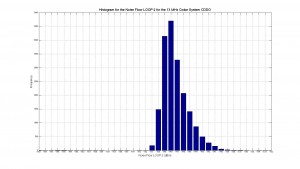
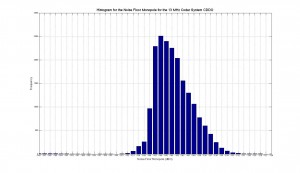
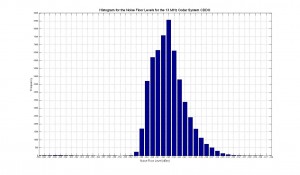
The first 3 histogram represent the frequency with which the noise floor repeats for: LOOP 1, LOOP 2 and Monopole. The last histogram is the frequency of all of the noise floor register for this time period. As we can see the Noise Floor levels for the CDDO site are between -150 and -140 dBm, being the values in the middle the dominant ones. Having these values as average and constant is a good thing since this range of value is good and provides a bigger SNR which is what we always want. Also this allows us to have always an idea of what is the range to expect.
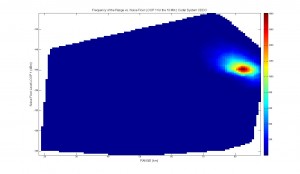
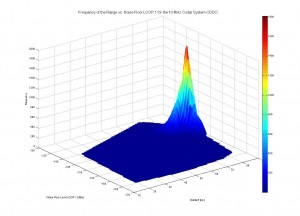
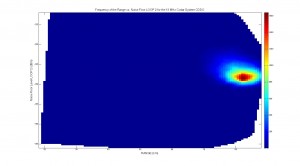
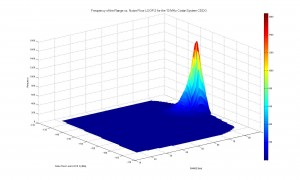
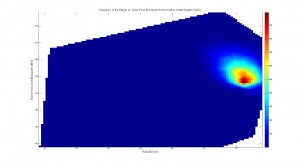
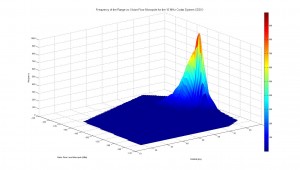
The next 6 graphs represent the frequency with which a specific pair of noise floor and range repeats. The plots were made for each component separately always using the same range data. The color bar represents the frequency of the pairs. As we can see the 2D graphs are a top view of the 3D plots. What we are looking in these plots is to see what relationship there is between the noise floor and the range. As we can see in the plots the frequency of having high or very low Noise Floor levels is low as we saw in the histograms, but something interesting to see is that the frequency of getting high values of range is about the same for very low or very high levels of noise. This behavior is contradictory from the theory which states that for low noise the range should be higher. One way to explain this is that the colors represent only a certain minimum number for the frequency. For this reason they appear to be the same but maybe in reality we have more number of higher range values with low noise than the opposite.
As it was expected the most common and repeated pair of noise and range with a frequency around 1000 times is around the range the -145 dBm for the noise with a range of 83 Km. This behavior could be expected from what we had saw in the plots made before of Range vs. Noise floor. Also having such a high frequency for these pair of values allows us to have a good idea of what to expect for the data.Last 5 posts by admin
- Quality Control of Bistatic Signals - June 7th, 2012
- Radial Coverage for March 2012 - April 23rd, 2012
- ru23 as a drifter, Travis Analysis - February 14th, 2012
- Fisher Island - Ideal Pattern Results - February 2nd, 2012
- Yorktown Express - January 31st, 2012