-
New 2020 Ocean Forecast Workflow for Hurricanes
Posted on May 15th, 2020 No comments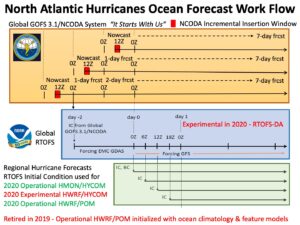
There are 3 steps in the workflow for the ocean component of NOAA’s operational hurricane forecast models HMON and HWRF.
Step 1 is data assimilation. This is accomplished by the Navy using the Global Ocean Forecast System (GOFS) version 3.1. The data is assimilated using the Navy Couple Ocean Data Assimilation (NCODA) system. Data from each day is typically inserted over a 3 hour insertion window running from 9Z to 12Z each day. Major datasets for assimilation include satellite Sea Surface Temperature (SST), satellite sea surface height from altimeters, data from profiling instruments like Argo and underwater gliders, etc.
Step 2 is to layer on the NOAA global windfield from GFS. Here the NOAA global Real Time Ocean Forecast System (RTOFS), starting at day 0, looks back 2 days and extracts from GOFS 3.1 its initial condition (IC). That initial condition is then run forward back up to day 0 without data assimilation with forcing from the EMC GDAS. Then on day 0, the wind forcing is switch to GFS to run RTOFS for several days into the future. Starting in August 2020, it is anticipated that and experimental version of RTOFS Data Assimilation (RTOFS-DA) will be run. Thus there are 3 US global ocean models to compare to observations this coming hurricane season – operational GOFS3.1 with NCODA, operational ROTFS without data assimilation, and experimental RTOFS with RTOFS-DA. We hope to expand this to include the European global ocean forecast system available through Copernicus.
Step 3 is to extract initial conditions (IC) and Boundary Conditions (BC) from RTOFS every 6 hours to initialize the regional ocean models that are coupled to the atmospheric forecast models HMON and HWRF. The operational HMON atmospheric model is coupled to a regional HYCOM ocean model. The HWRF atmospheric model is coupled to both HYCOM and POM ocean models. It is anticipated that for the 2020 hurricane season, the operational HWRF will be coupled to POM, and an experimental HWRF will be coupled to HYCOM. This makes at least 3 different oceans that will be present under hurricanes this season. The commonality in 2020 is that all 3 oceans will start from the same initial condition provided by ROTFS every 6 hours. The difference will be what ocean model and what windfield is used to evolve the initial conditions, and how much difference that makes during the storm forecast.
-
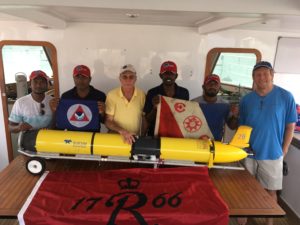
RU29 – 2 years ago
Posted on November 8th, 2018 No commentsChari just sent this photo from the Perth glider port looking back 2 years at the re-christening of RU29 with water from the Indian Ocean before the start of its historic mission within IIOE-2.
Looking back at all that was accomplished, I first think of all the people that made it possible. Working together, we advanced the technology, we explored an ocean with new threats, and we overcame new challenges on shore. We made new friends, and together, accomplished something that was hard. Some call these types of friends comrades, some call them mates. In Spanish, we call them companeros. Our co-workers, our partners, our equals. All dedicated to a common goal. Companeros have a bond that has been tested, and a bond that has survived, because of a shared vision that is bigger than our differences.
With the return of RU29, we now focus our attention on the next mission. I look forward to working with all of you as we prepare to redeploy from Spain in September of 2019. The preparations will be hard, and seeing the mission through to the end will be even harder.
But we are companeros.
Borrowing words from our global navigator – Force, wind and honor all.
-
Recovery Team Photos
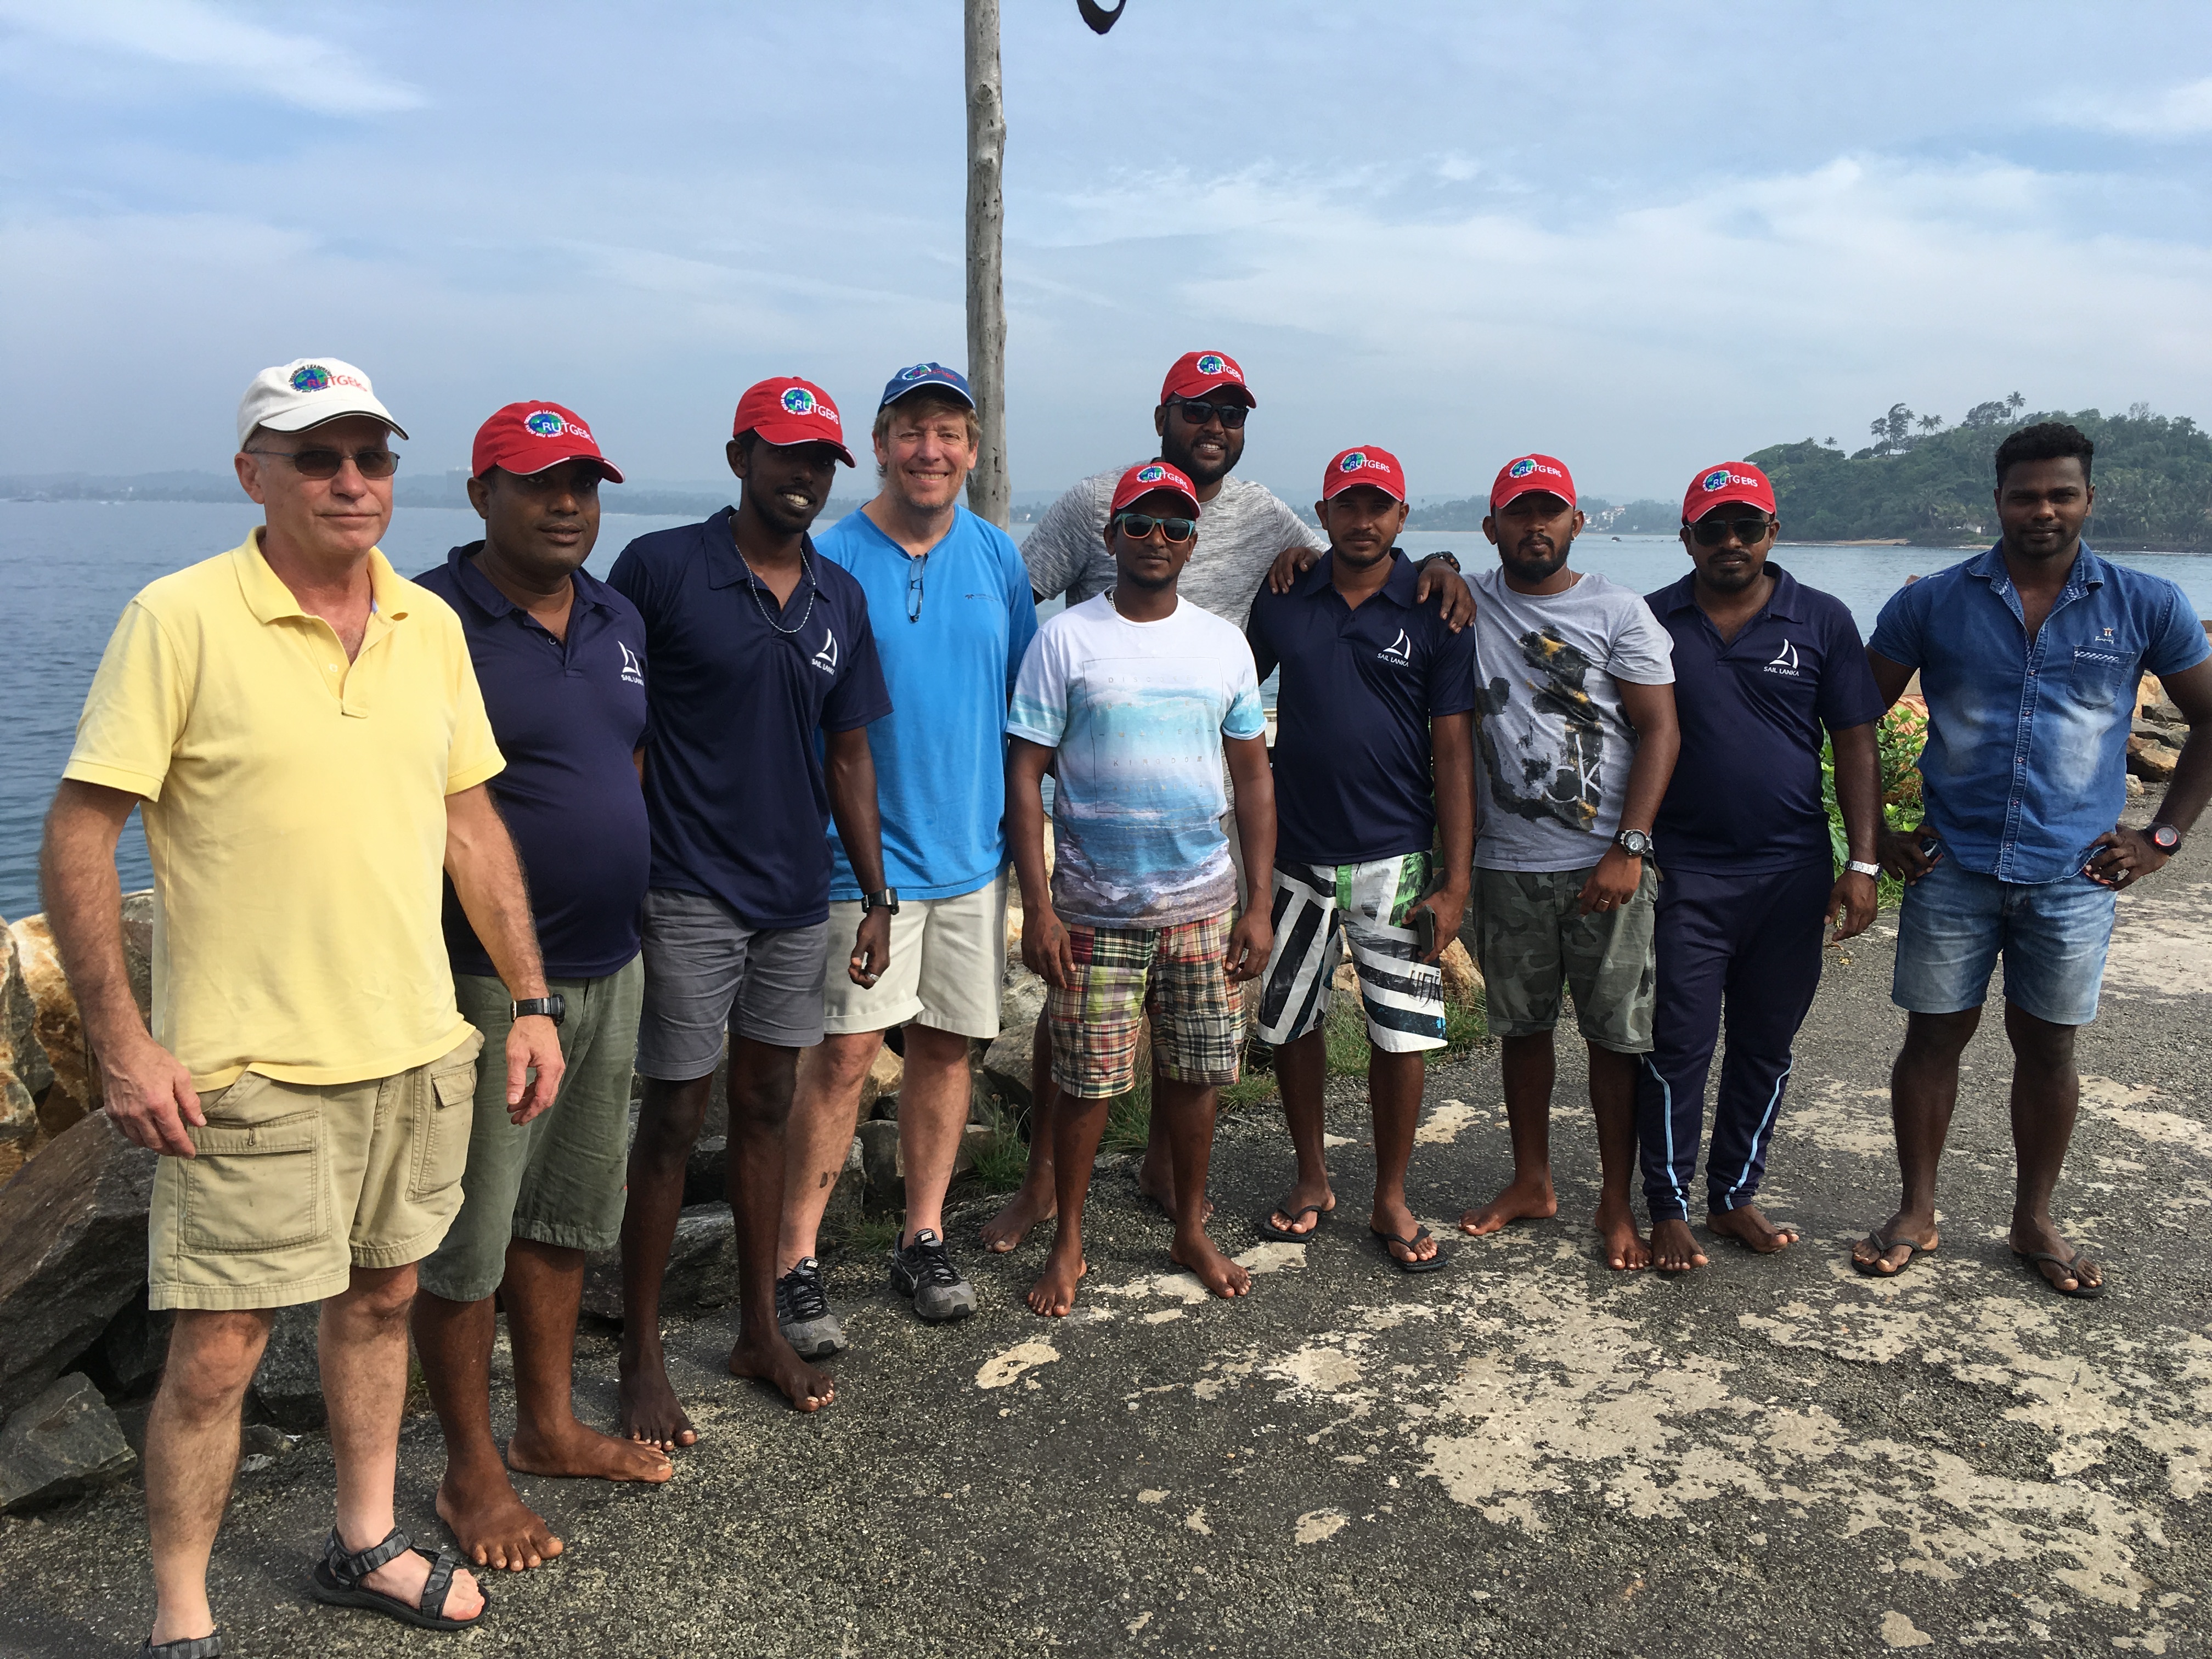
Posted on November 2nd, 2018 No commentsRU29 recovery team arrives at the fishing port of Marissa. Flags are from NOAA, the Explorers Club and Rutgers. Captain and crew of the Marissa wearing red RUCOOL caps.
Entire group back onshore by the Marissa Fishing Marina.

-
RU29 Damage – First look
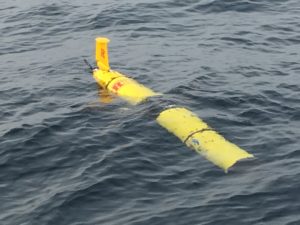
Posted on November 2nd, 2018 No commentsFirst approach. Usual barnacles. Rudder is still attached but is hard over.
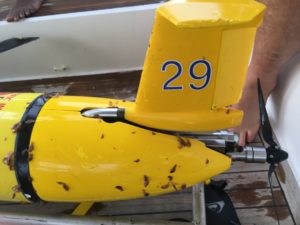
On board the Crystal. Deep scratches on the tail, port side.
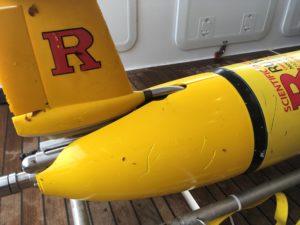
Deeper scratches on the starboard side.
Forward energy bay has numerous scratches.
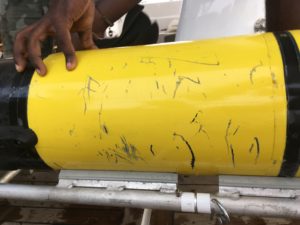
Pitch battery hull scratched on the bottom.

-
Hello from Marissa
Posted on November 1st, 2018 No commentsOscar and I are here in Marissa, same place we picked up RU29 after its record breaking mission flying from Perth, Australia.

RU29 is currently 8 nautical miles due south of Marissa Harbor. It is still in deep water to help with station keeping. The surface currents are strong, so we like to wait at depth.
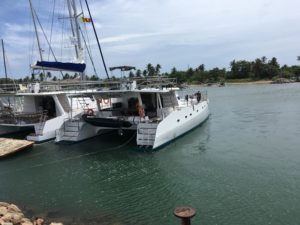
Our boat is the catamaran Crystal. We stopped by today to see the vessel and meet the captain and crew. We have two staircases down to the water level platform, one on each side. The captain and lookouts will be on the upper deck as we approach the glider.
Tomorrow’s schedule in Sri Lanka times:
Van pick up at hotel 4:30 am. At boat by 5 am. Boat loaded and set up for 5:30 am – 6:00 am departure. On site by about 7 am our time. We’ll get the current location of RU29, and a waypoint to head to that is just to the east of the current location. We head to our waypoint and then turn west, approaching the glider with the sun at our back. We will be standing on the upper deck looking for the glider with the Iridium phone getting text updates of location and the gps to let us know which way to go.
-
70 kilometers to pick up point
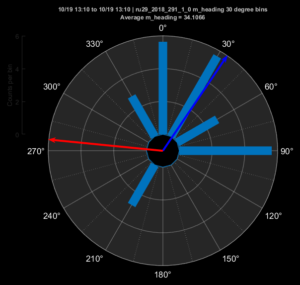
Posted on October 20th, 2018 No commentsWe did some tests flight tests on Friday, and are now back to heading towards the pick up point. The latest measured heading plot shows RU29 is now flying about 60 degrees to the right of the commanded heading.
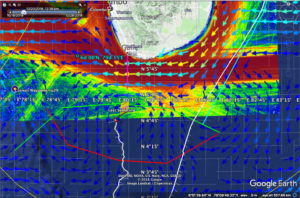
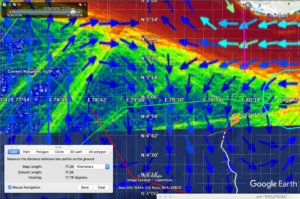
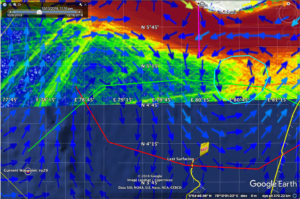
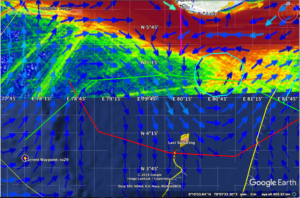
Below image is zoomed into the local area with the new Copernicus model currents. The direction we want to head is to the NE, at a heading of about 30 degrees. With the 60 degree offset noted above, we can give RU29 a waypoint that is to the NW at a heading of 330 degrees. That new waypoint is shown in the cyan color.
The Copernicus currents show that there is a strong current to the west just south of Sri Lanka in the region with the high vessel traffic. That means there are two hazards if we move into that area, vessels that can hit us and currents that can sweep us away.
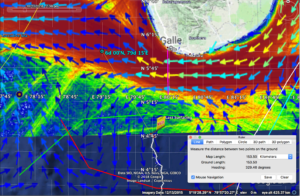
Below is the important model comparison. You always hope the models agree so that you have more confidence in the currents.
First is Copernicus, the European model. There is a strong alongshore current to the west offshore suthern Sri Lanka that covers the shipping lanes in red. RU29 is in a relatively low current zone, near the middle to western side of a counterclockwise eddy. Currents at RU29 are weak ant to the south.
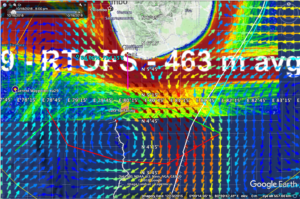
Now for the two US models. First the Navy HYCOM. Here RU29 is on the eastern side of a very strong and elongated clockwise eddy. The elongation is in the direction of altimeter tracks – wish I could overlay them somehow. The strong eddy is disrupting the alongshore flow by southwestern Sri Lanka and turning it to the east. Currents at RU29 are strong and to the southeast.
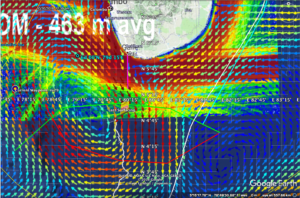
Last is NOAA RTOFs. Same story as Hycom, bit now the eddy is round, not elongated like an altimeter track.
-
Position prior to flight tests
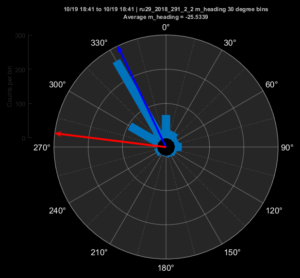
Posted on October 19th, 2018 No commentsMeasured heading rose has RU29 flying about 115 degrees to the right of the commanded heading
We made the waypoint change to give a commanded heading near 300 degrees. This turned the glider to fly more like an ENE direction, directly at our proposed pick up point. We are 70 km away from that point that is 40 nautical miles south of Galle, Sri Lanka and is right on the souther edge of the shipping lanes. We have been making about 15 km of progress per day.
We will be doing some flight tests for the remainder of this day (friday) in preparation for the station keeping we will need to do at the pick up point.
-
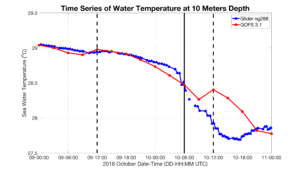
Rapid near surface temperature change in Michael
Posted on October 18th, 2018 No commentsHere is a comparison of the temperature in the upper mixed layer (10 m depth and 20 m depth) at the location of Navy Glider 288. Hurricane Michael passed within less than 50 km of ng288. The swath of tropical wind scale winds was about 500 km wide, so this was relatively close to the track of the hurricane. And the glider was on the right had side of the track, so perfectly placed in the most intense winds.
Solid black vertical line is time of hurricane eye passage over Navy Glider 288. Dashed black vertical lines are data assimilation times.
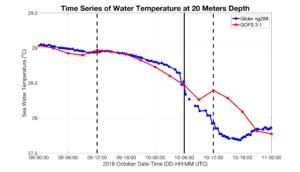
The agreement between the surface layer temperature observed by ng288 and the GOFS 3.1 forecast is remarkable. The model even appears to be cooling the surface layer at the proper rate. Note that most of the observed cooling occurs after eye passage, the opposite of what we see in the Mid Atlantic.
The dashed line at 1200 on Oct 10 will be an interesting case to study with our colleagues. We assume the glider data is being assimilated, our friends at NRL are good at checking for this. During this time of rapid temperature change, if glider data from earlier in the day is assumed to apply at noon on Oct 10, it will try to increase the temperature as we observe here. The model then appears to cool the temperature at the right rate despite being incorrectly offset boy about 0.5C.
Establishing what happened through the data assimilation during the passage of Michael over ng288 will be a great research question for us to prusue over the winter as we prepare for the 2019 hurricane season.
-
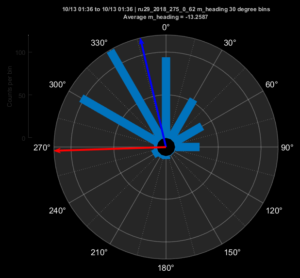
Third Test – same answer
Posted on October 13th, 2018 No commentsWaypoint to west, with commanded heading in red towards 270 degrees. Average heading towards 30 degrees, or 120 degrees to the right of the commanded heading.
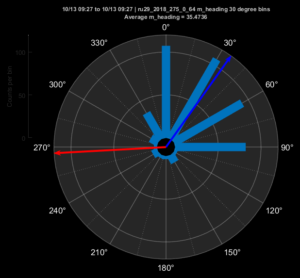
Glider moved in the direction of the averaging heading, towards the northeast. So no currents for third try, Copernicus (the currents shown here) is a clear winner.
We are 150 km from our intended pick up point just south of the shipping lanes. We are averaging 15 km/day. So 10 days from today, Oct 13, is Tuesday, Oct 23. Gives us a several day window for unexpected currents beyond that.
-
Second test – time to shift waypoint north
Posted on October 13th, 2018 No commentsThe heading rose plot from the last segment has an average heading 75 degrees to the right of the commanded heading. So we do not have an steady offset or trend. Sometimes the offset is less than 90 degrees to the right. Sometimes more. But it tends to oscillate around 90 degrees to the right of the commanded heading.
During this segment the glider moved to the northwest, in the direction of the average heading. So the currents are low. More evidence copernicus model is right. Copernicus currents are shown here.
So our plan is to continue sliding the waypoint north a little bit each day and walk this glider up to the edge of the shipping lanes, about 40 nautical miles south of Galle.
Current waypoint is just south of 4 N. We can shift it 10′ north to about 4 degrees, 10′ north before the next surfacing in early afternoon.